Leave a Message

Thank you for your message. We will be in touch with you shortly.

As interest rates continue to fall, median monthly P&I payments do as well, making housing slowly but surely more affordable on a national scale.

As interest rates continue to fall, median monthly P&I payments do as well, making housing slowly but surely more affordable on a national scale.

The Big Story
Quick Take:
  • As interest rates continue to fall, median monthly P&I payments do as well, making housing slowly but surely more affordable on a national scale.
  • Mortgage rates are currently at the lowest point they’ve been at in recent years, as the Fed continues its rate cut cycle.
  • Despite falling interest rates, inventories still remain higher than they were at this point last year.
  • We very briefly saw rates break the 6% mark recently, following some commentary from Trump regarding the purchase of mortgage-backed securities by Fannie and Freddie.
 
Note: You can find the charts & graphs for the Big Story at the end of the following section.
*National Association of REALTORS® data is released two months behind, so we estimate the most recent month's data when possible and appropriate.
 
Homeownership is slowly but surely becoming more attainable
With the median monthly P&I payment hitting $2,056 in November, that marks a considerable decrease from the $2,311 maximum that we hit earlier in the year. As you might have guessed, this is largely due to interest rates declining, as the Federal Reserve continues its rate cutting cycle. In November of 2024, interest rates were at 6.79%, compared to 6.22% in November of 2025. This represents an 8.39% decrease in interest rates on a year-over-year basis, while the median sale price of a home in the US actually increased by 1.19% during that same period of time. As interest rates slowly creep down, we will likely see home values continue to increase, as the deciding factor for most people is not the total purchase amount, but instead the monthly payment that they can afford.
Mortgage rates fall to the lowest levels we’ve seen in years
As we mentioned in the prior section, interest rates continue to creep lower and lower. We saw rates hit 6.22% in November, and have fallen even further since then. As of right now, the average interest rate for a 30 year, fixed rate mortgage is sitting around 6.06%, which is actually a slight increase from what we briefly saw last week. Unfortunately, some recent commentary from the Fed has led markets to believe we won’t see a rate cut as a result of the January FOMC meeting, as CME FedWatch puts the probability of a 25 bps cut at just 5% for January. However, it’ll be important to pay attention to the economic data that’s being released over the coming months, as it’ll give us a good idea of where we can expect rates to go in the near term future.
Although mortgage rates are down, inventories are up!
While you might expect inventories to decrease as interest rates decrease, that wasn’t the case in November. In fact, we saw inventories increase by 7.52% on a year-over-year basis, despite falling rates. This is largely attributable to the fact that existing home sales decreased by roughly half a percent while new home listings increased by roughly 1.7% on a year-over-year basis. We’ll likely see inventories continue to increase as we move through the winter months, until the usual spring rush begins and inventories start to move once again. Overally, we had a very different year in terms of market dynamics in 2025, so it’ll be interesting to watch where the market goes in 2026.
Keep an eye on the market as we move through 2026
We’ve gotten to the point where rates have been so high for so long, that there is a considerable cohort of people that’s waiting on the sidelines, carefully watching interest rates. This cohort of people is ready to make a move on their first home, or is looking for a good point in time to sell their existing home and move. Lately we’ve seen quite a bit of commentary out of the Federal Reserve that has markets thinking we’ll see rate cuts, especially when you couple this with the commentary regarding interest rates coming from the executive branch. If we do see some steeper rate cuts (more than the 25 bps cuts we’ve seen recently), then moving quickly will be pivotal for you and your clients, as bigger cuts will likely lead to the floodgates opening!
 
Of course, this is all what we’re seeing at a national, macro level. As we all know, real estate is a localized game, so be sure to check out your local lowdown below, to see what’s going on in your market!
Big Story Data
The Local Lowdown
Quick Take:
  • The Bay Area closed out 2025 with unprecedented inventory contraction, with most regions experiencing 20-40% year-over-year inventory declines as the holiday season accelerated a dramatic shift toward seller's markets.
  • San Francisco led regional price appreciation with single-family homes up 8.63% and inventory hitting historic lows of just 93 homes for sale, while other regions showed more mixed results with pockets of softness.
  • Days on market trends diverged sharply across the region, with San Francisco and parts of the East Bay accelerating while other areas like Santa Cruz County experienced significant slowdowns despite tight inventory.
  • The entire Bay Area has transformed into seller's market territory across nearly all property types, with several regions reaching extreme supply constraints not seen in years.
Note: You can find the charts/graphs for the Local Lowdown at the end of this section.
Price trends reveal regional divergence as the year closes
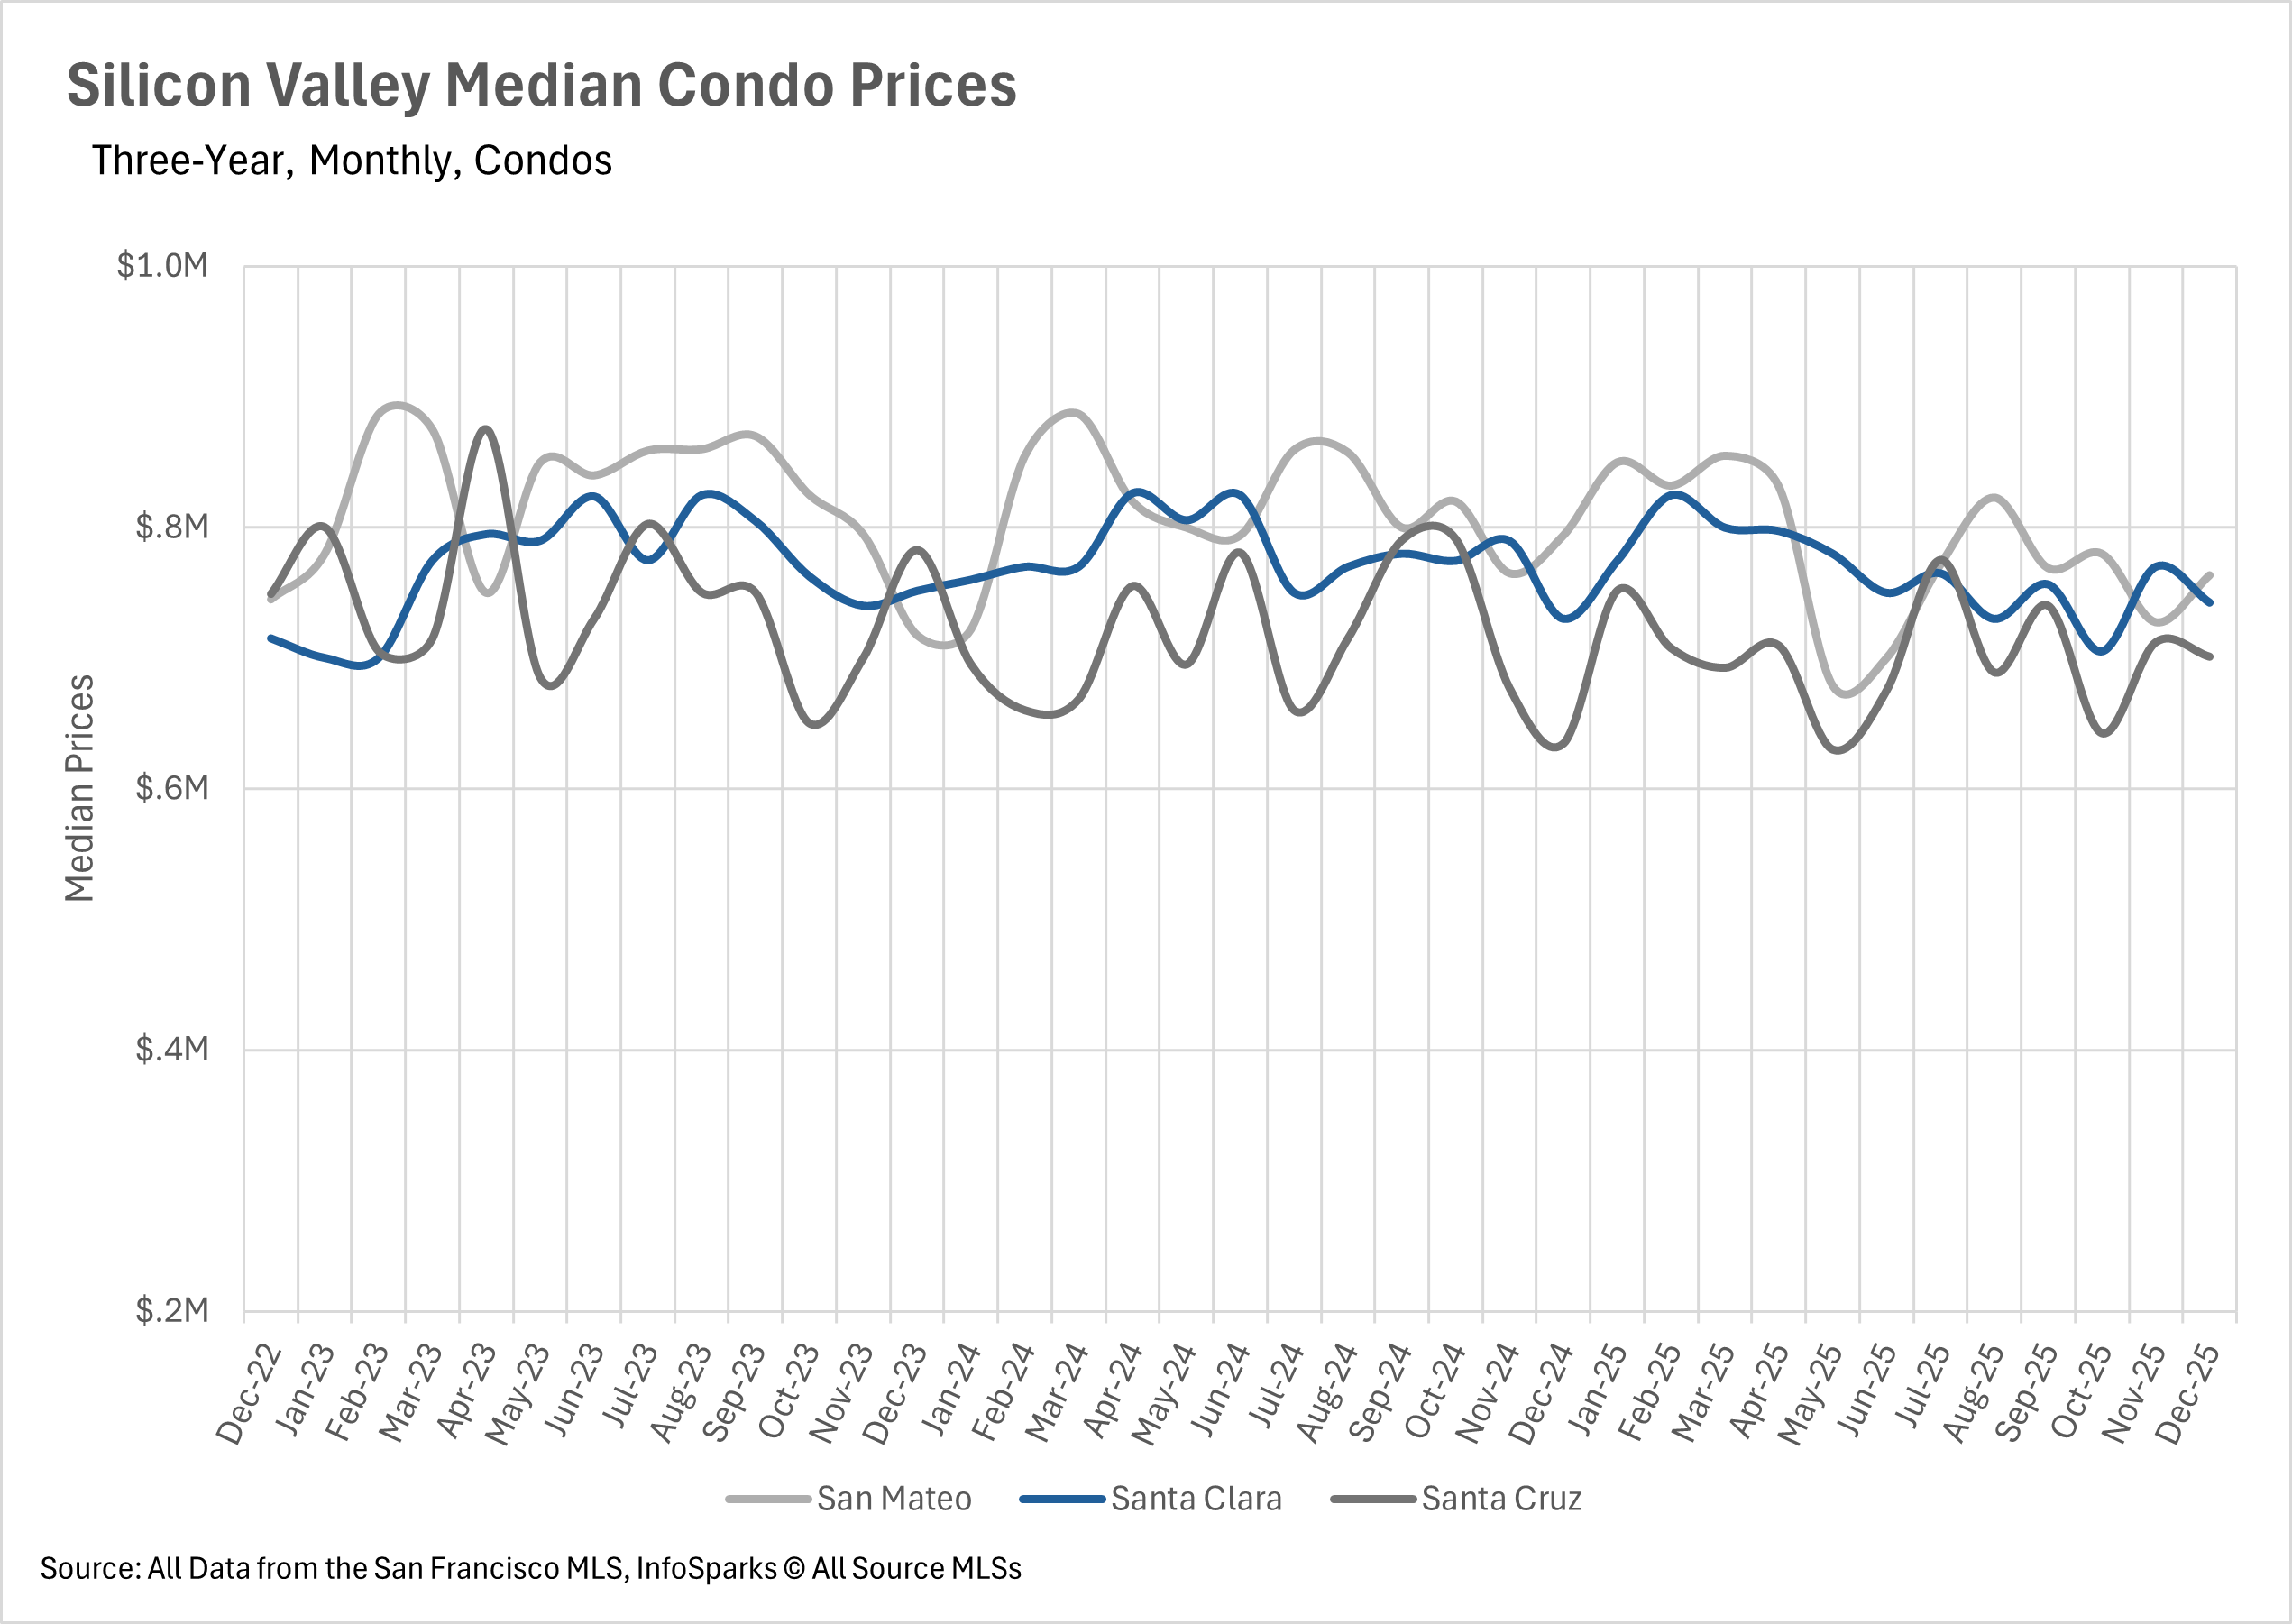
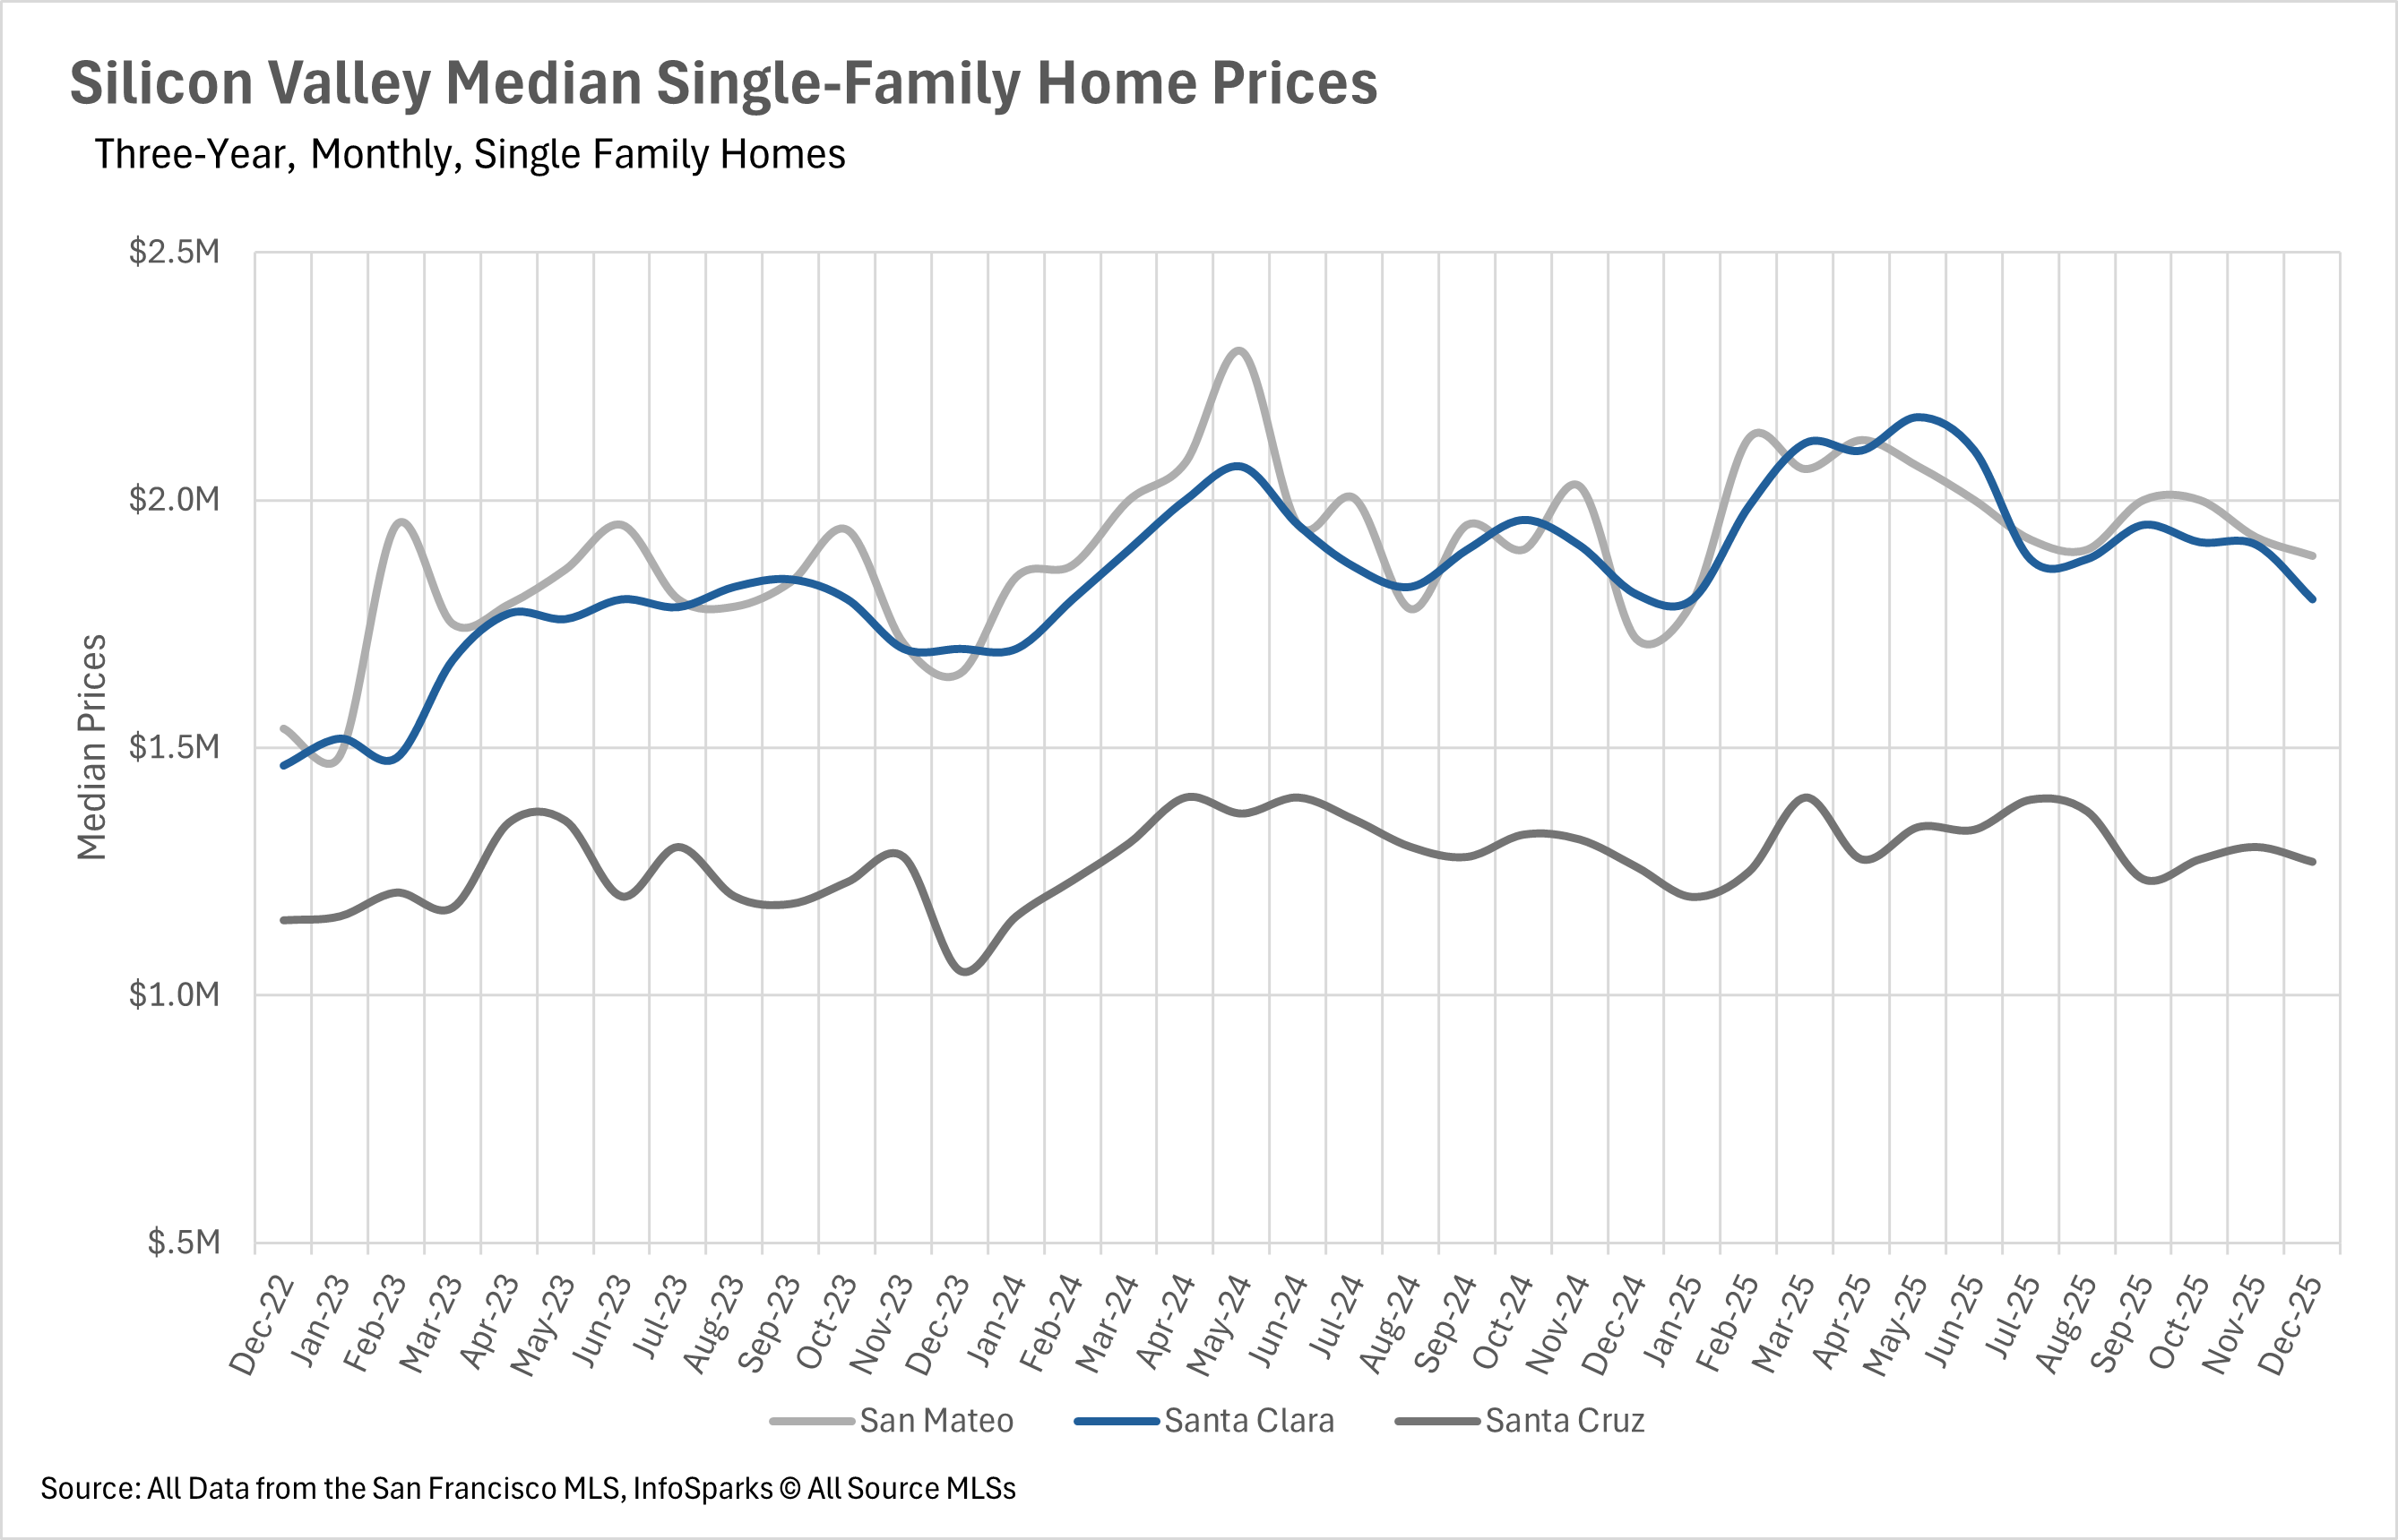
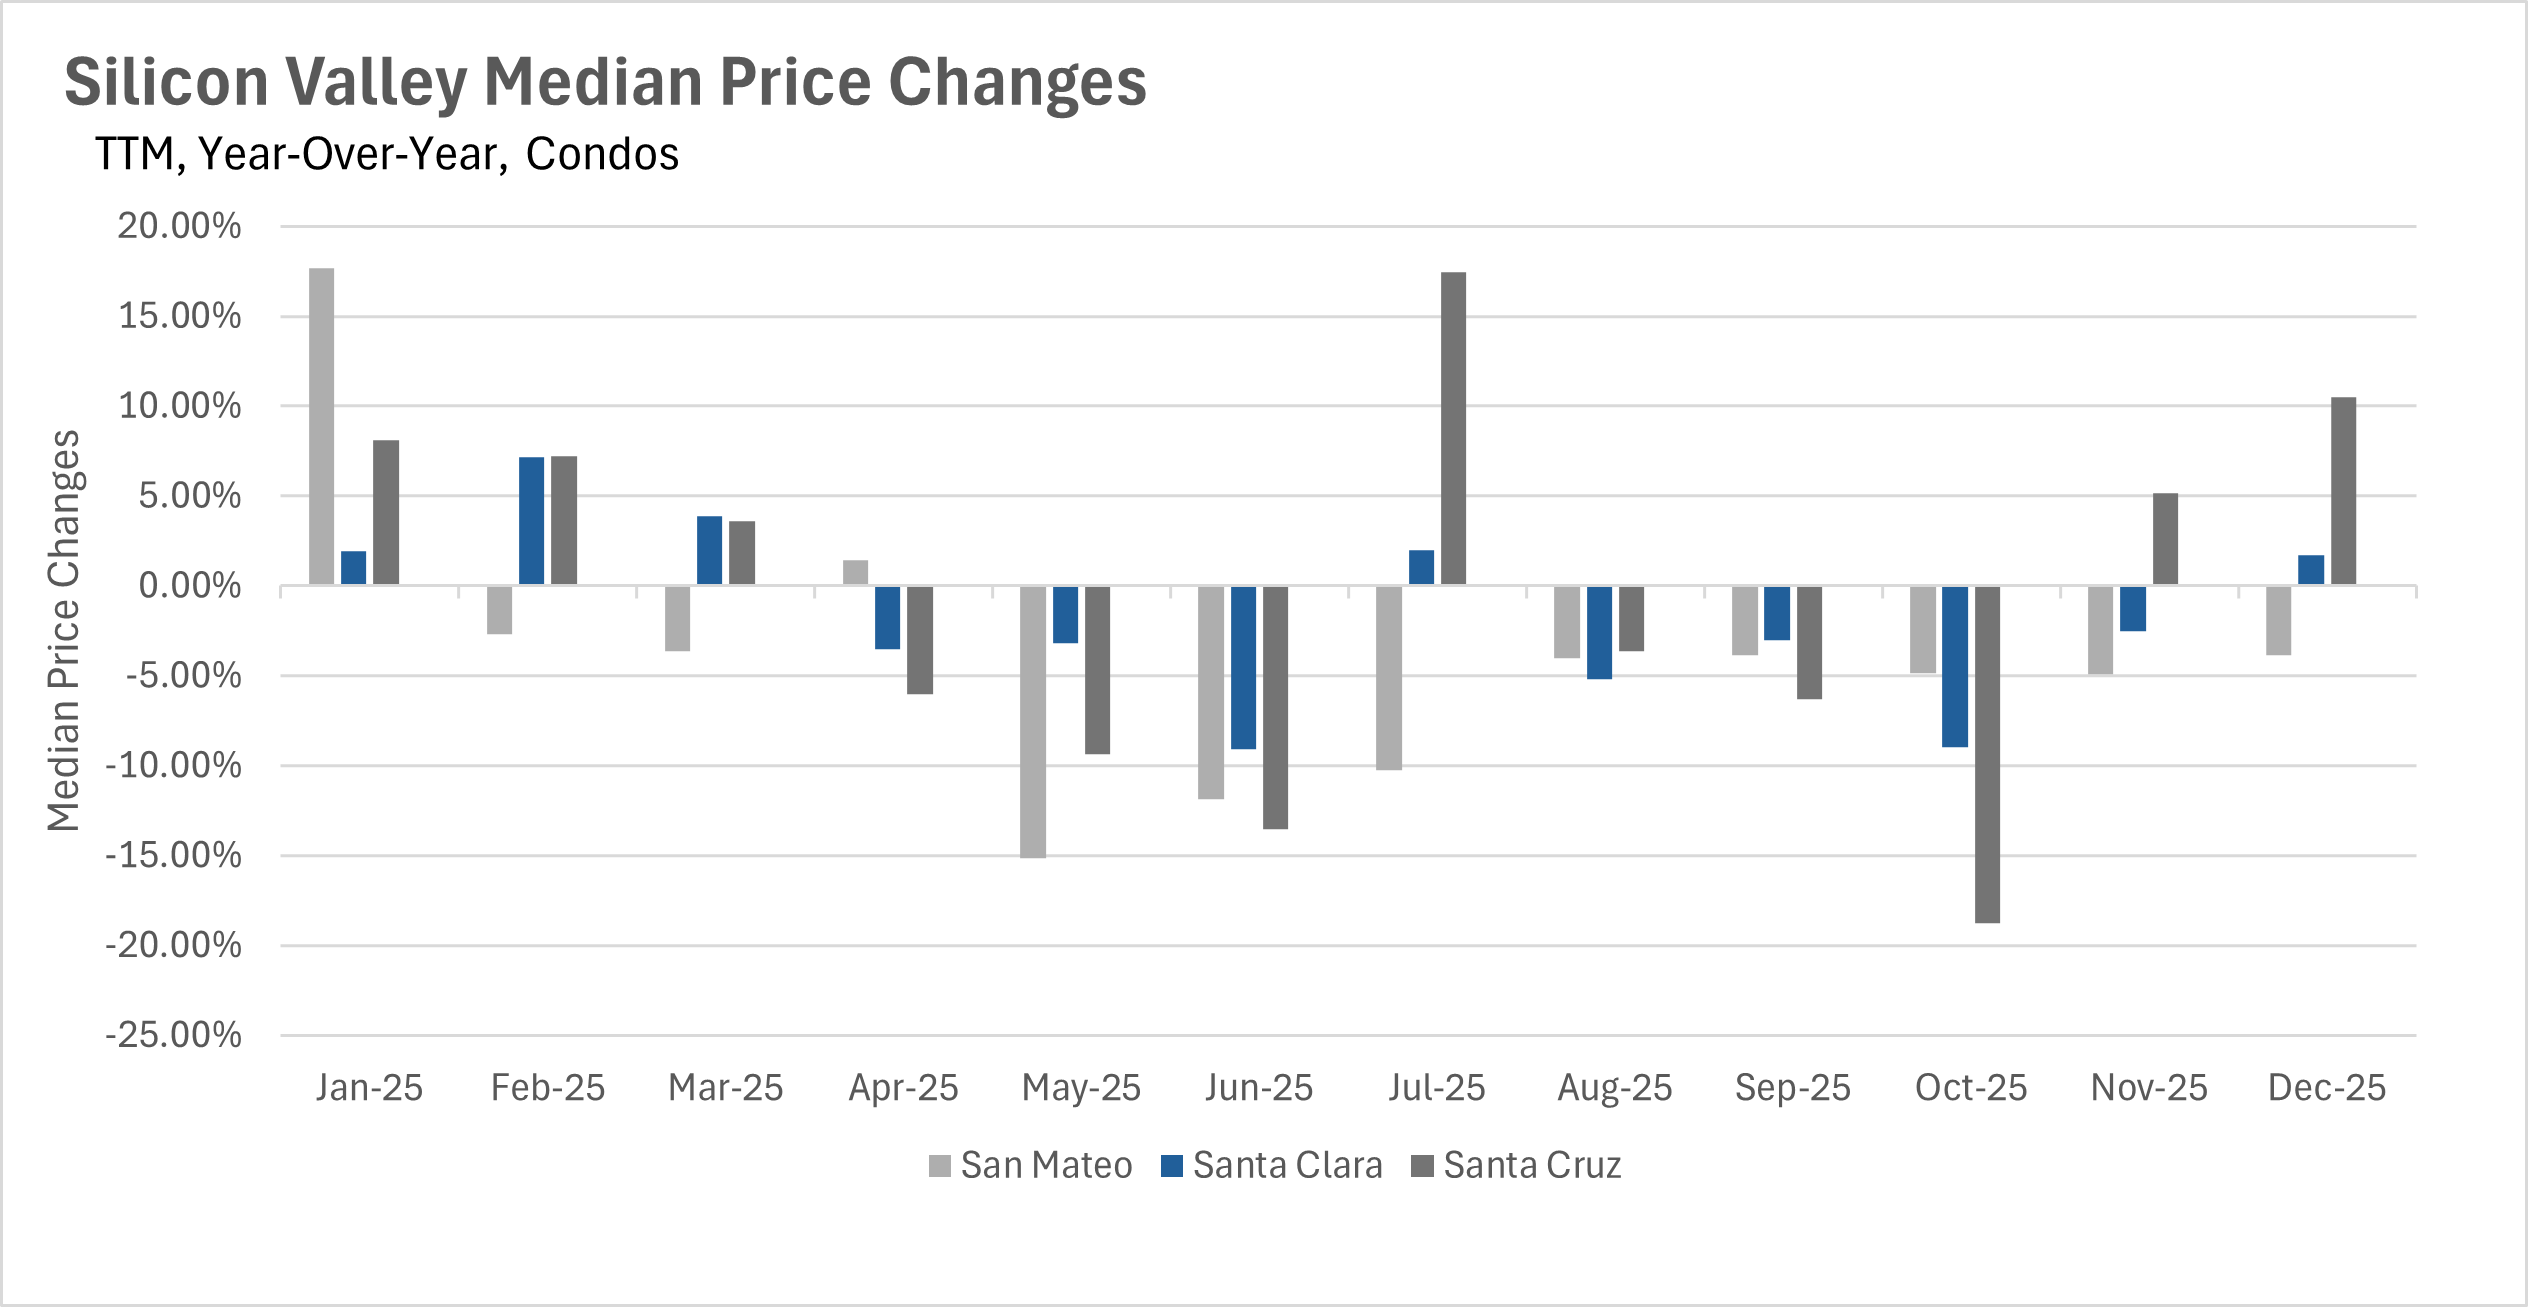
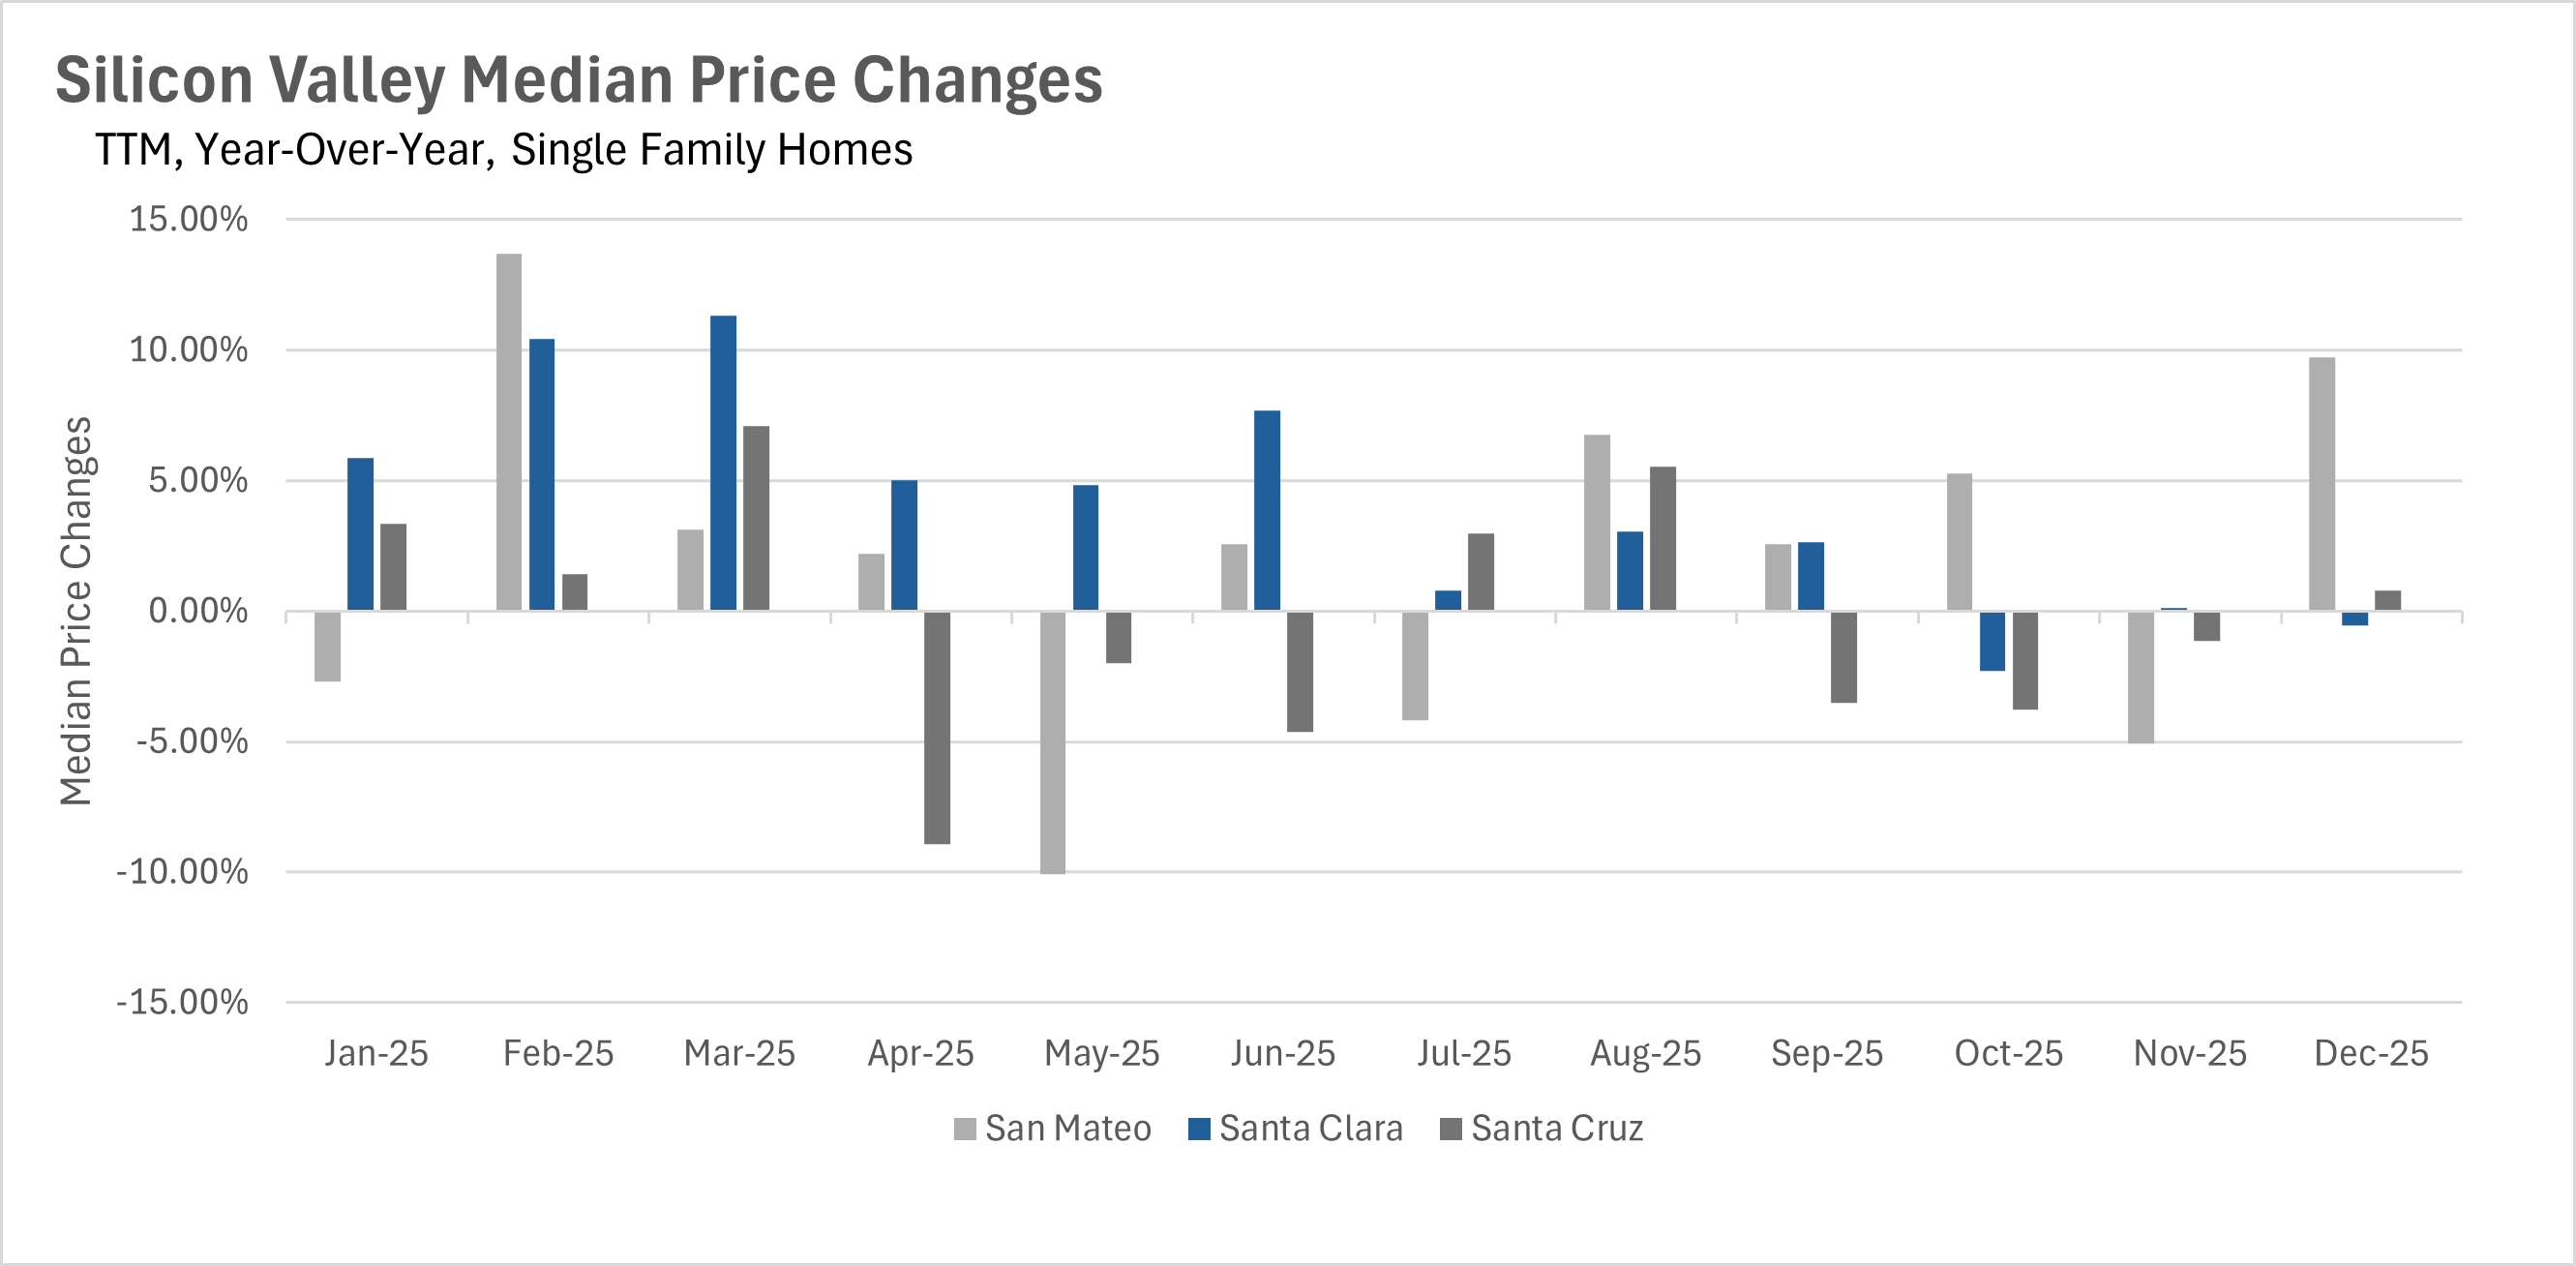
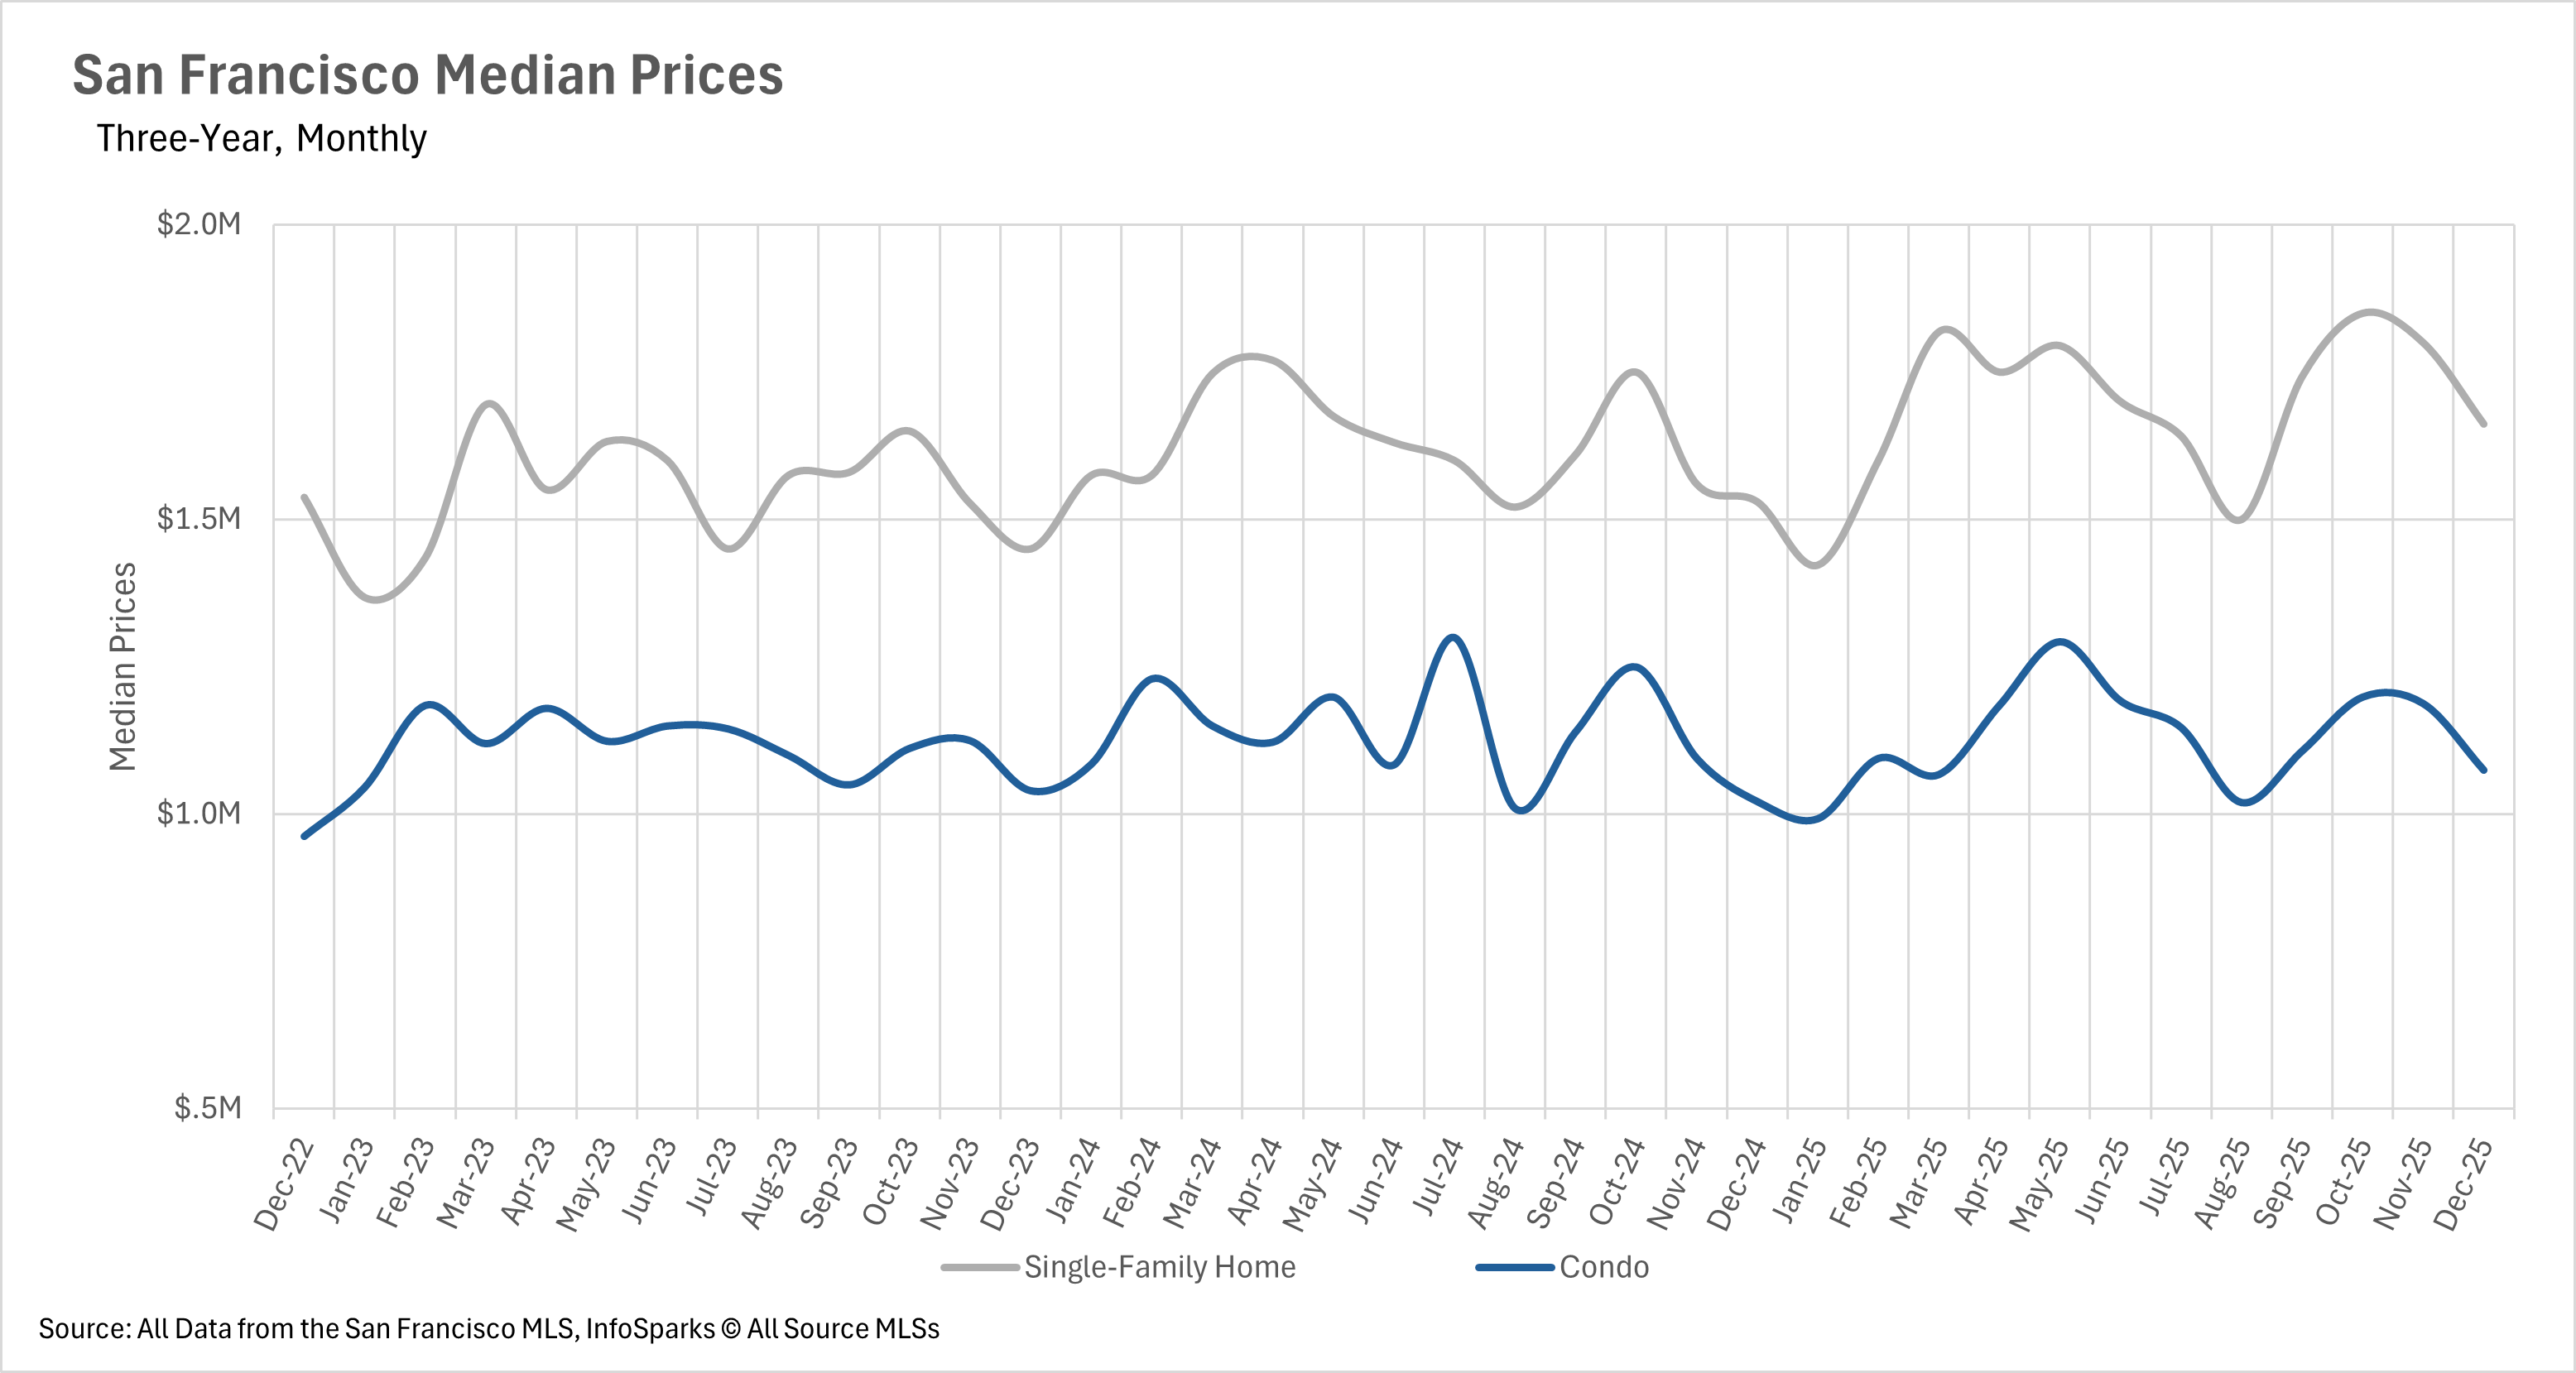
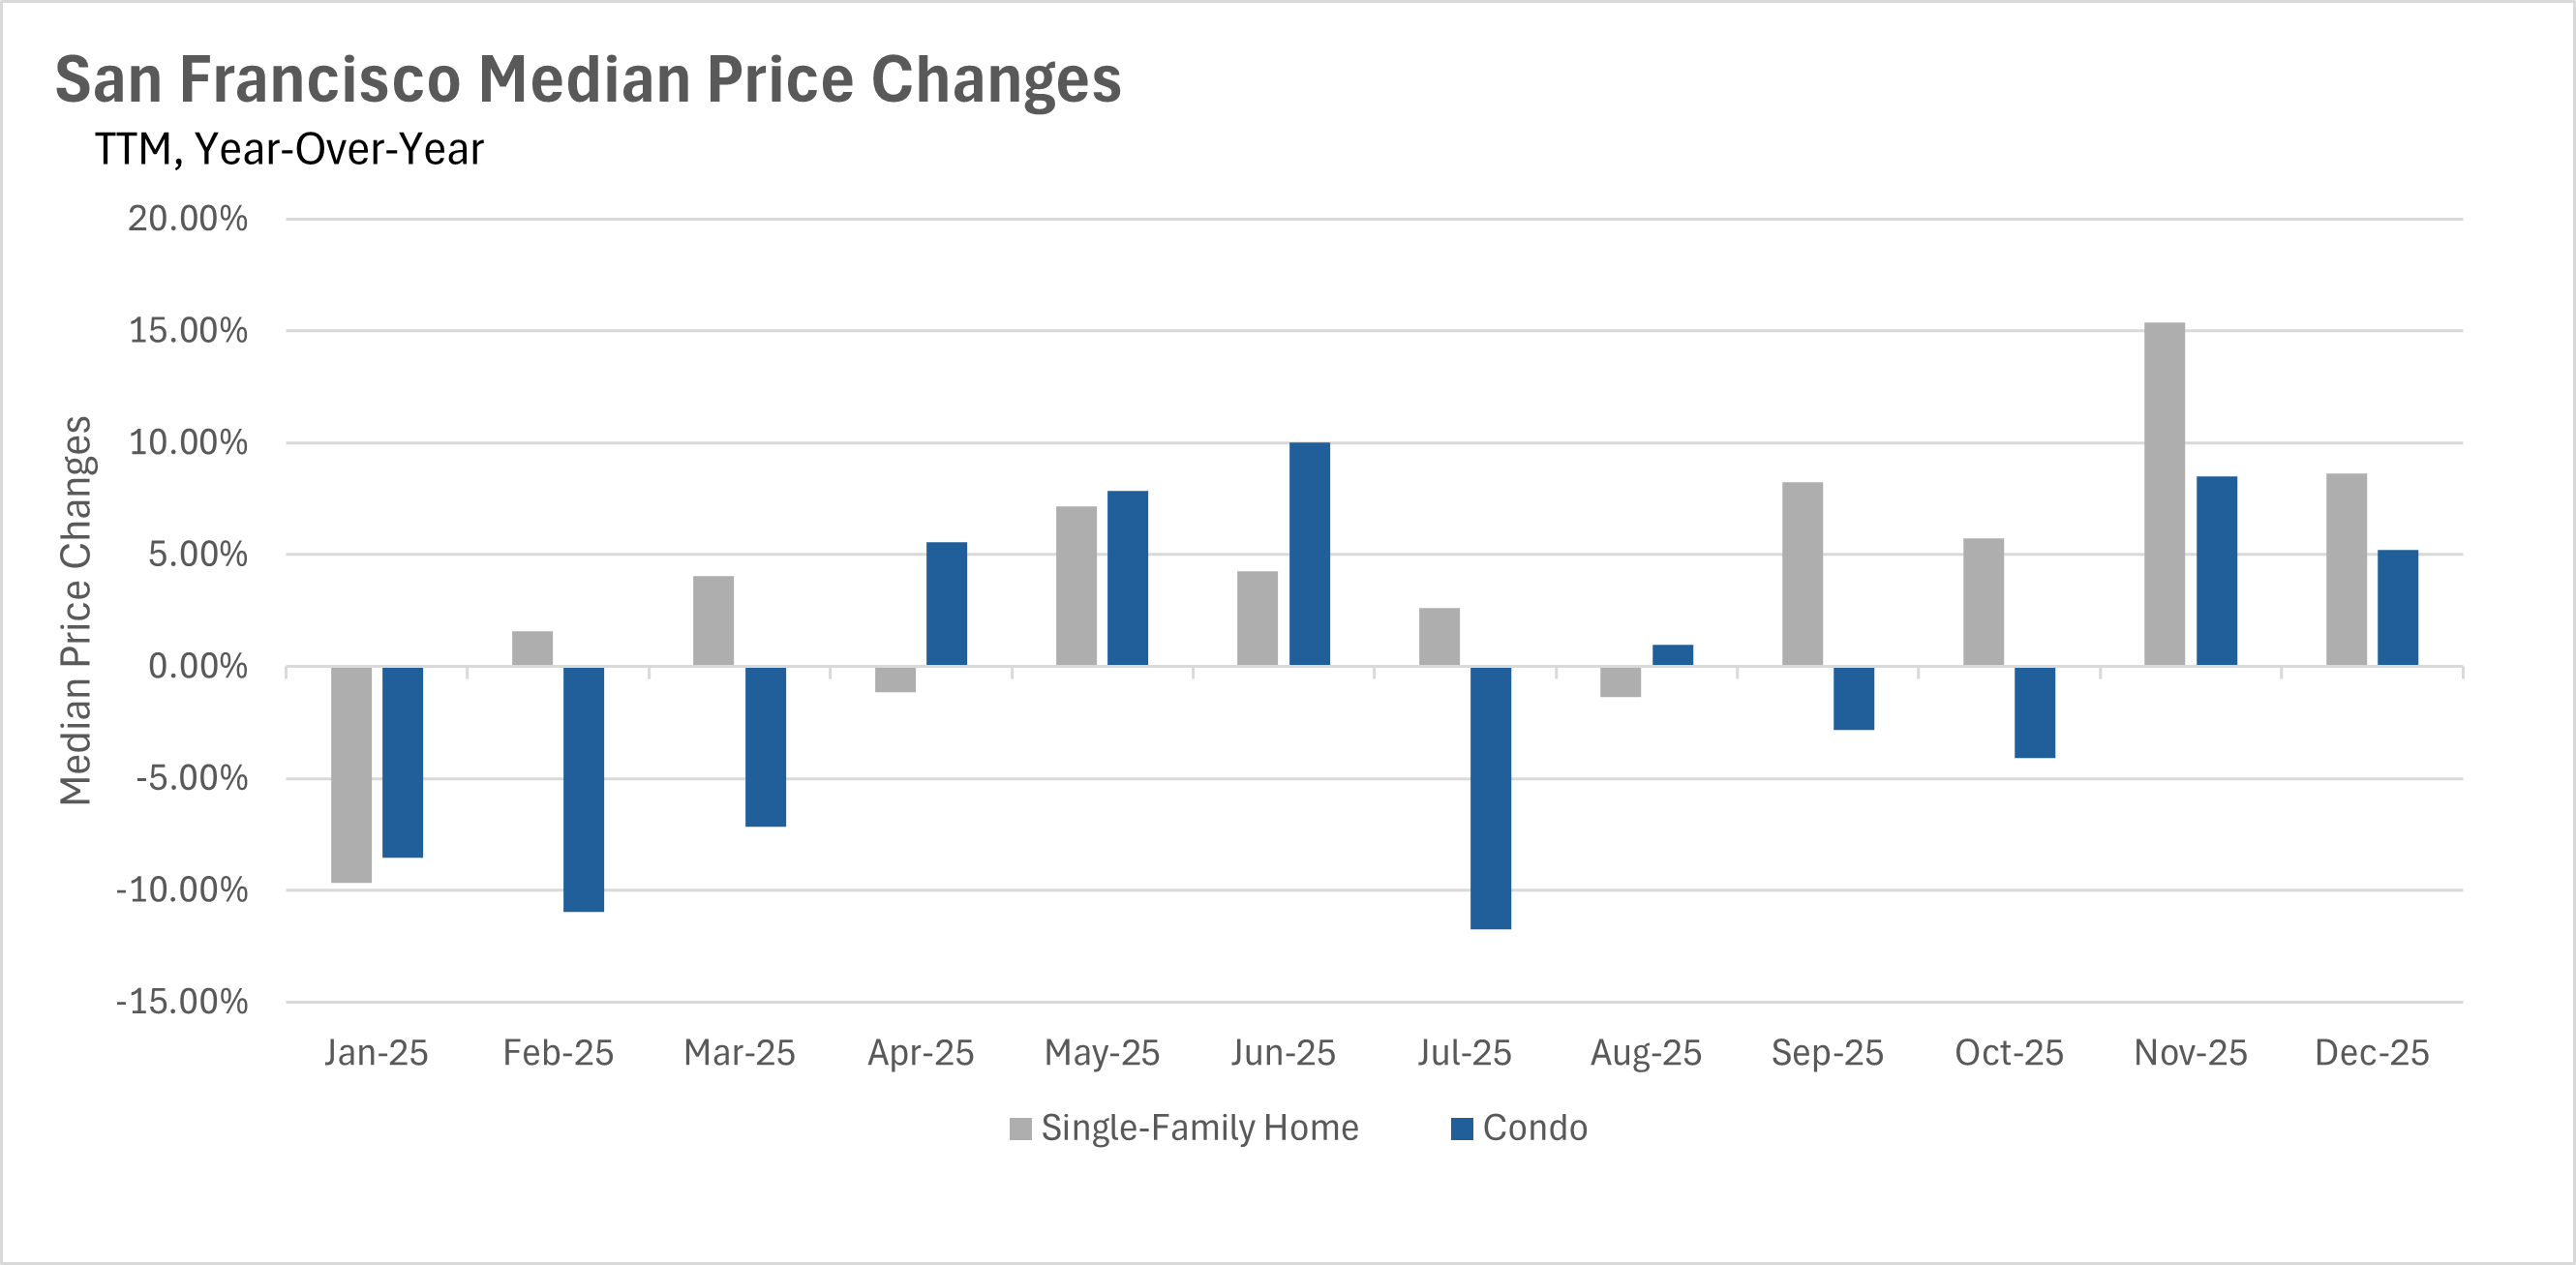
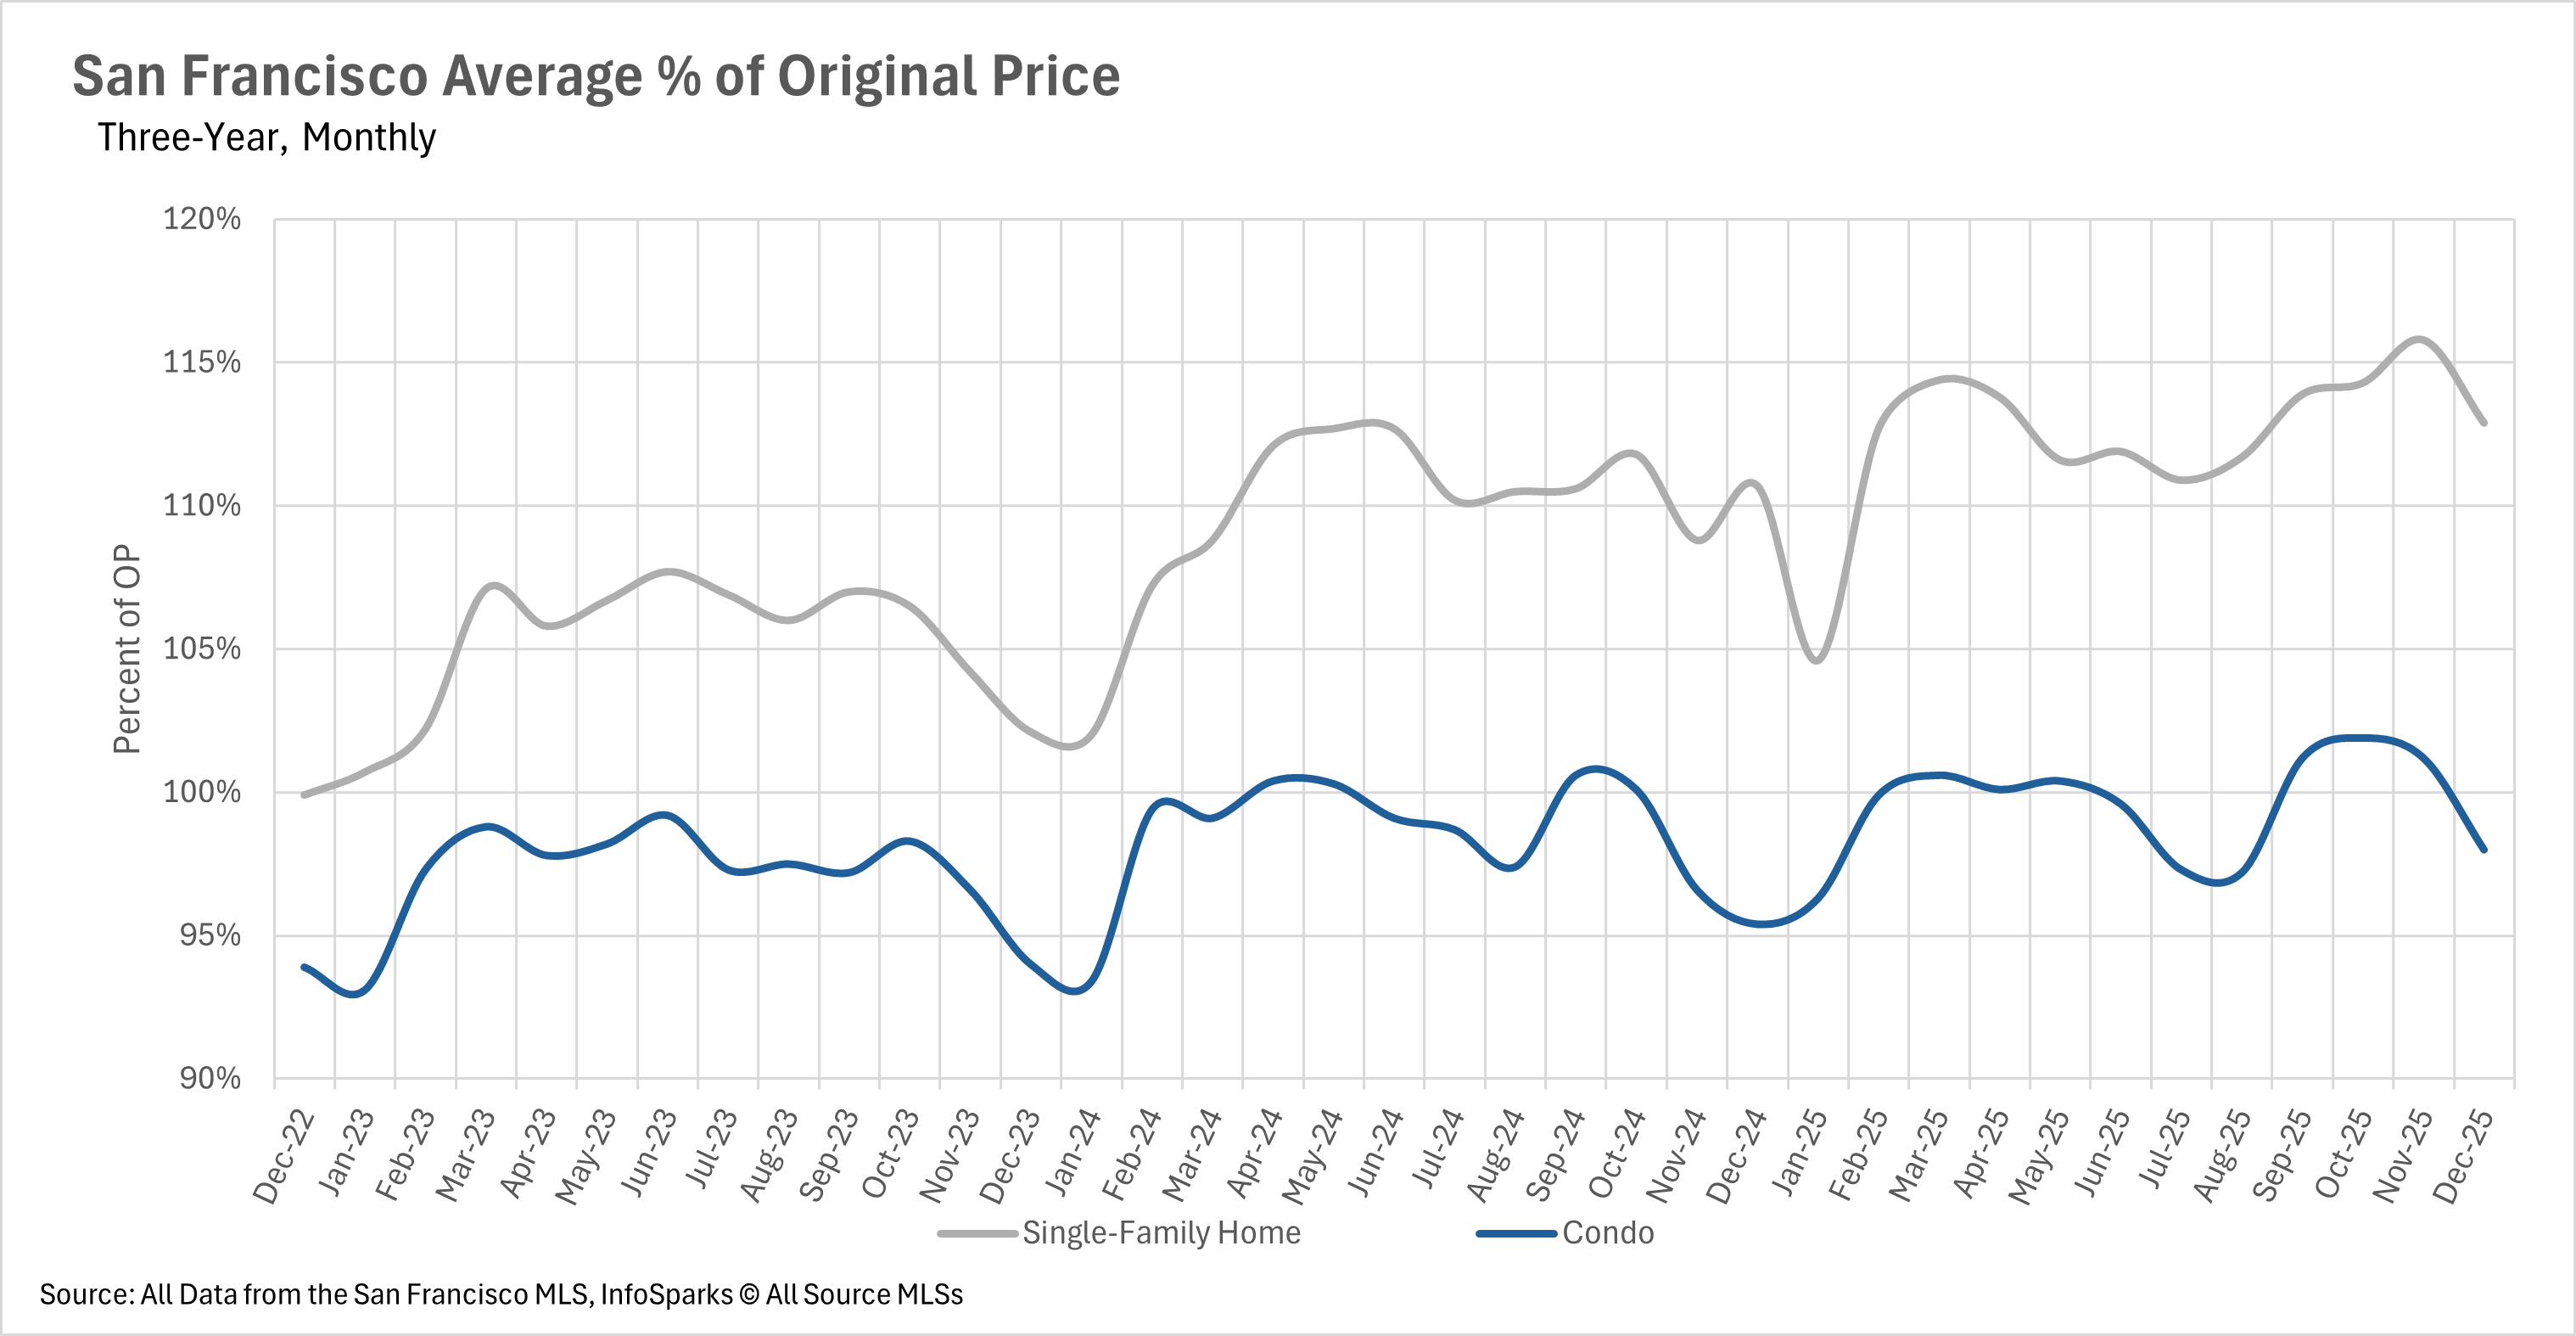
December brought mixed price performance across the Bay Area, with San Francisco leading appreciation while other regions showed varying results. San Francisco ended 2025 on a high note with single-family homes gaining 8.63% year-over-year to reach a median of $1,662,000, while condos rose 5.21% to $1,075,000. Single-family homes continue commanding significant premiums, selling for nearly 13% over asking price. Silicon Valley experienced a December rebound after November's rare across-the-board declines, with San Mateo County leading at 9.74% year-over-year gains to $1,887,500, while Santa Clara County saw a modest 0.55% decline to $1,800,000 and Santa Cruz remained relatively stable with a 0.79% increase to $1,270,000. Silicon Valley condos showed volatility, with San Mateo down 3.84%, Santa Clara up 1.71%, and Santa Cruz surging 10.48%.
 
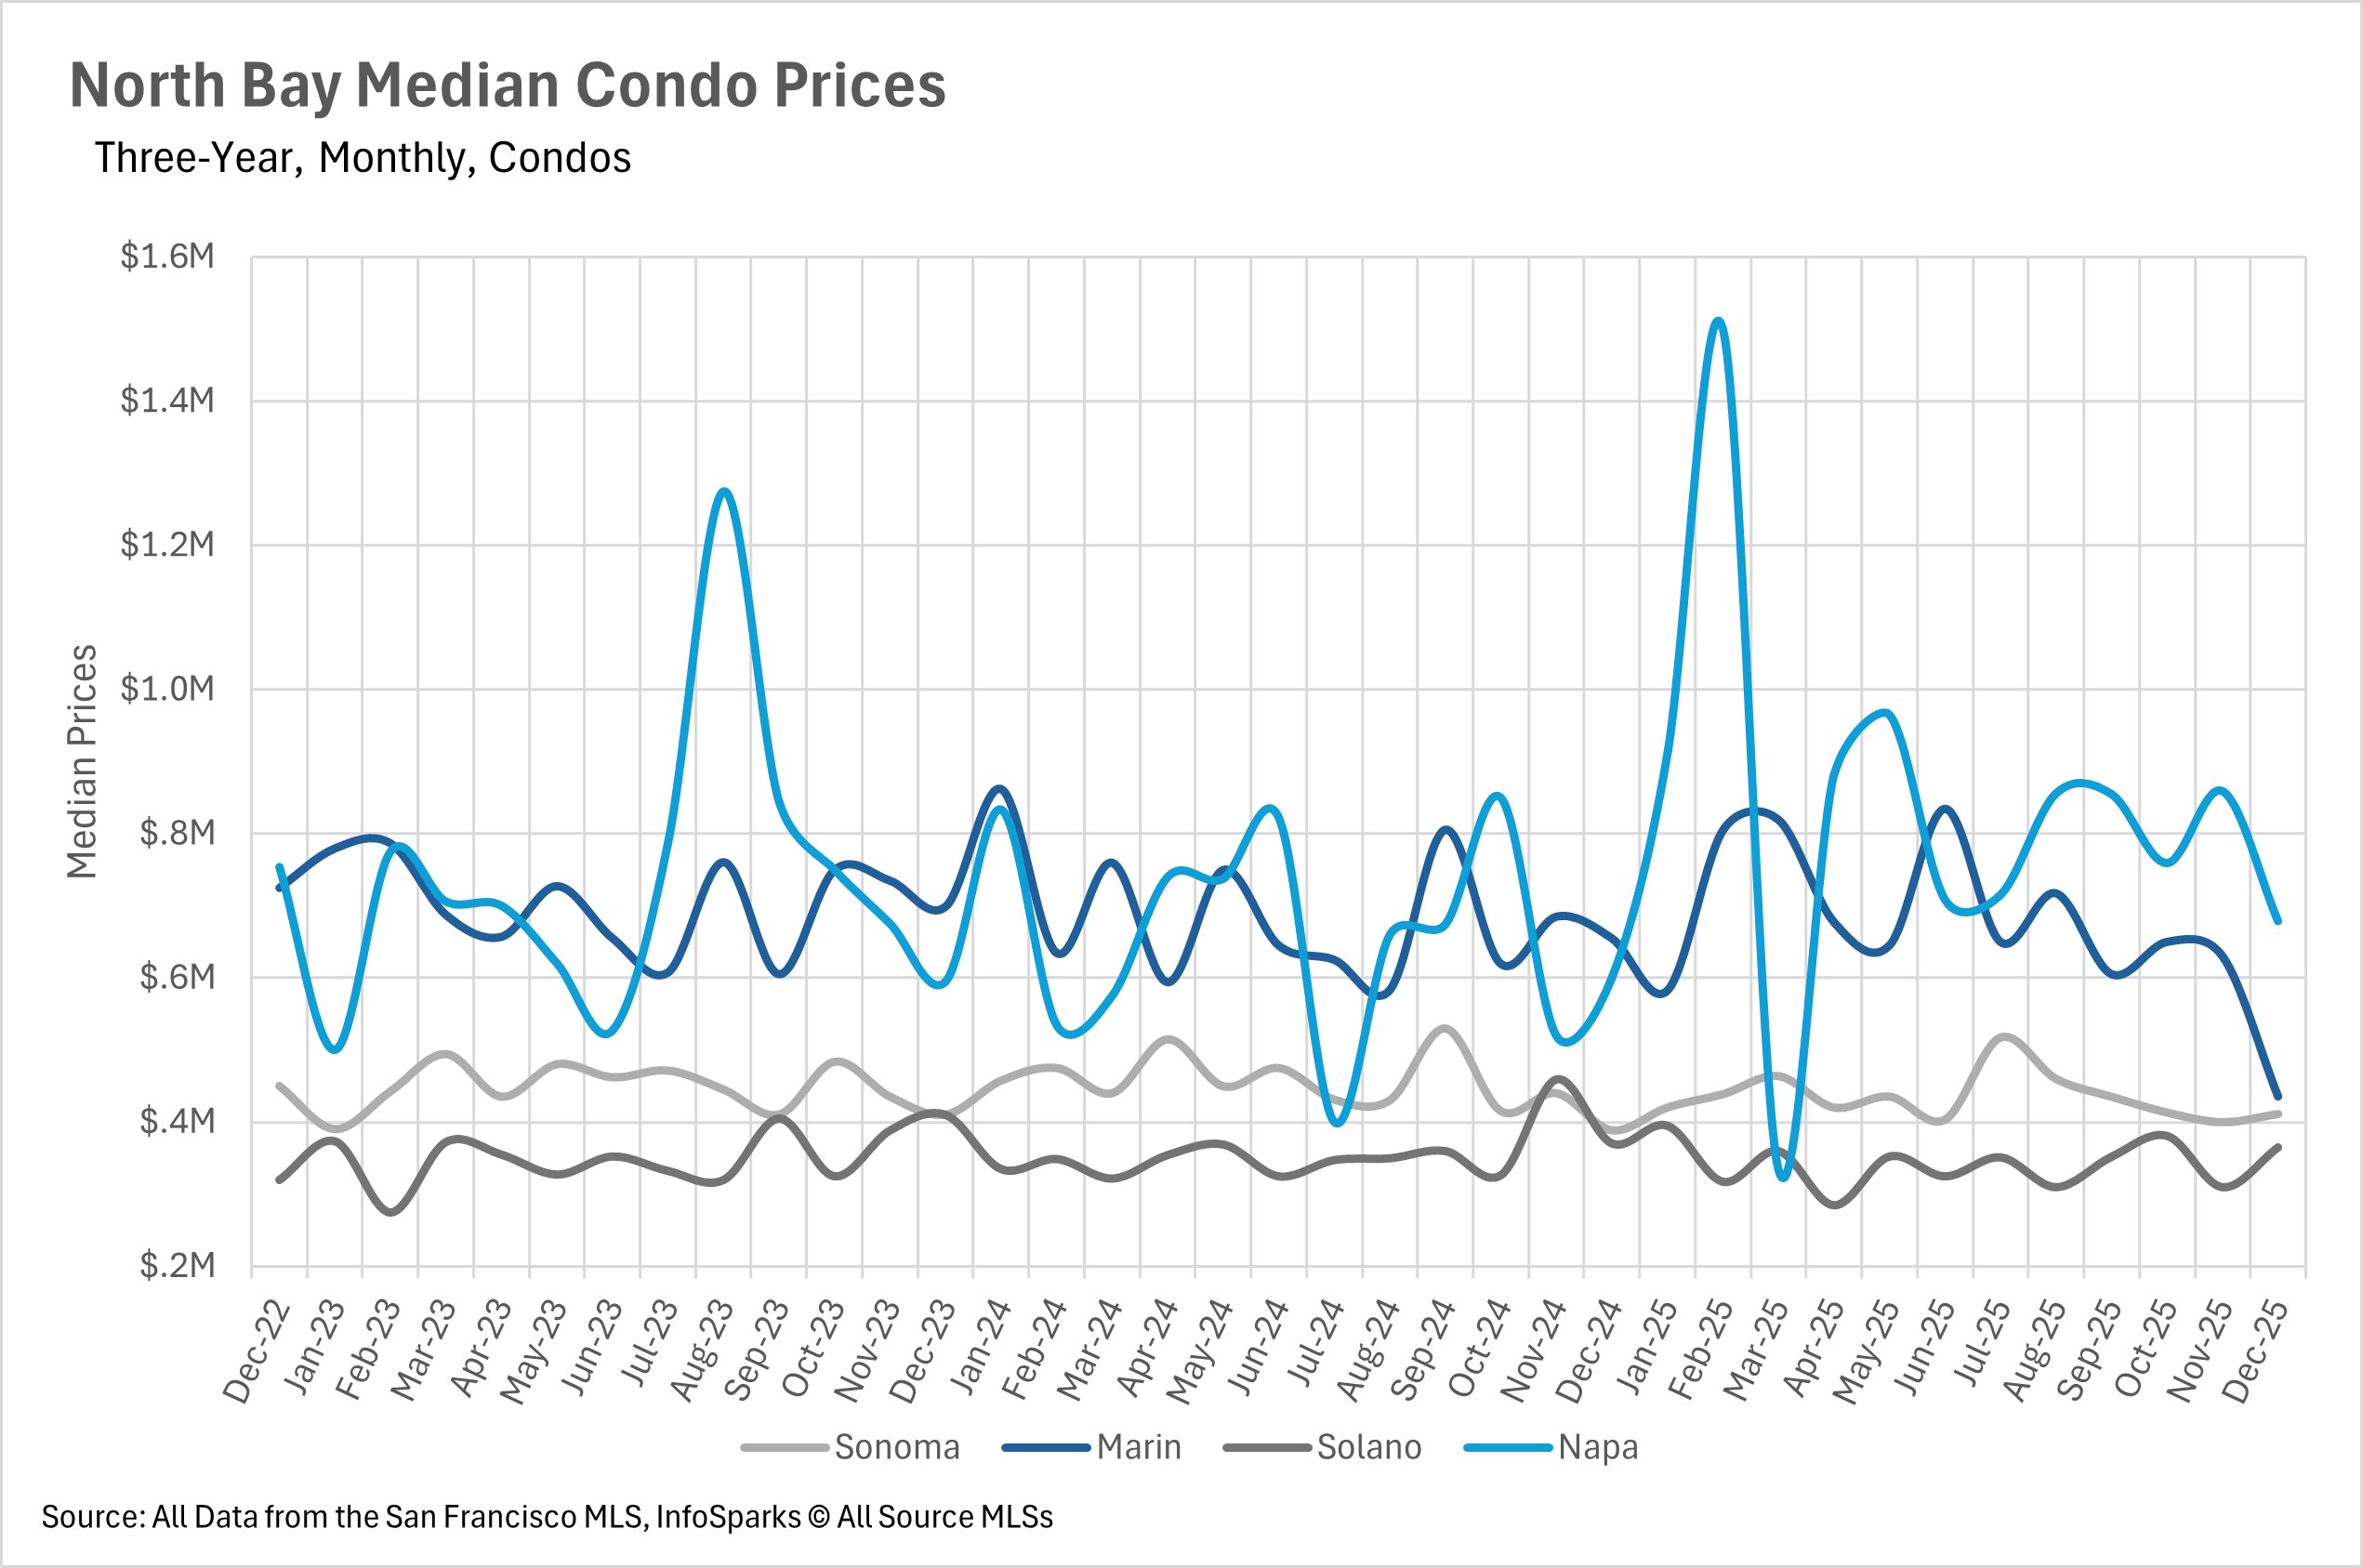
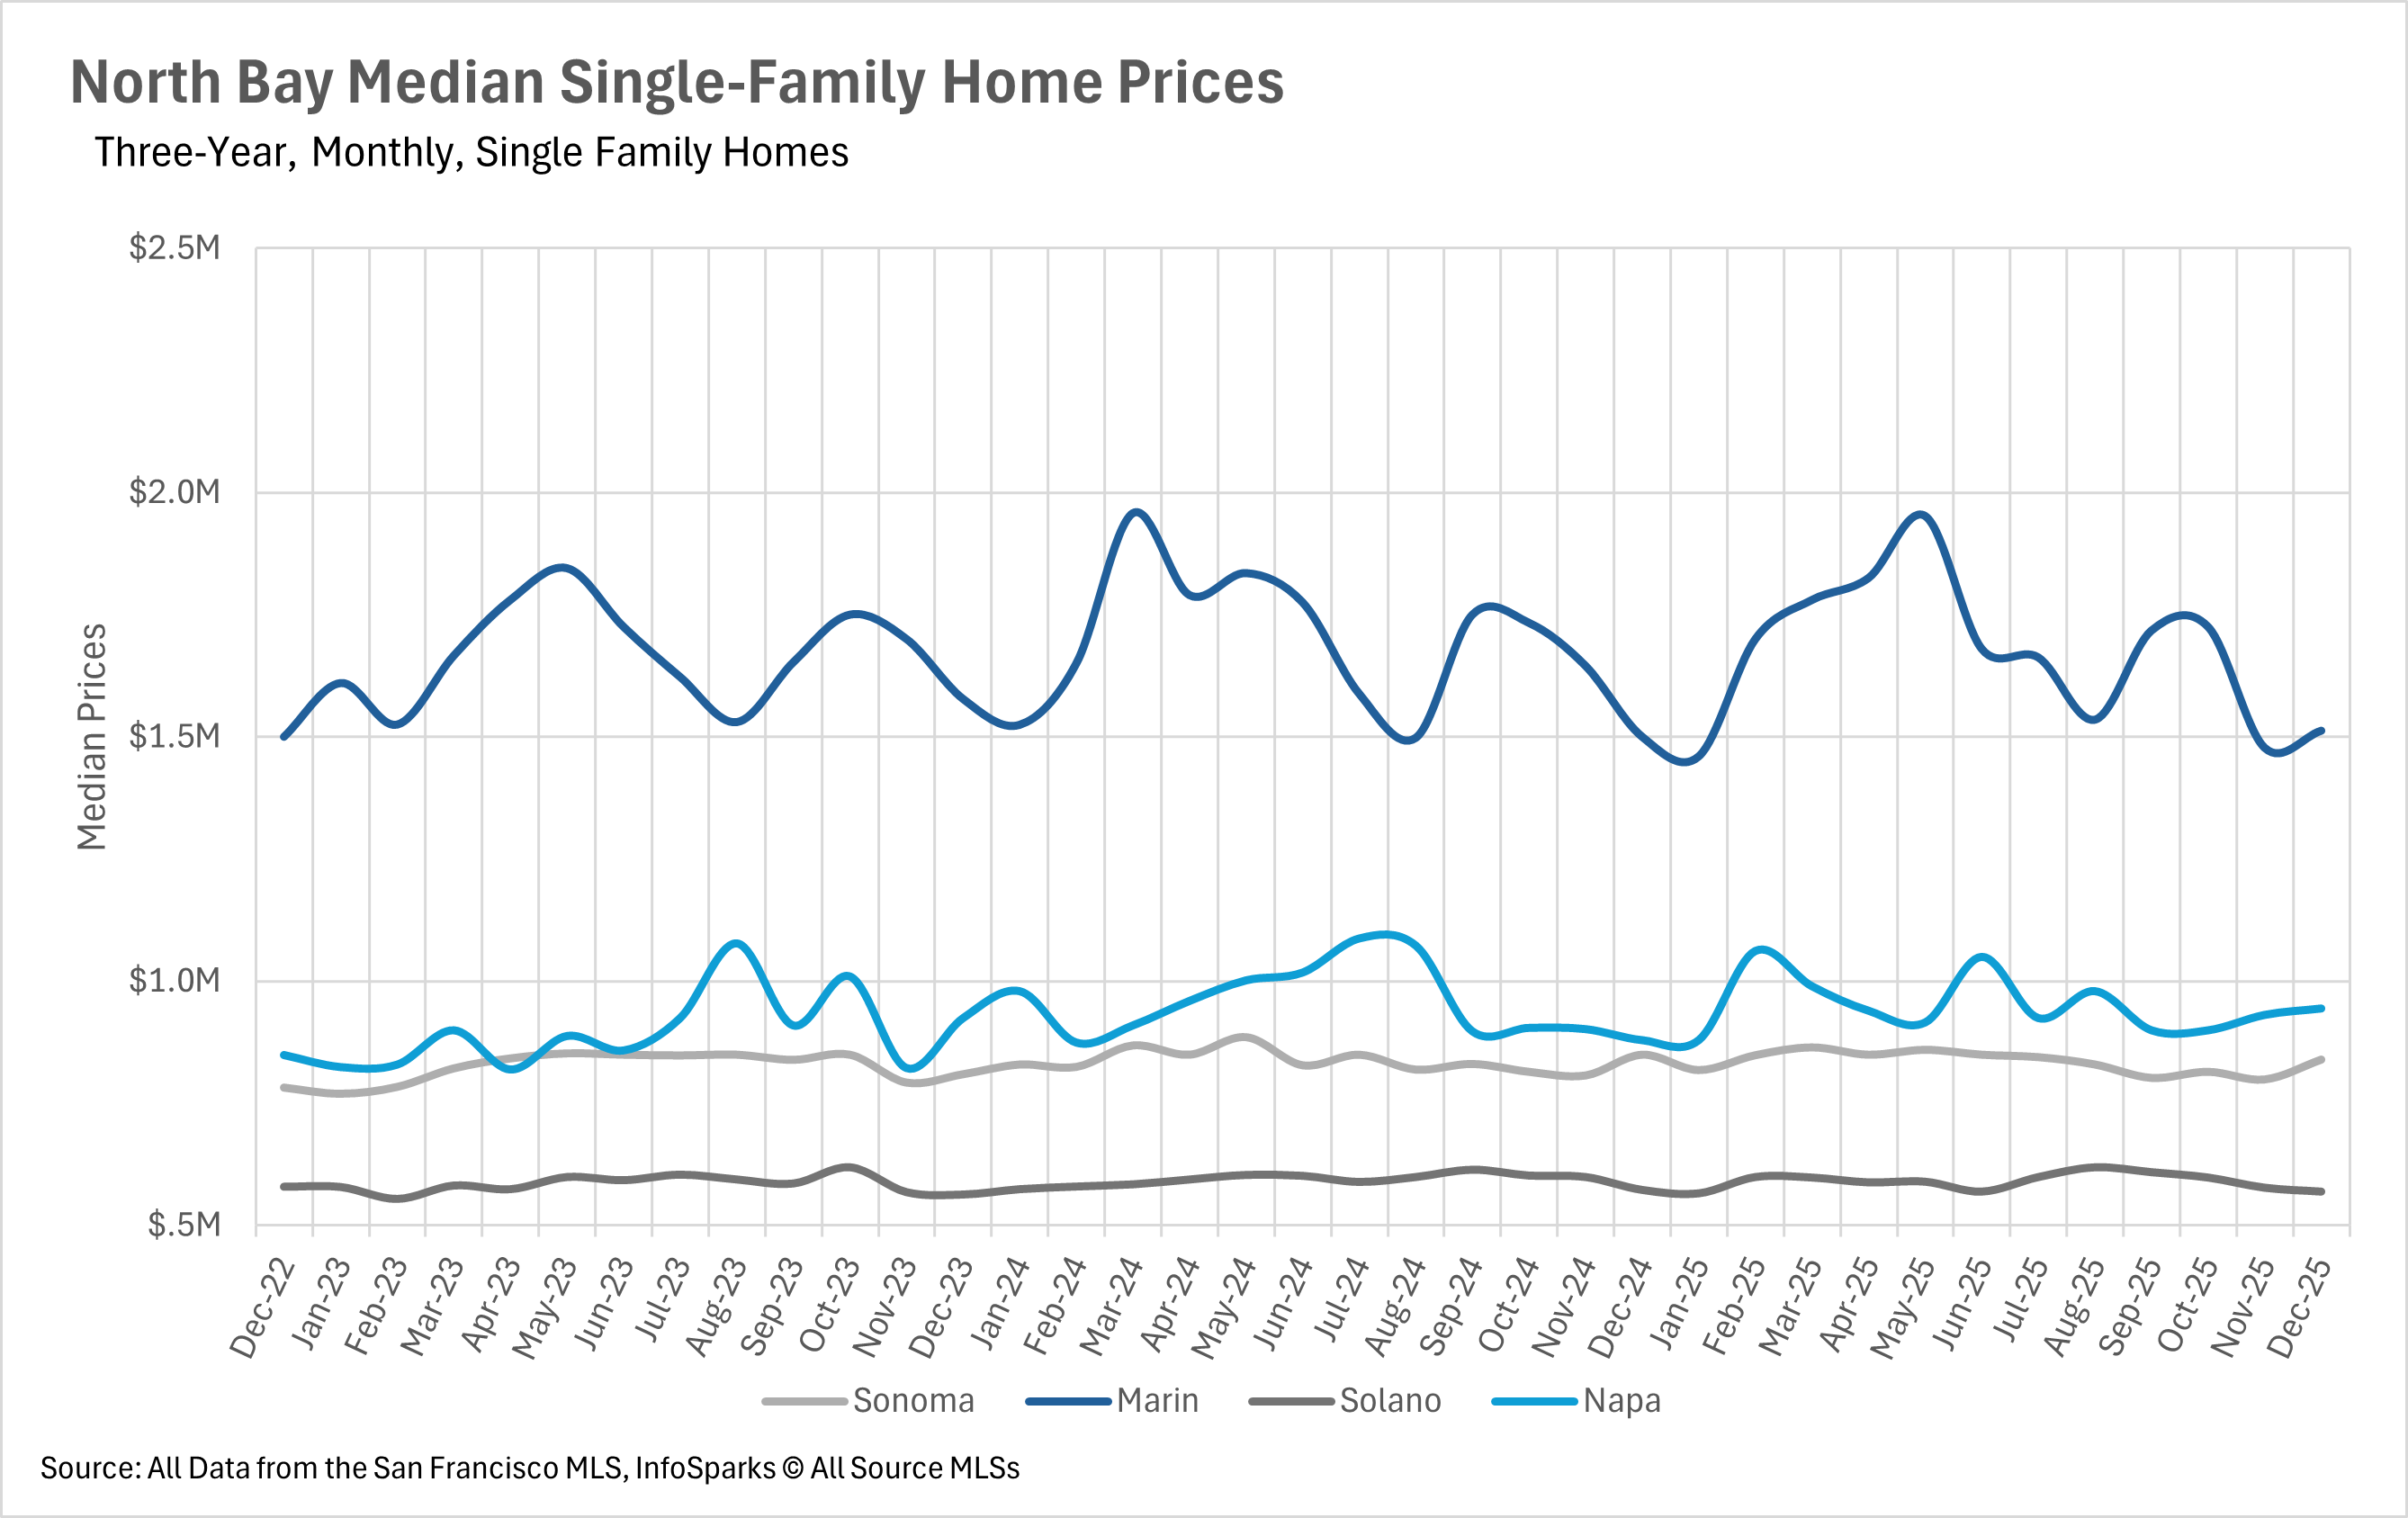
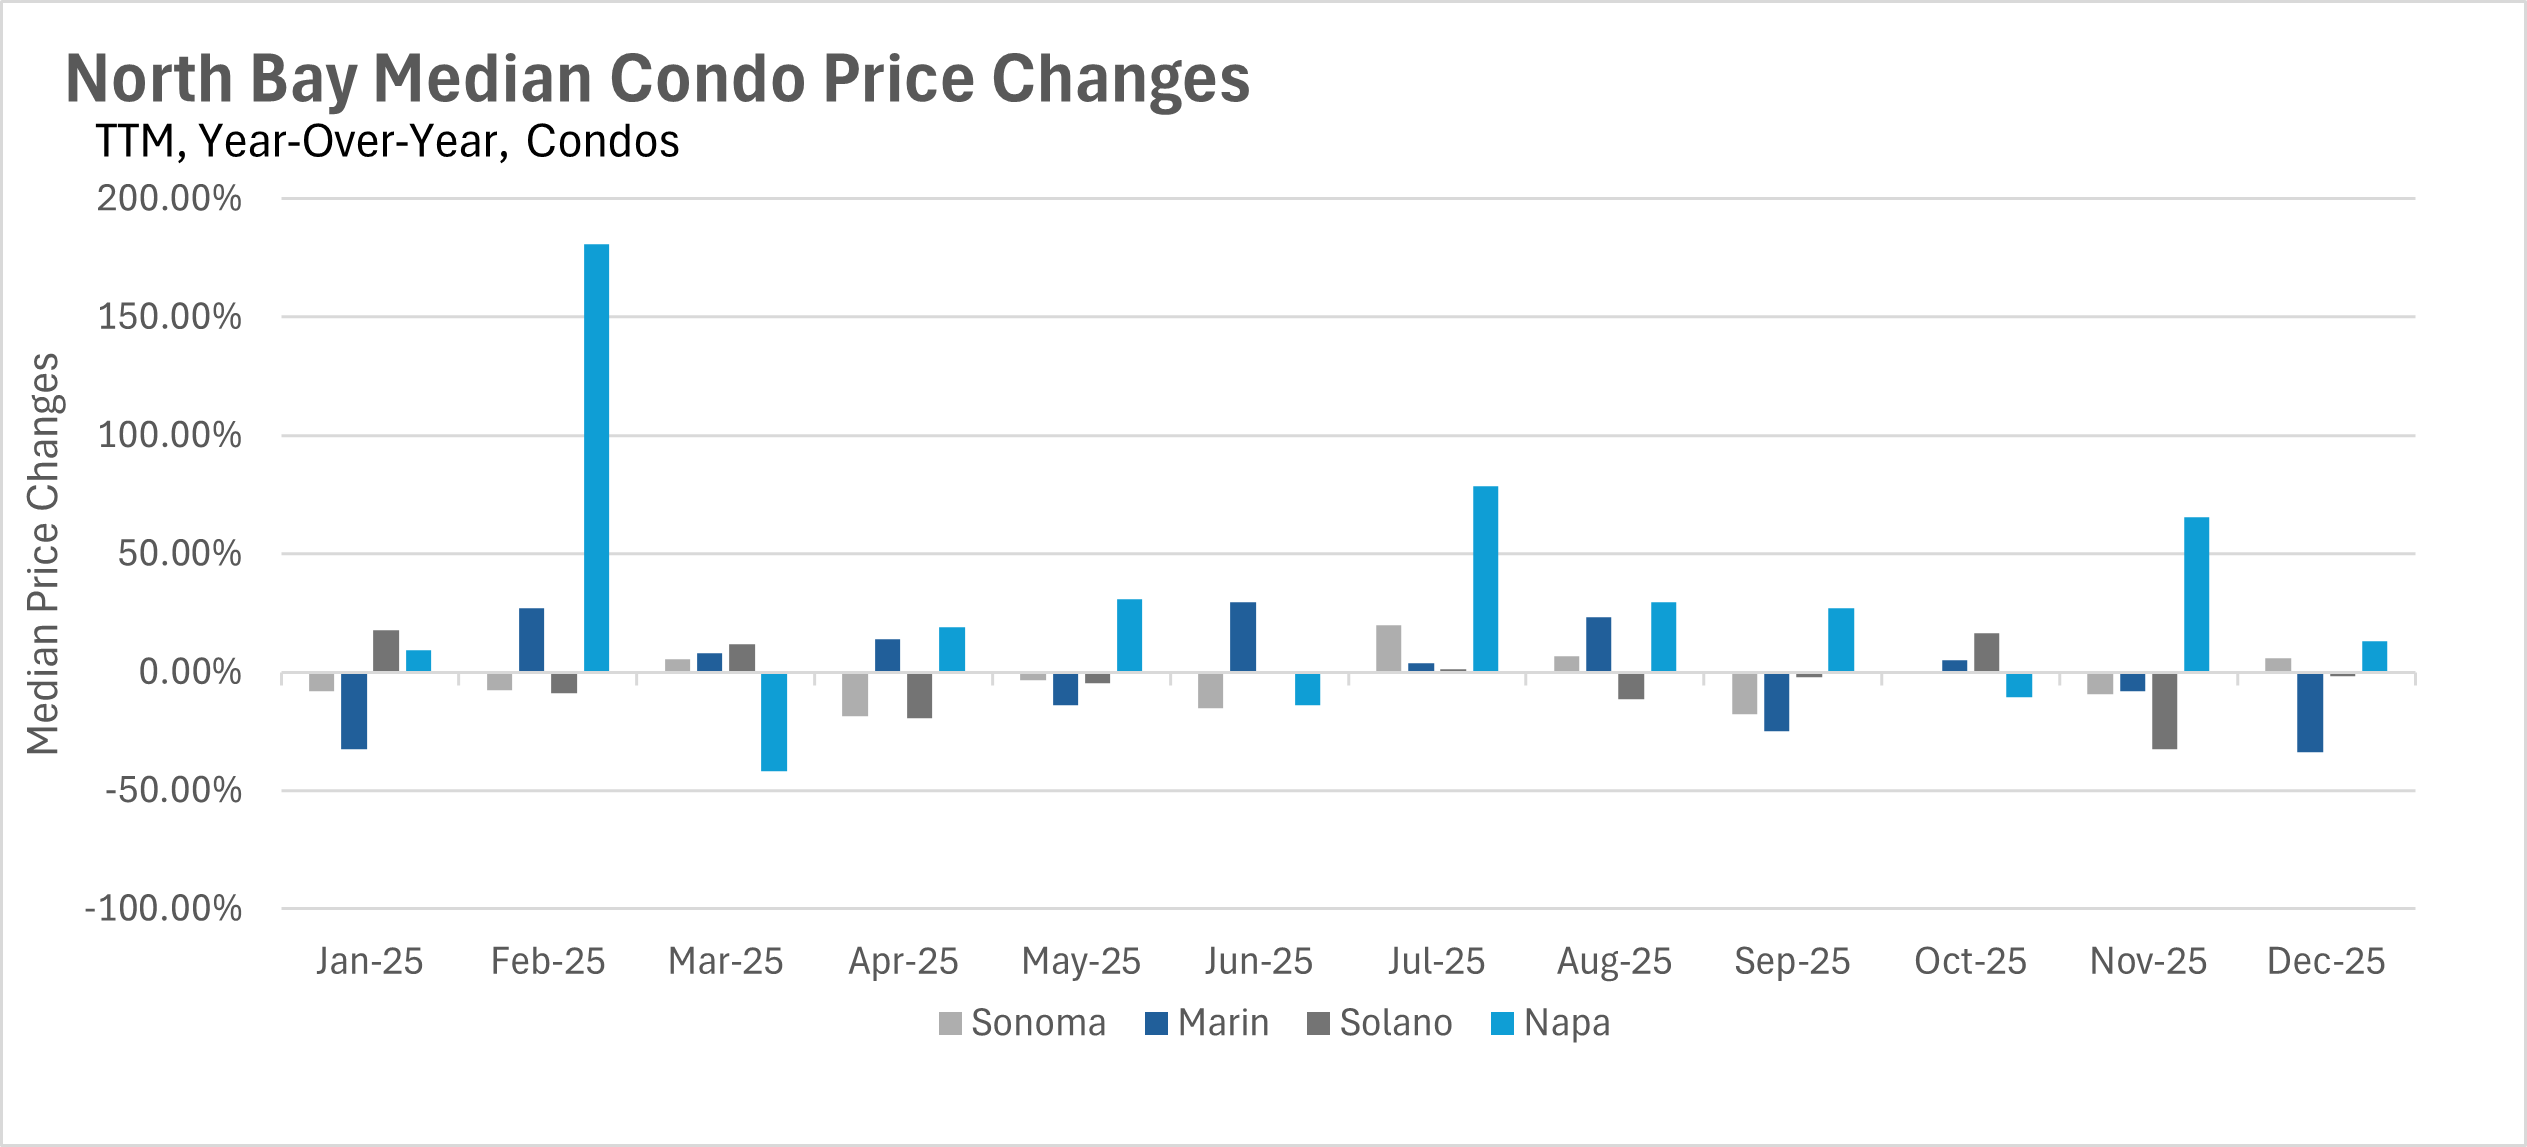
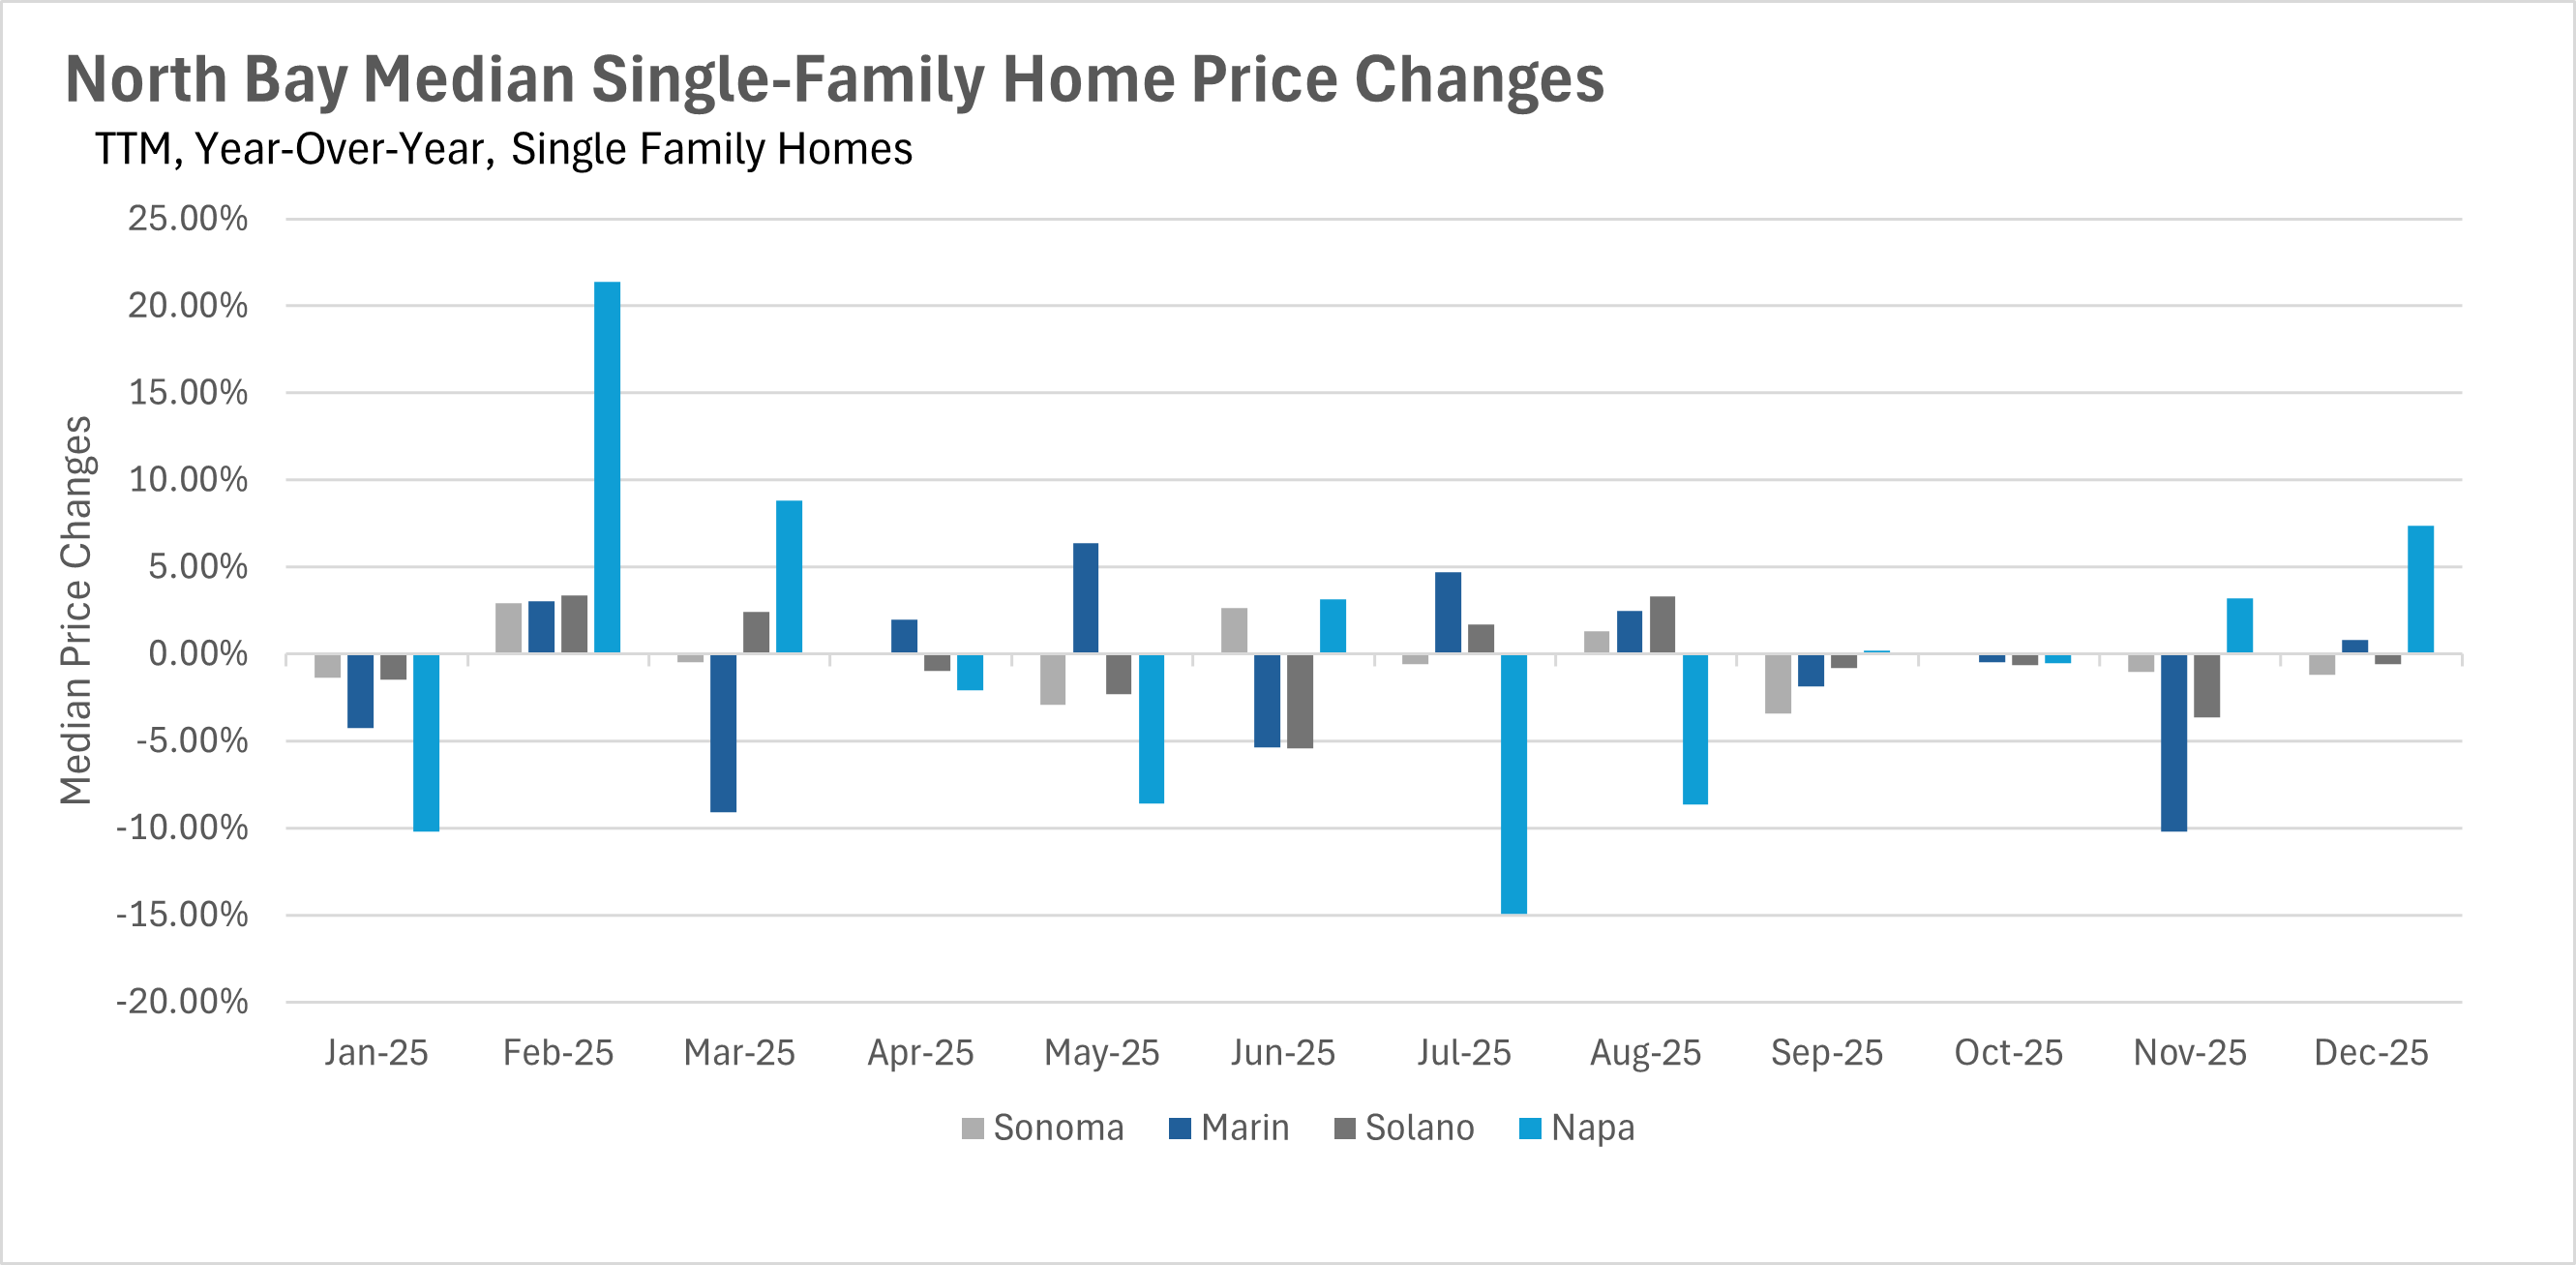
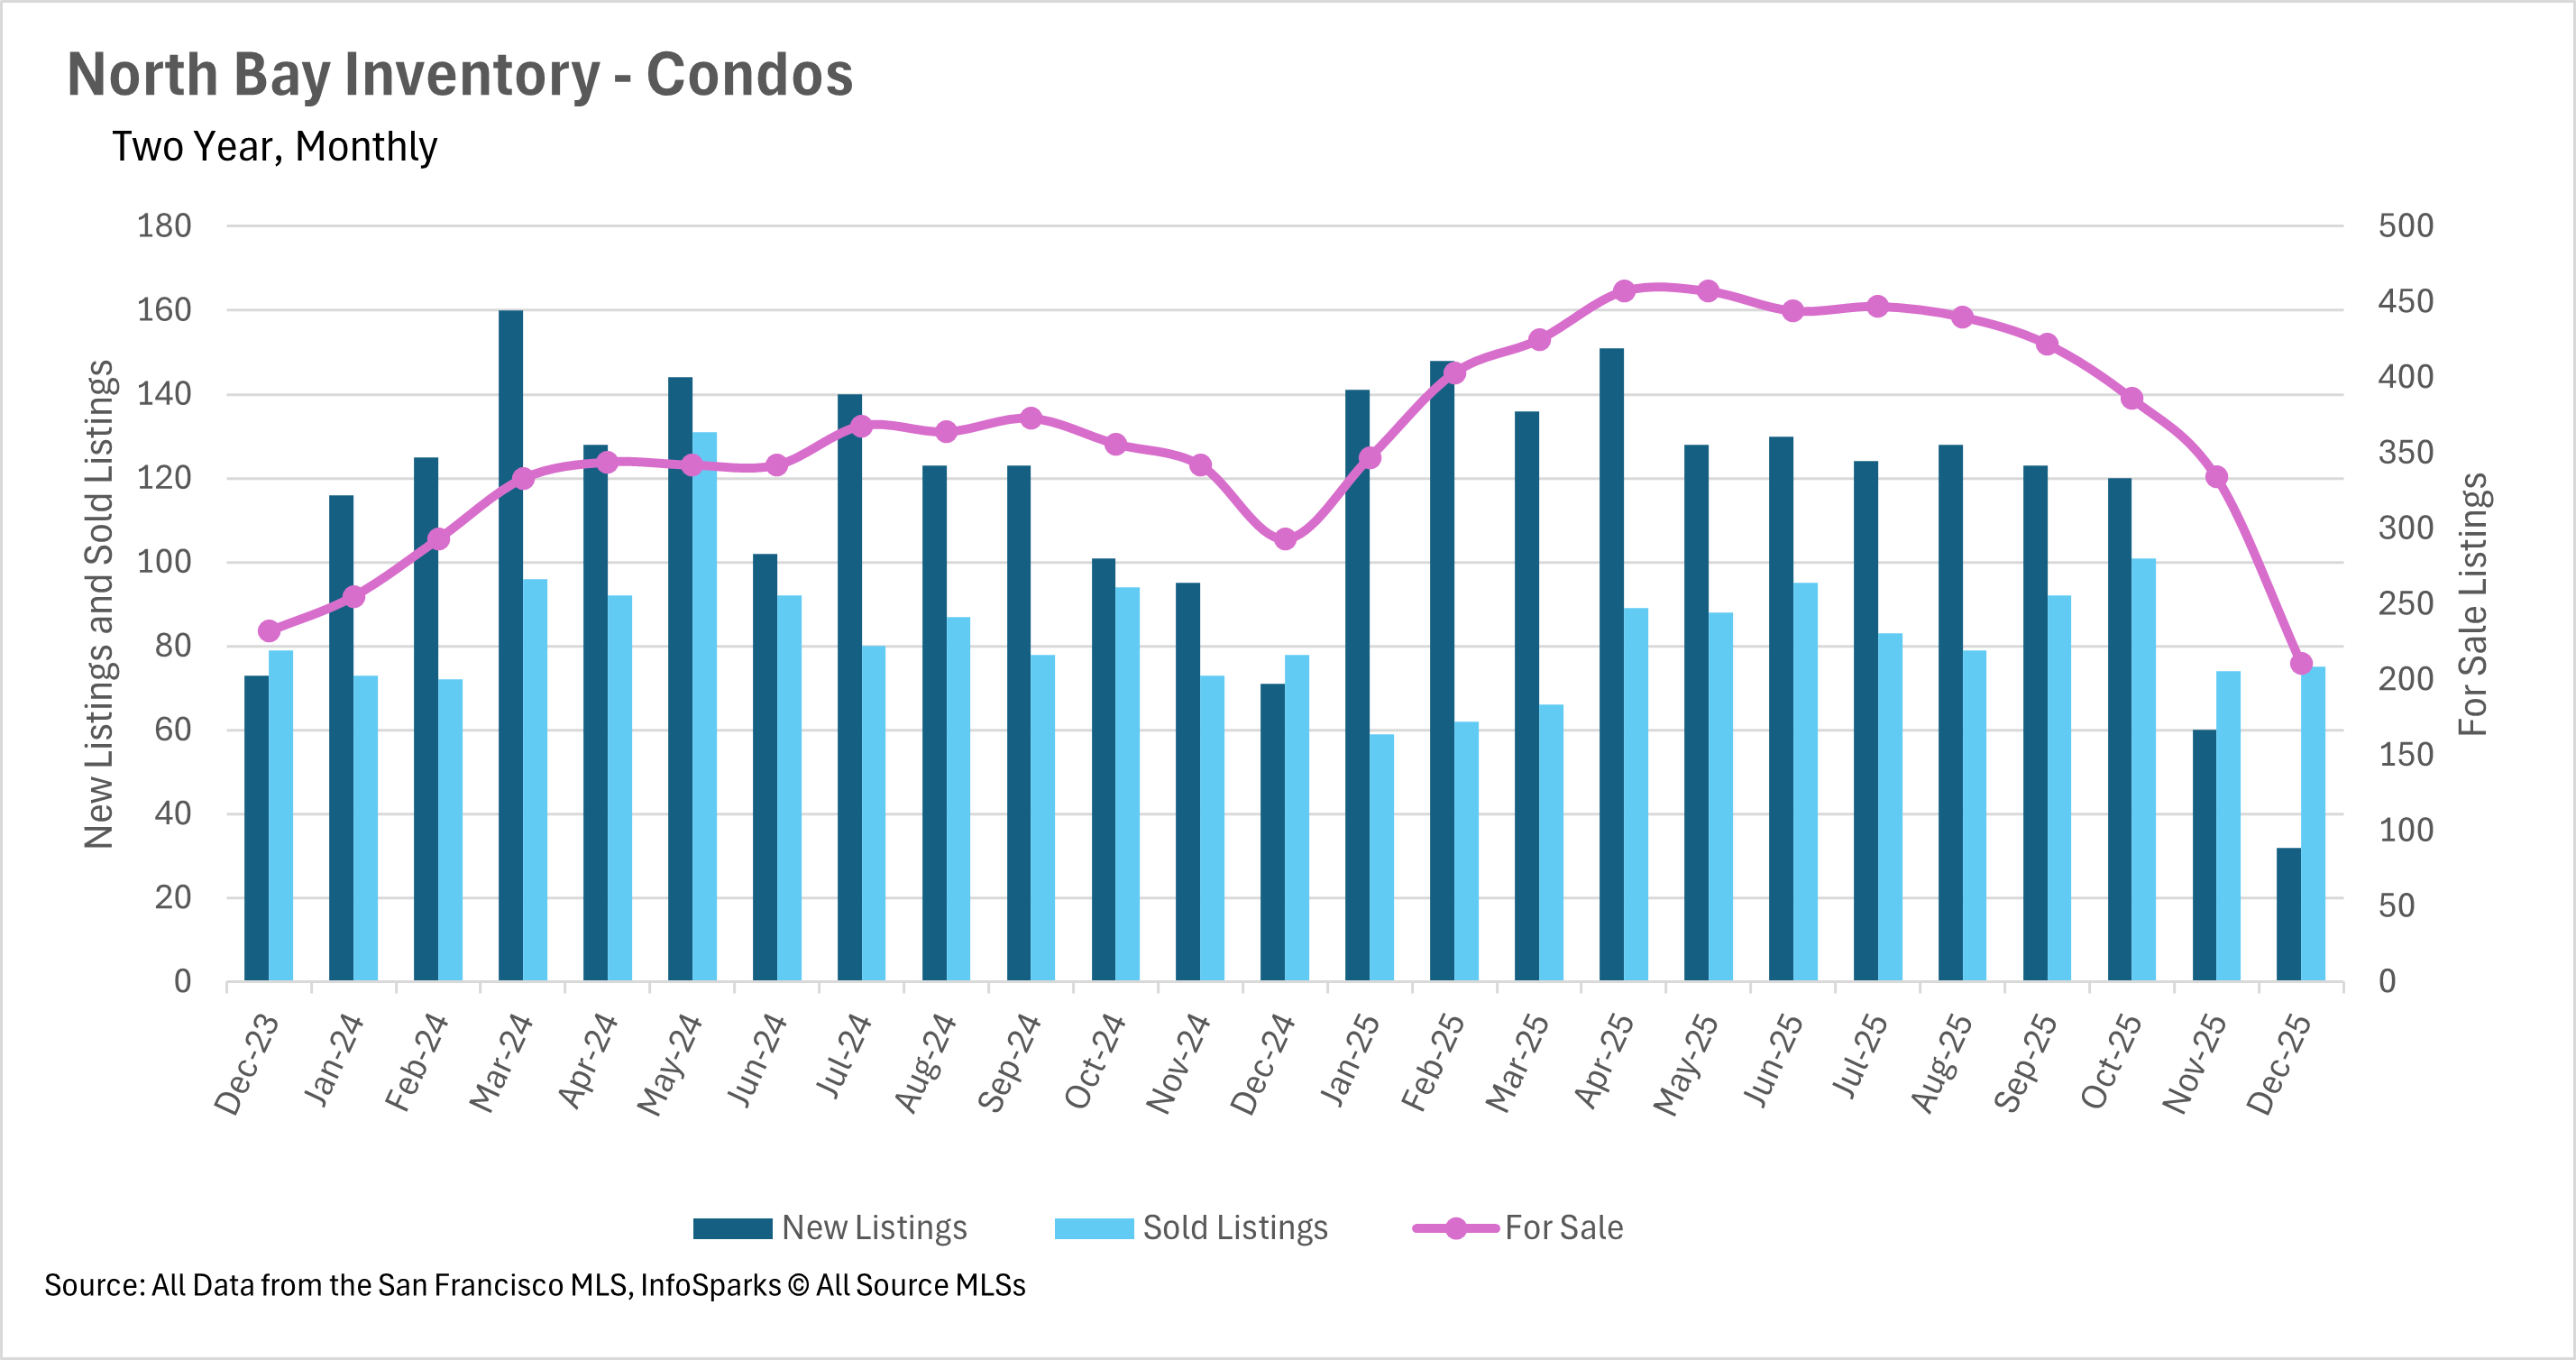
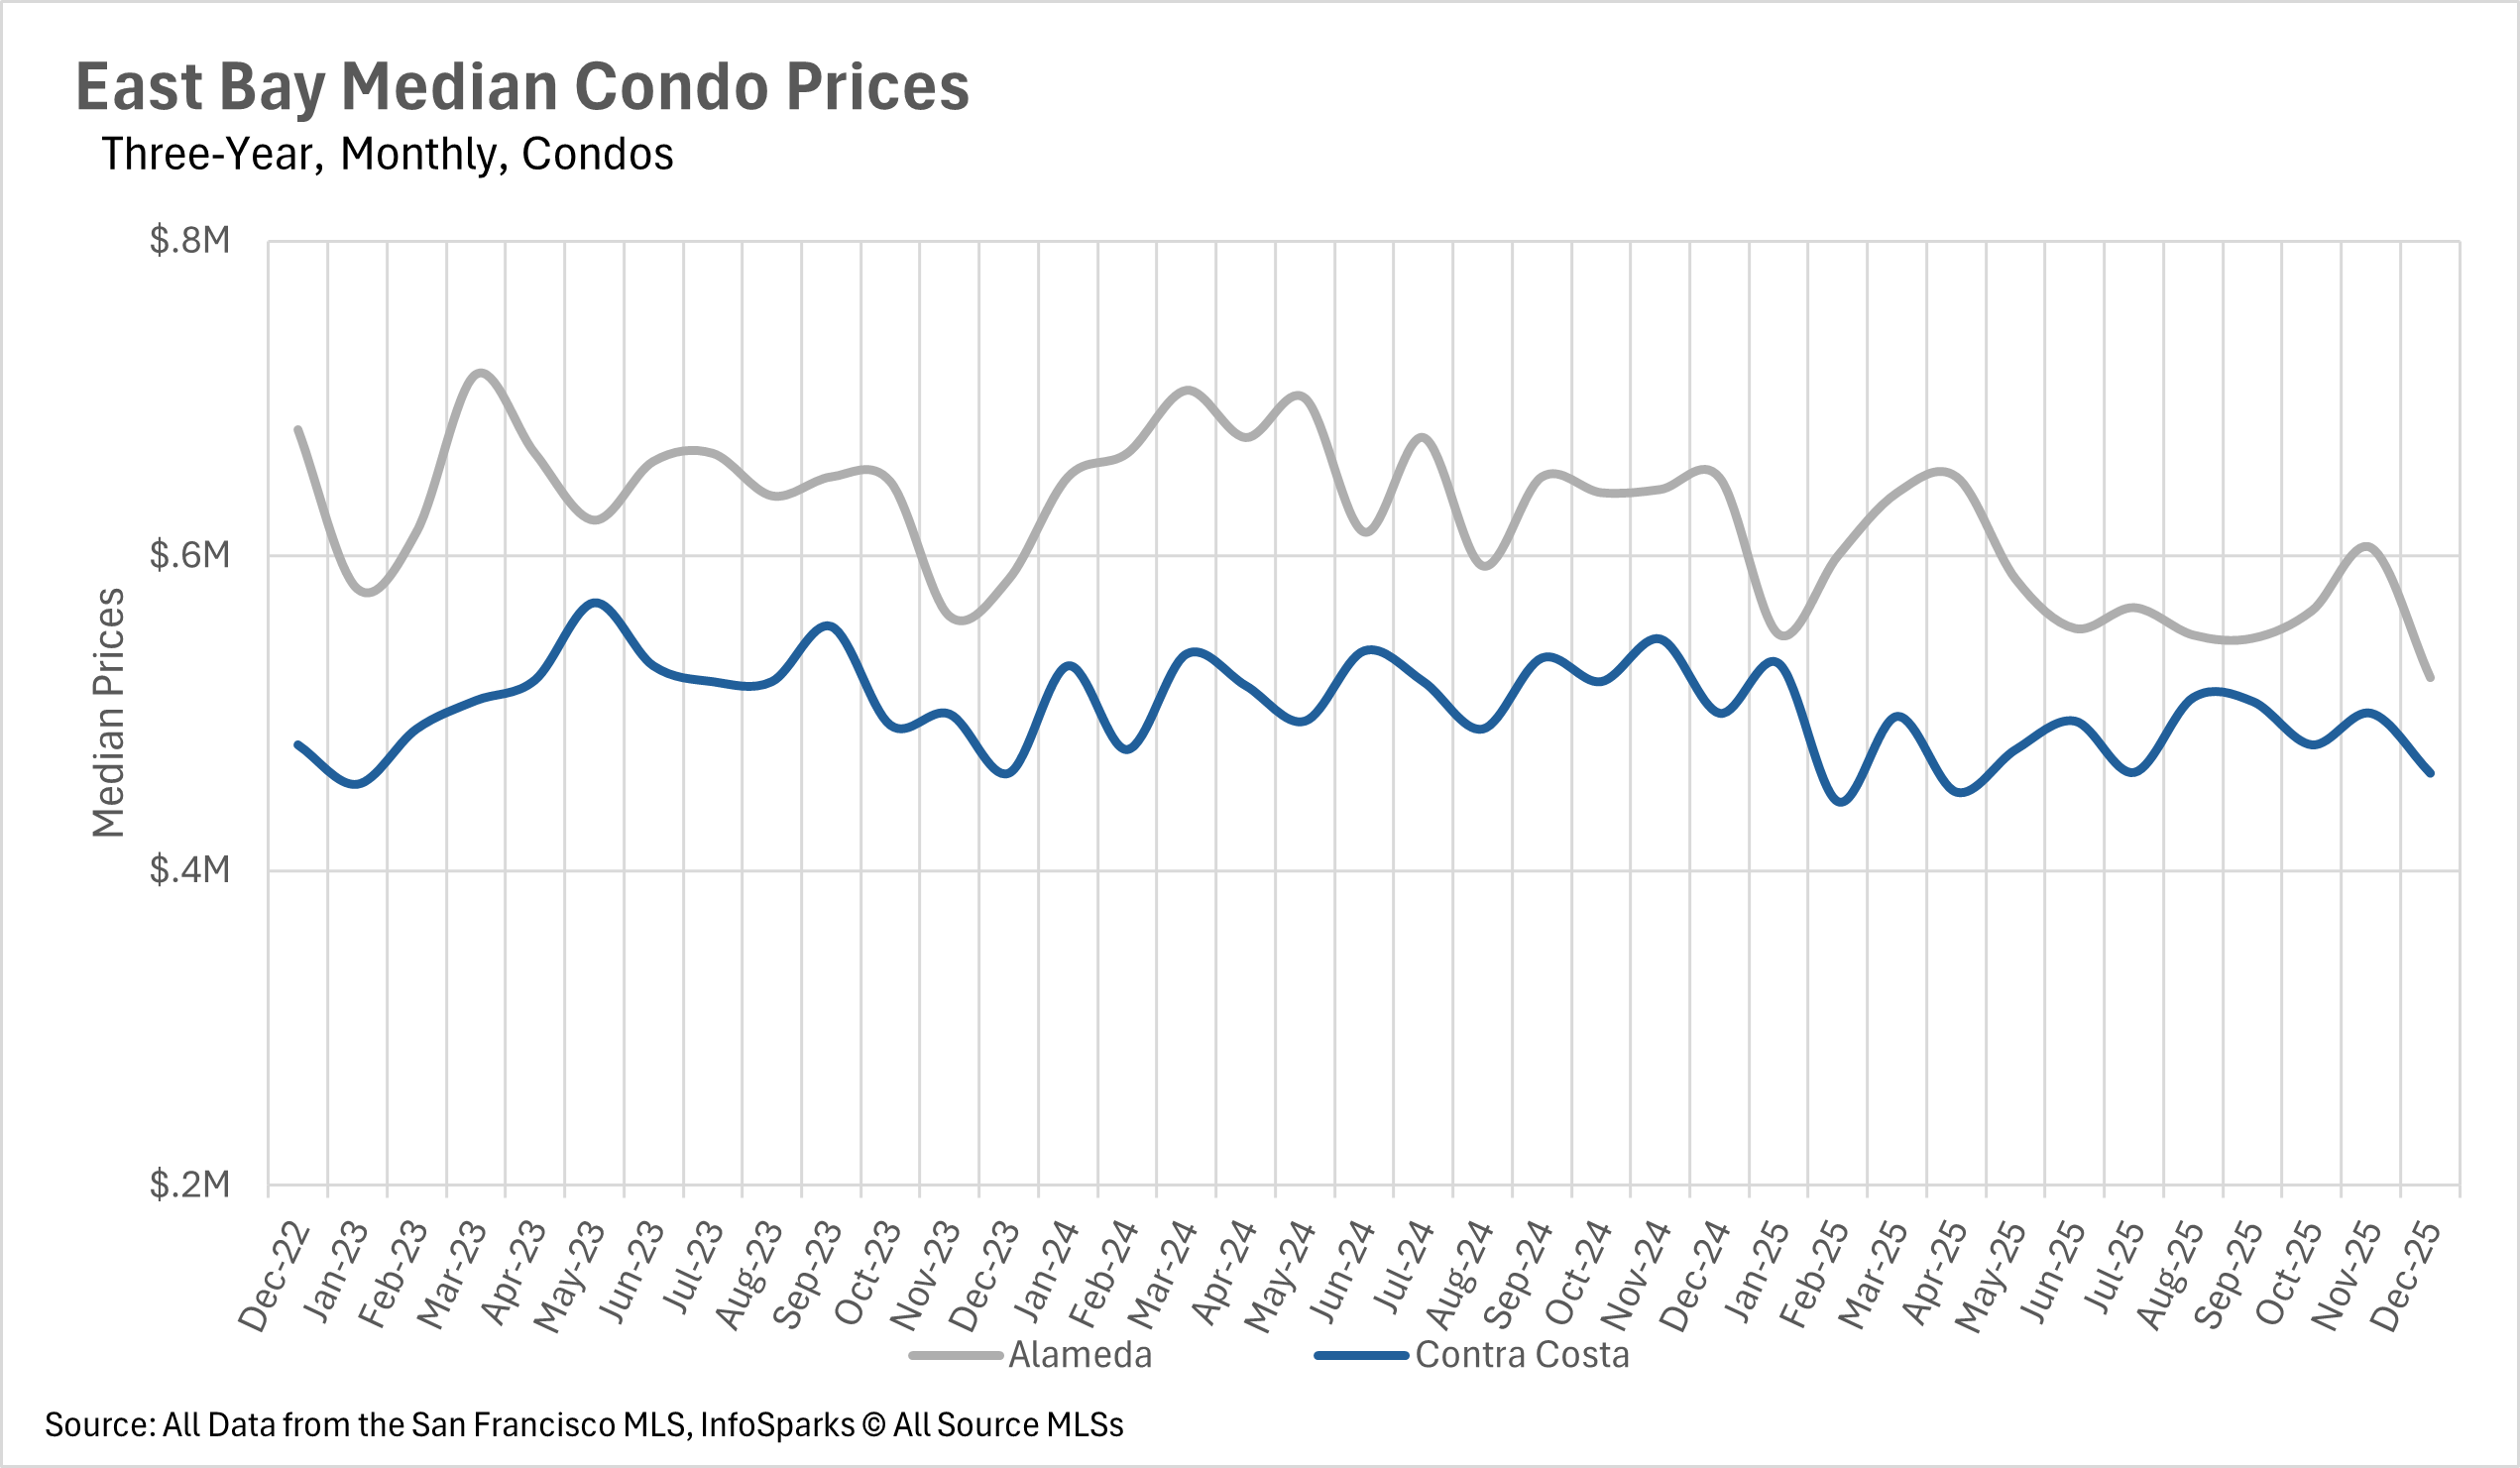
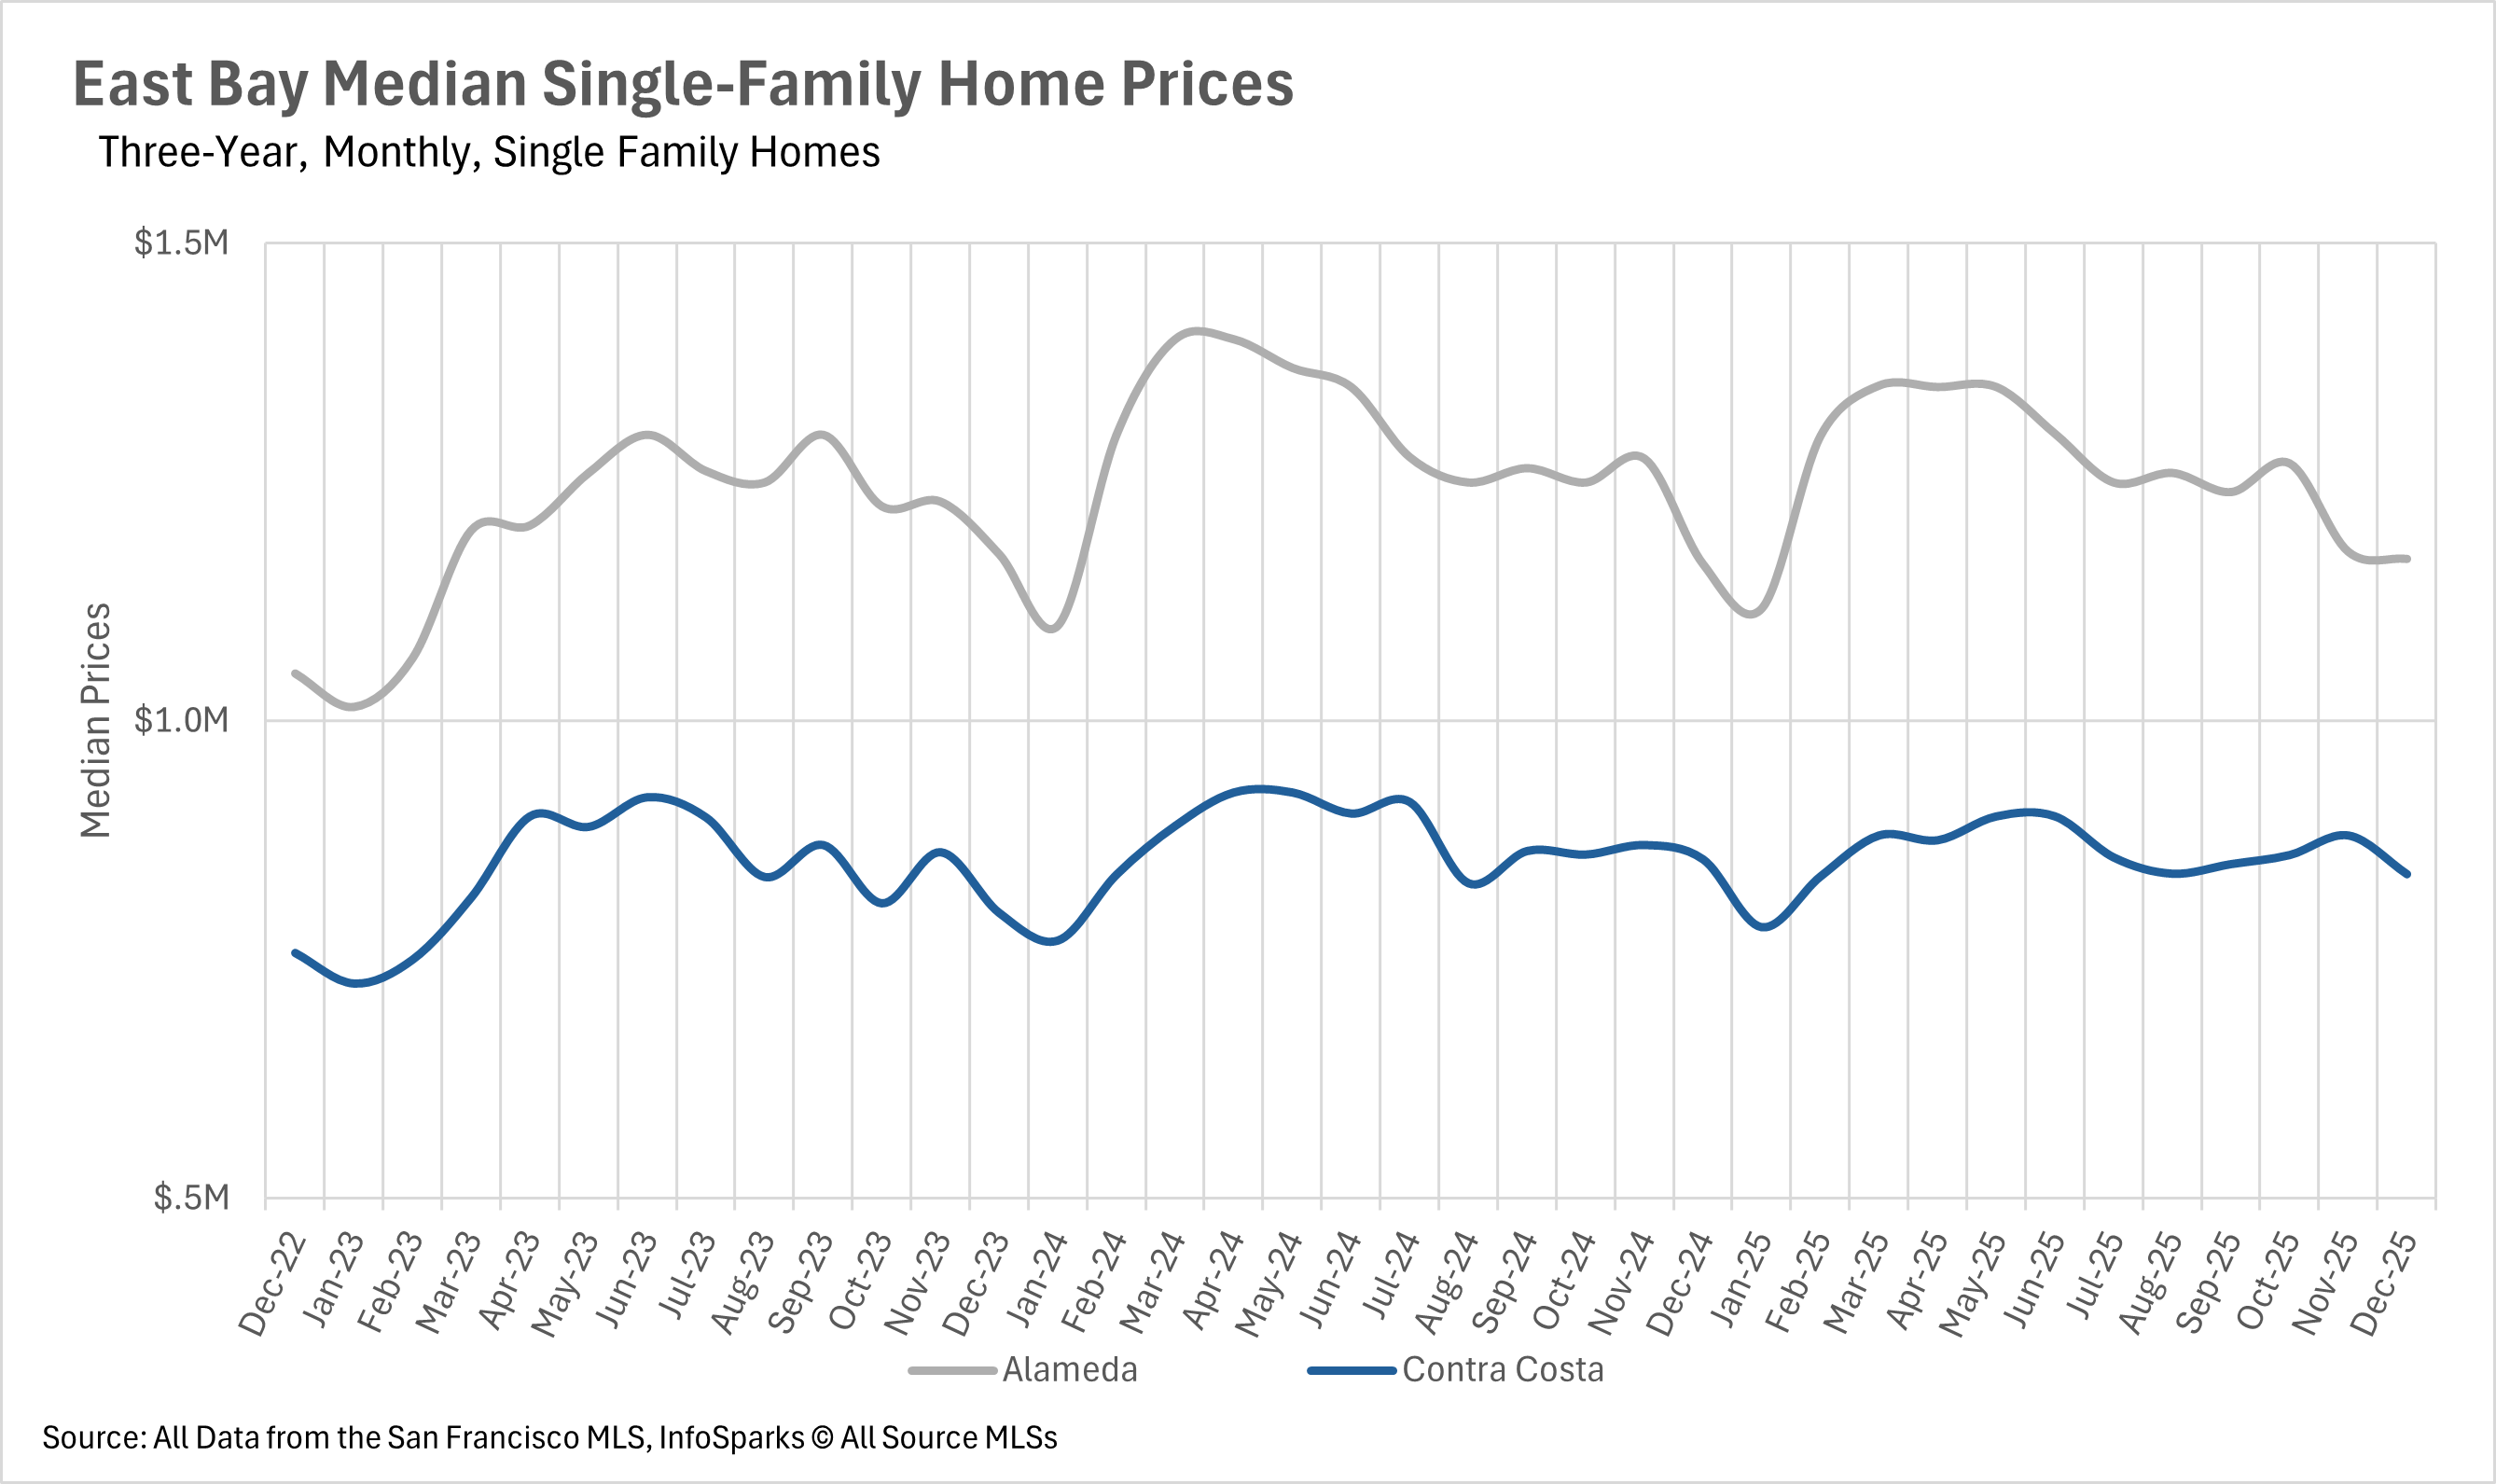
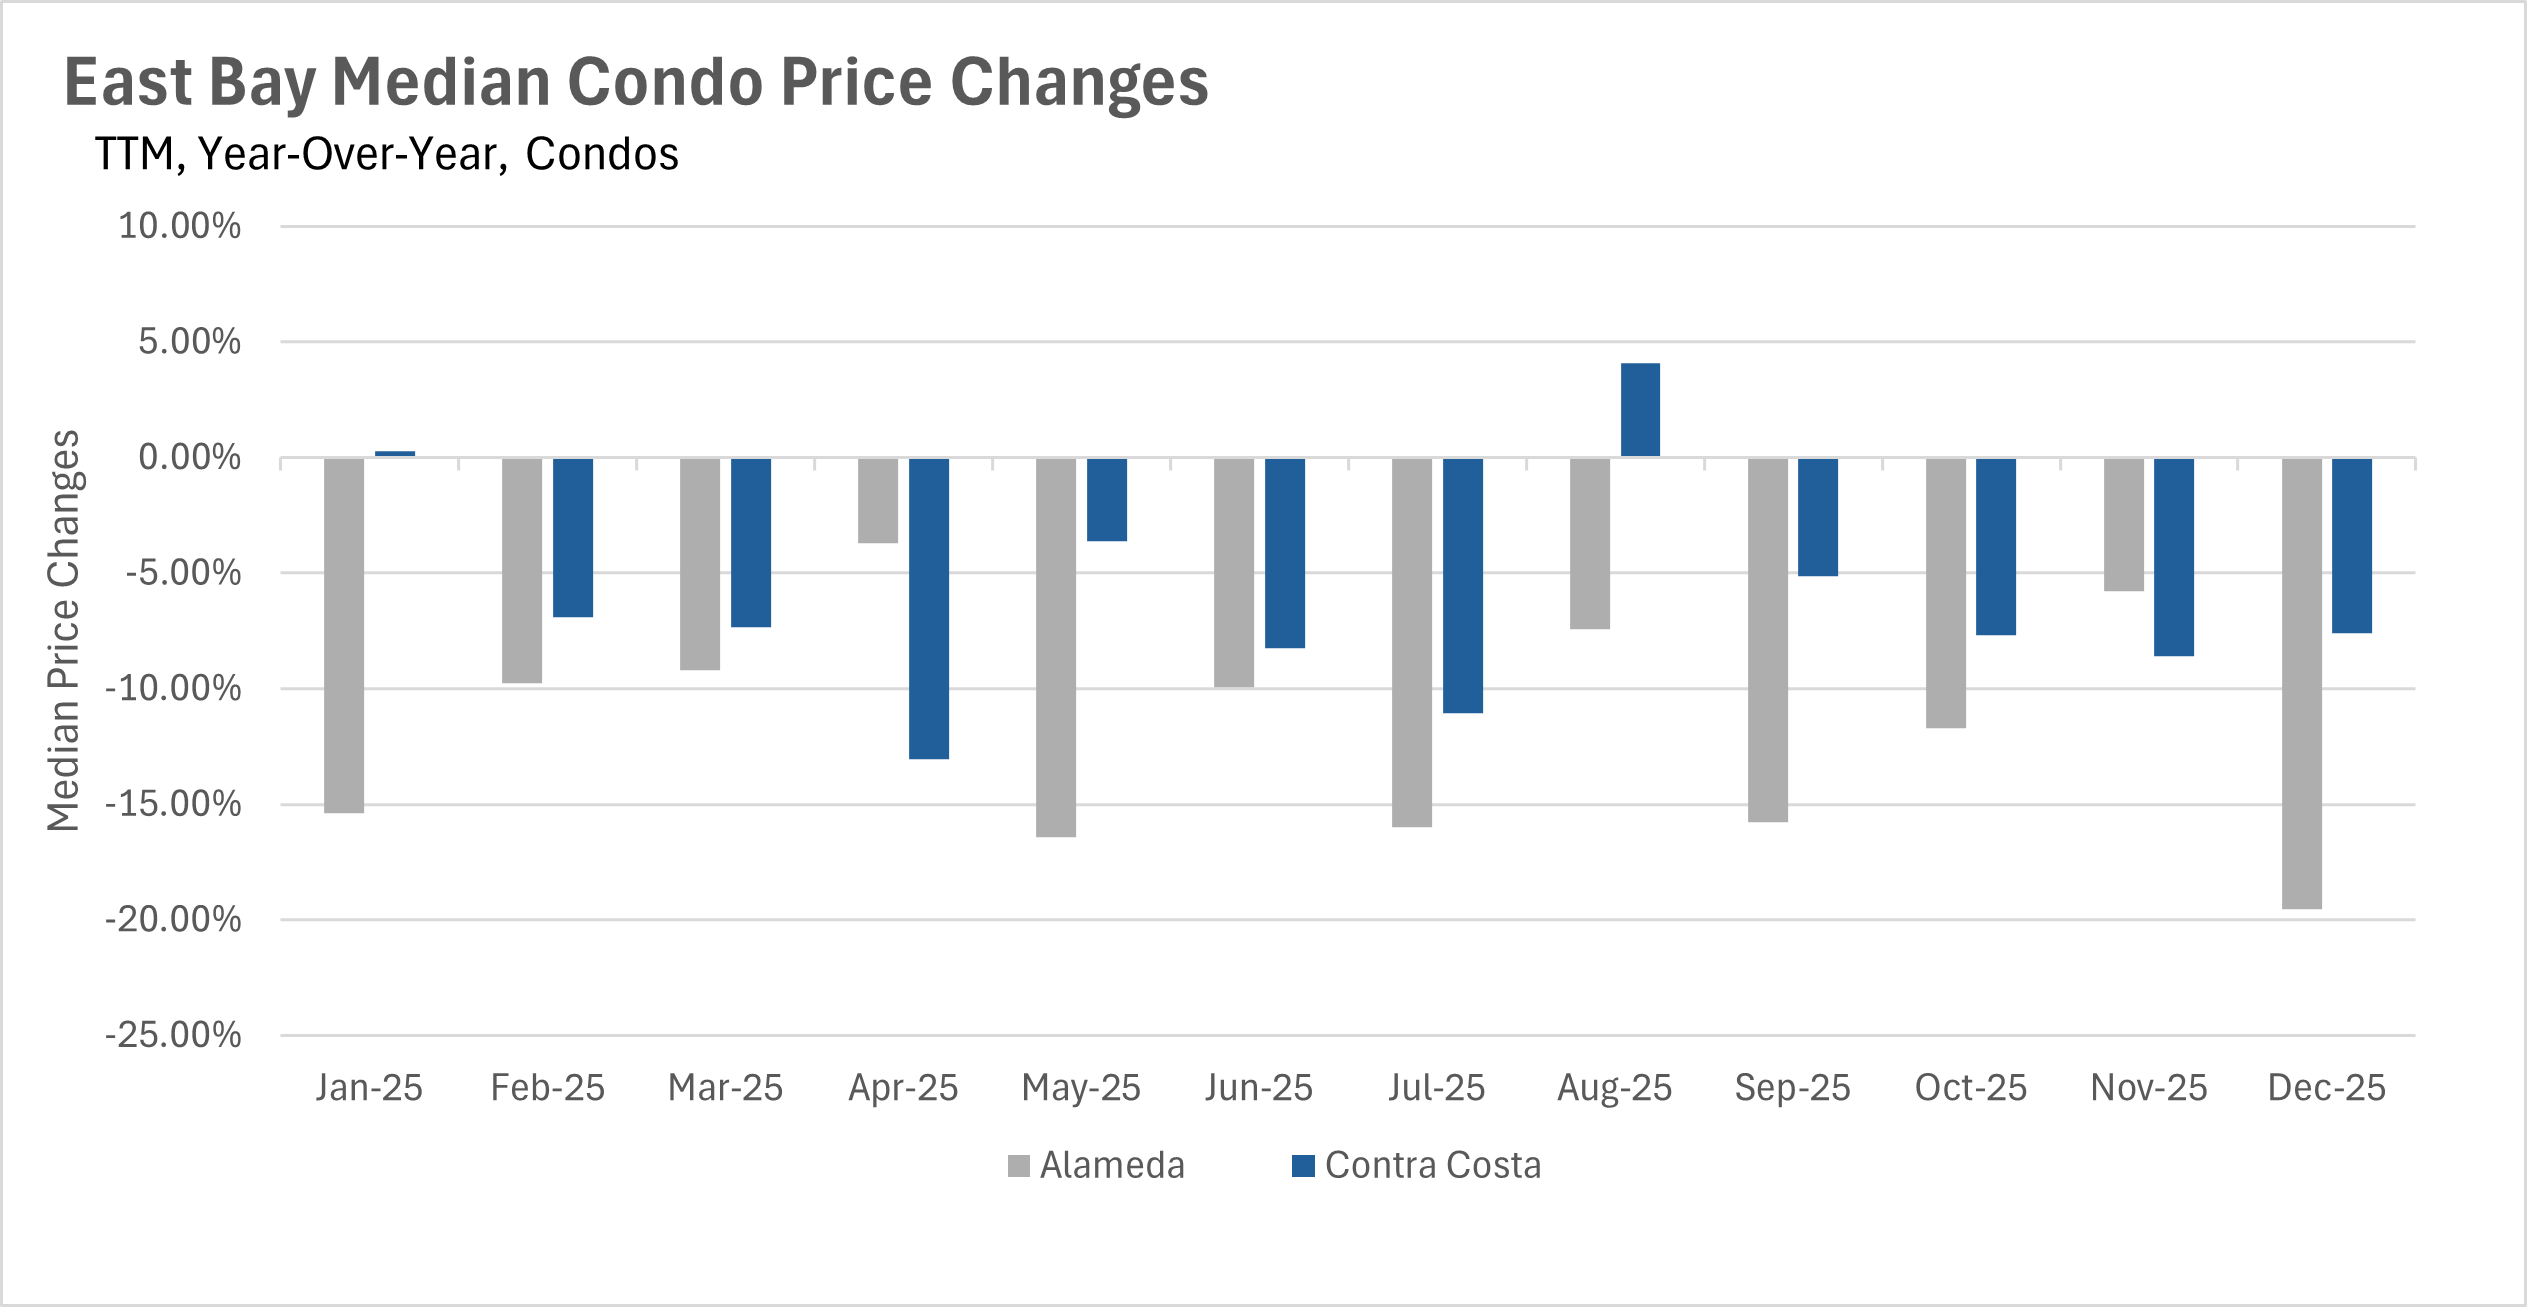
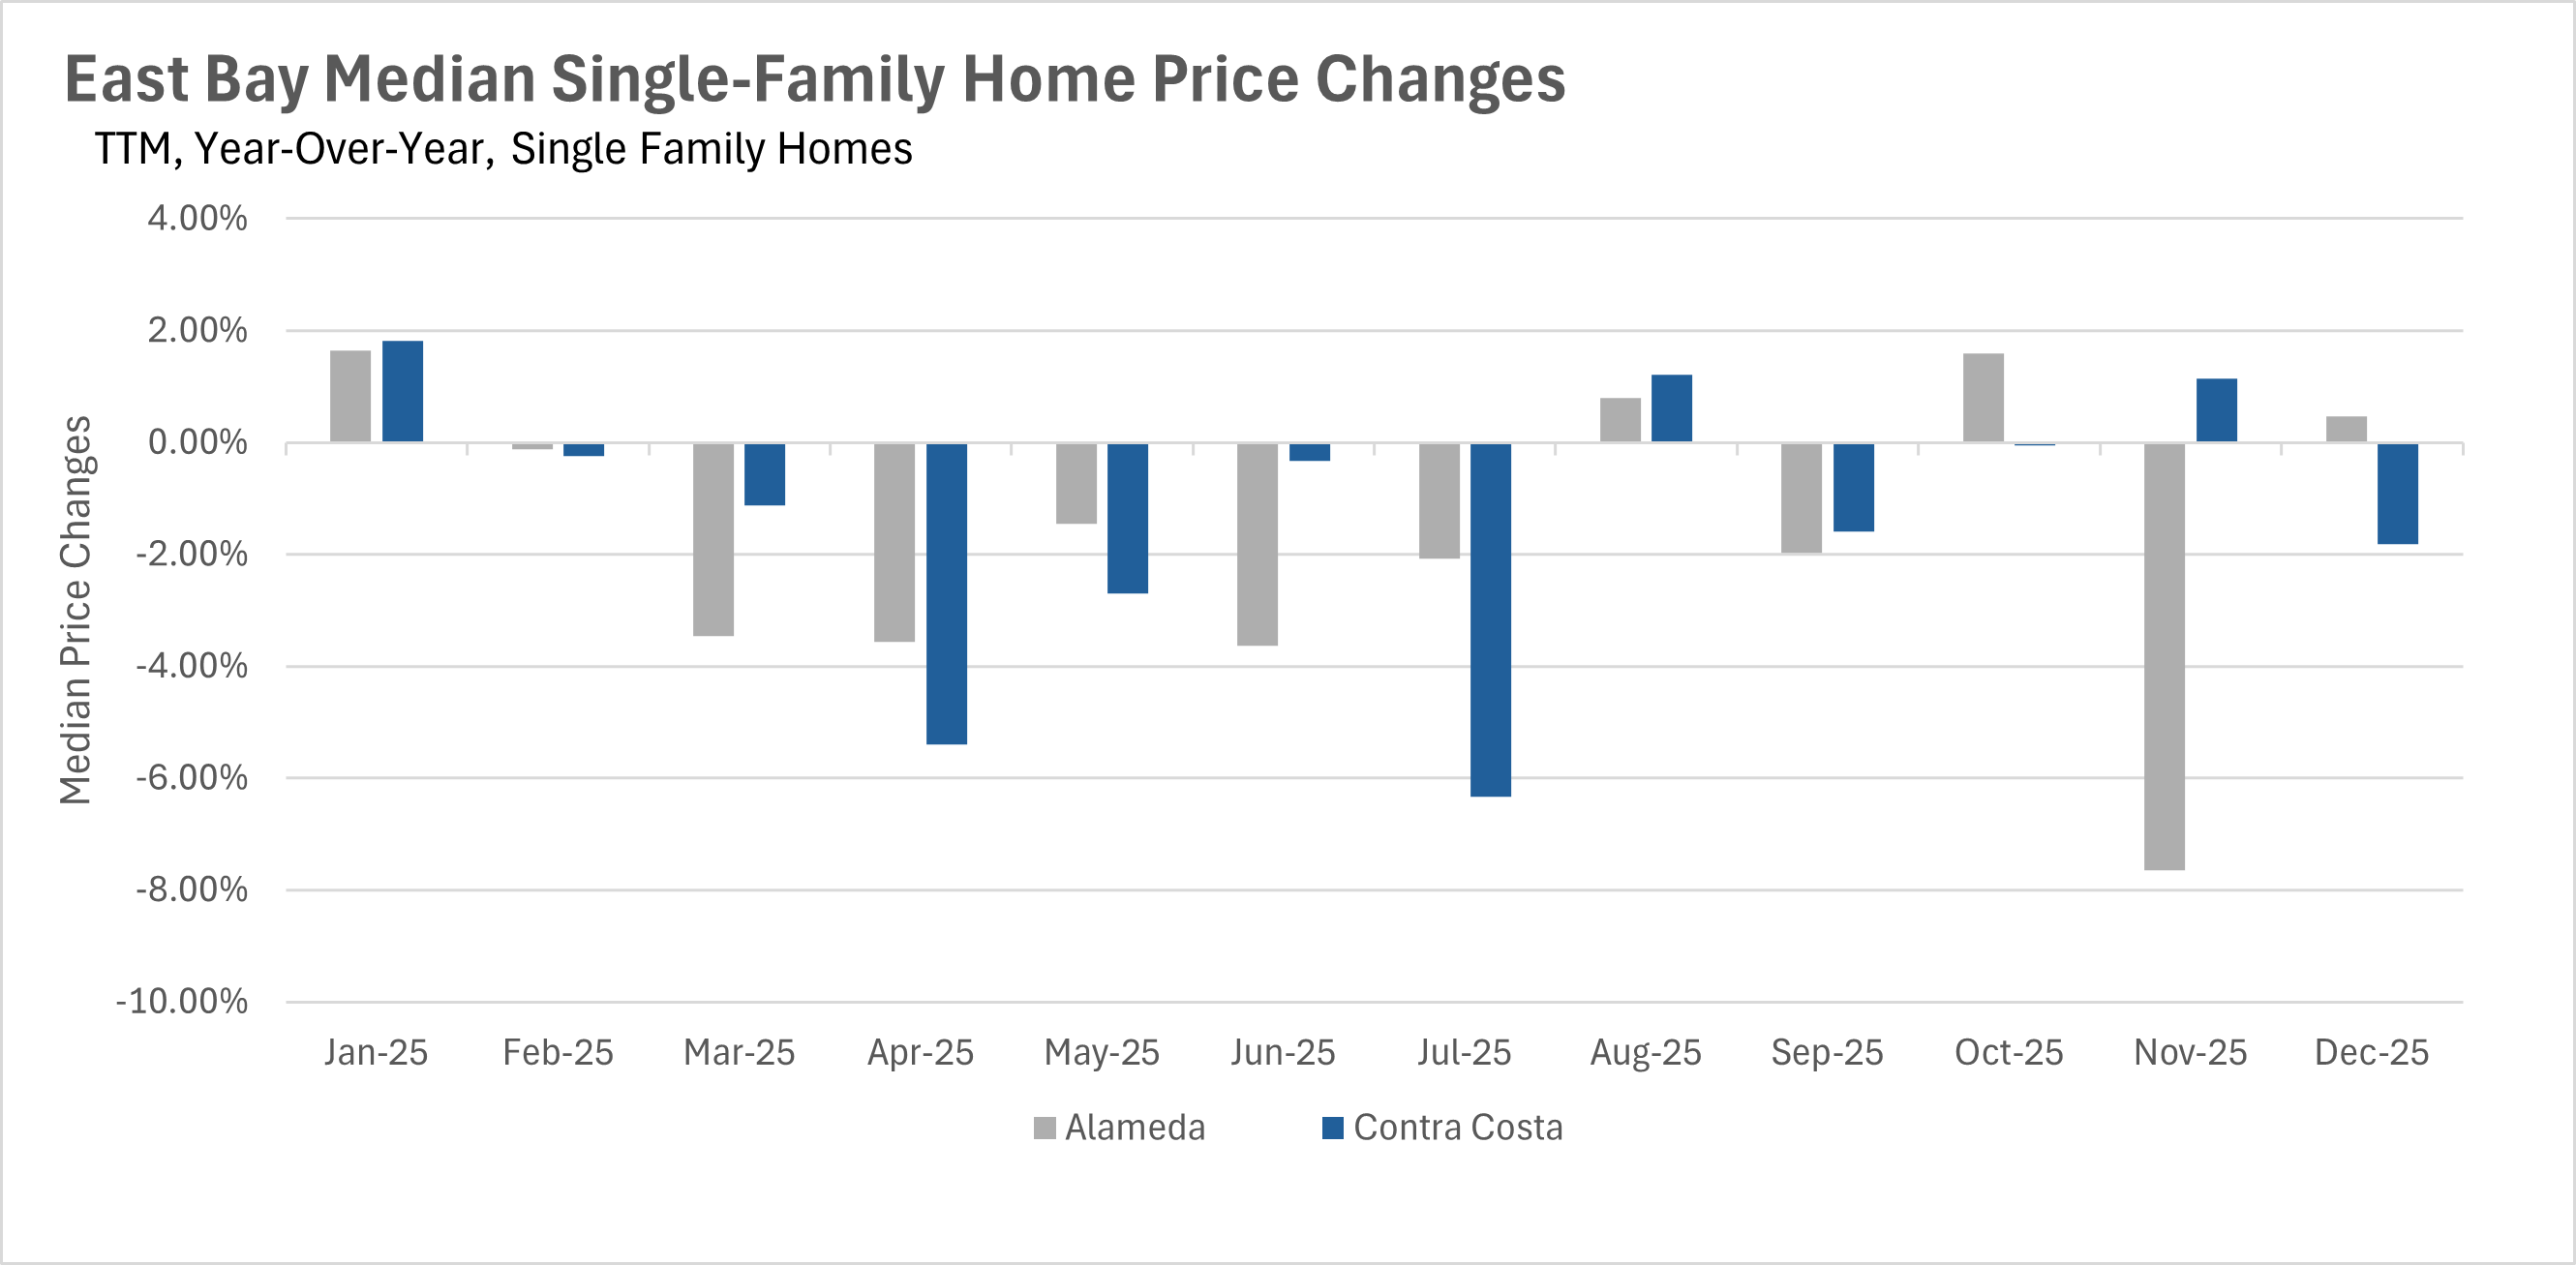
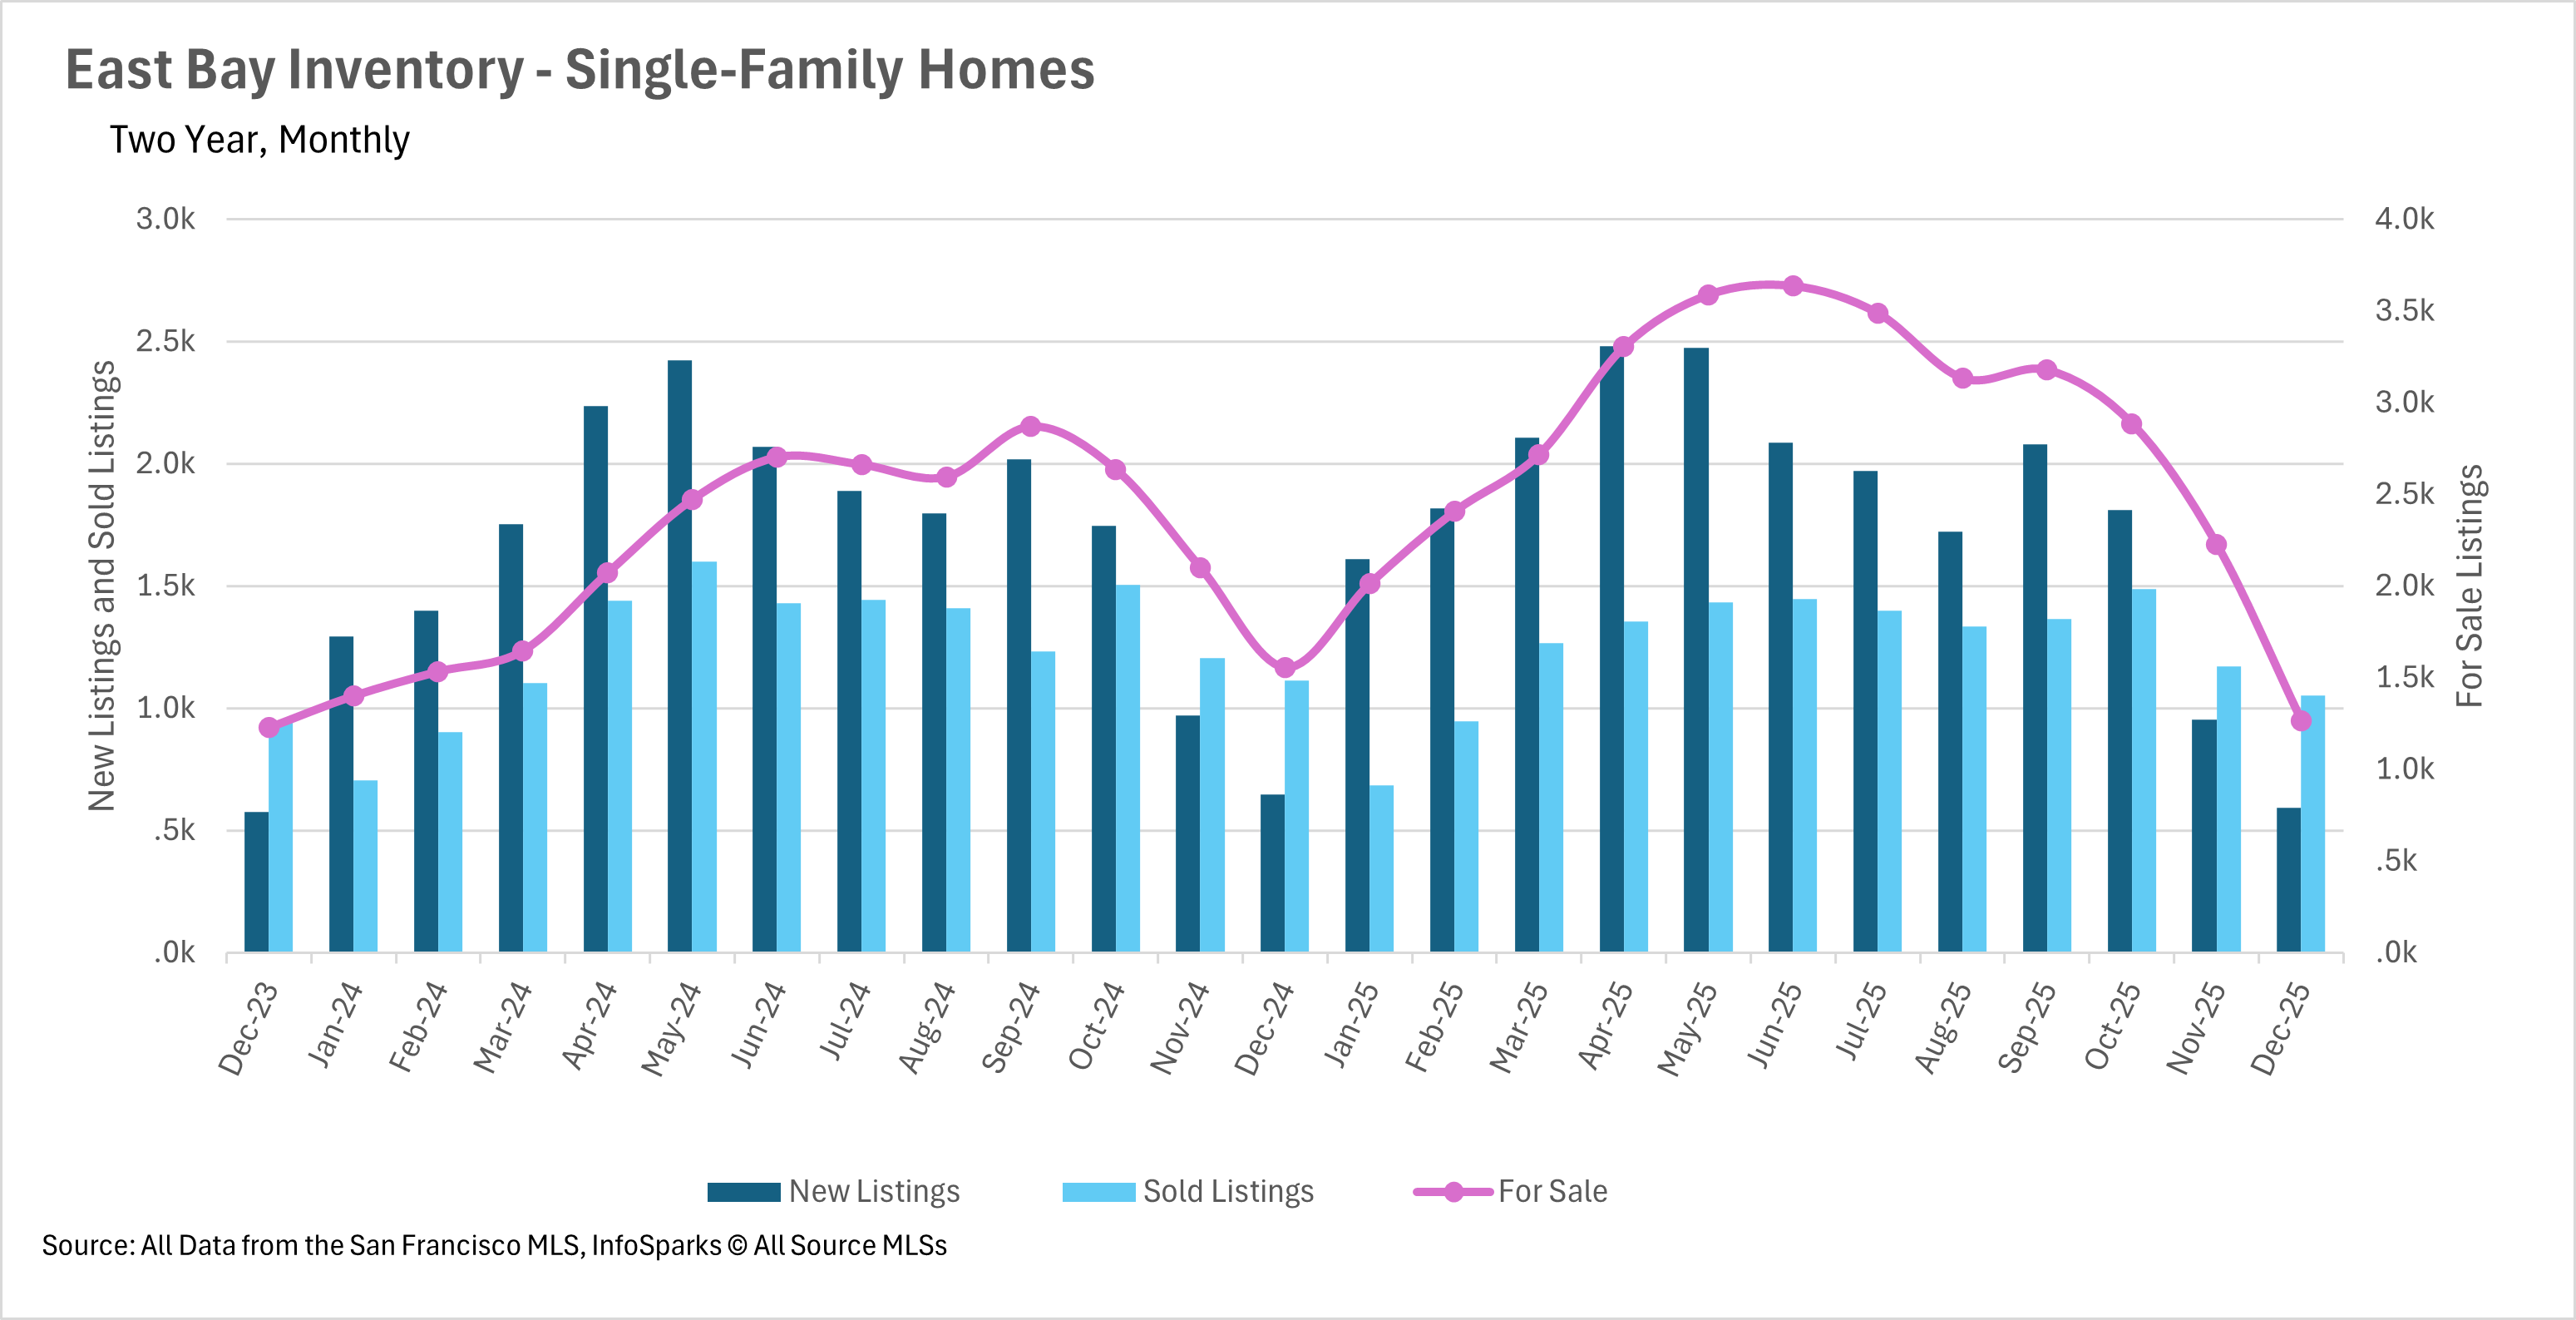
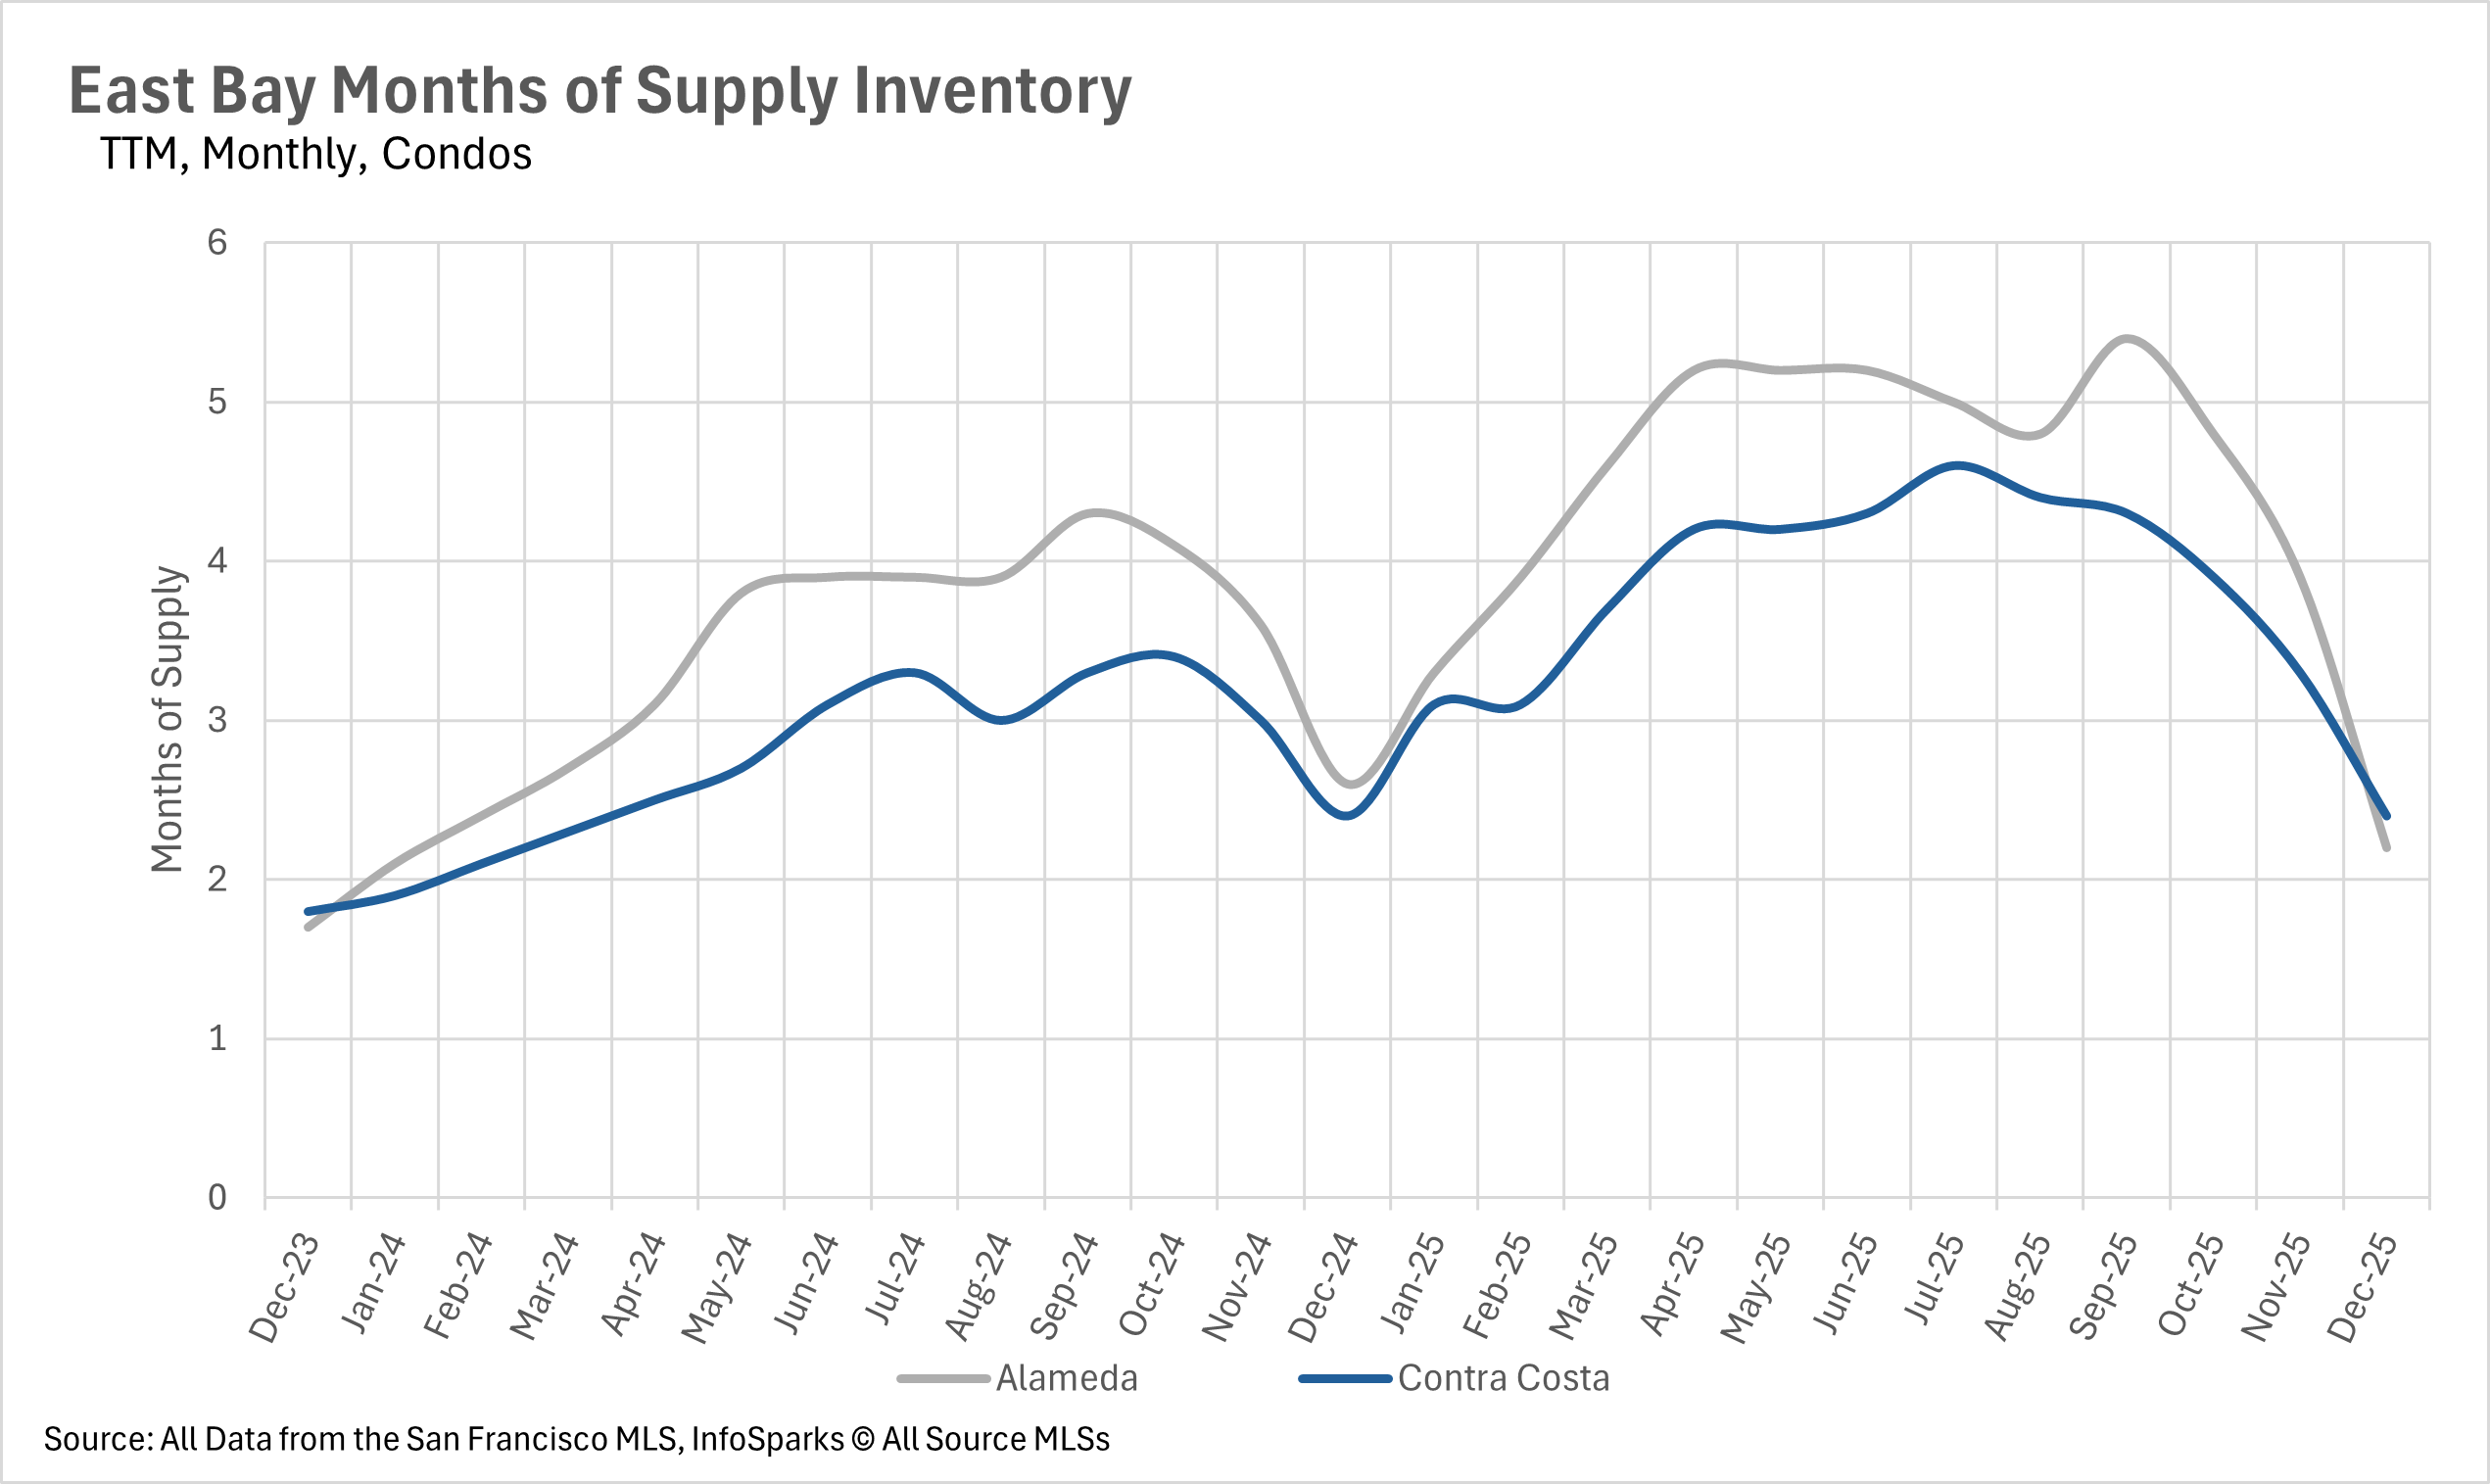
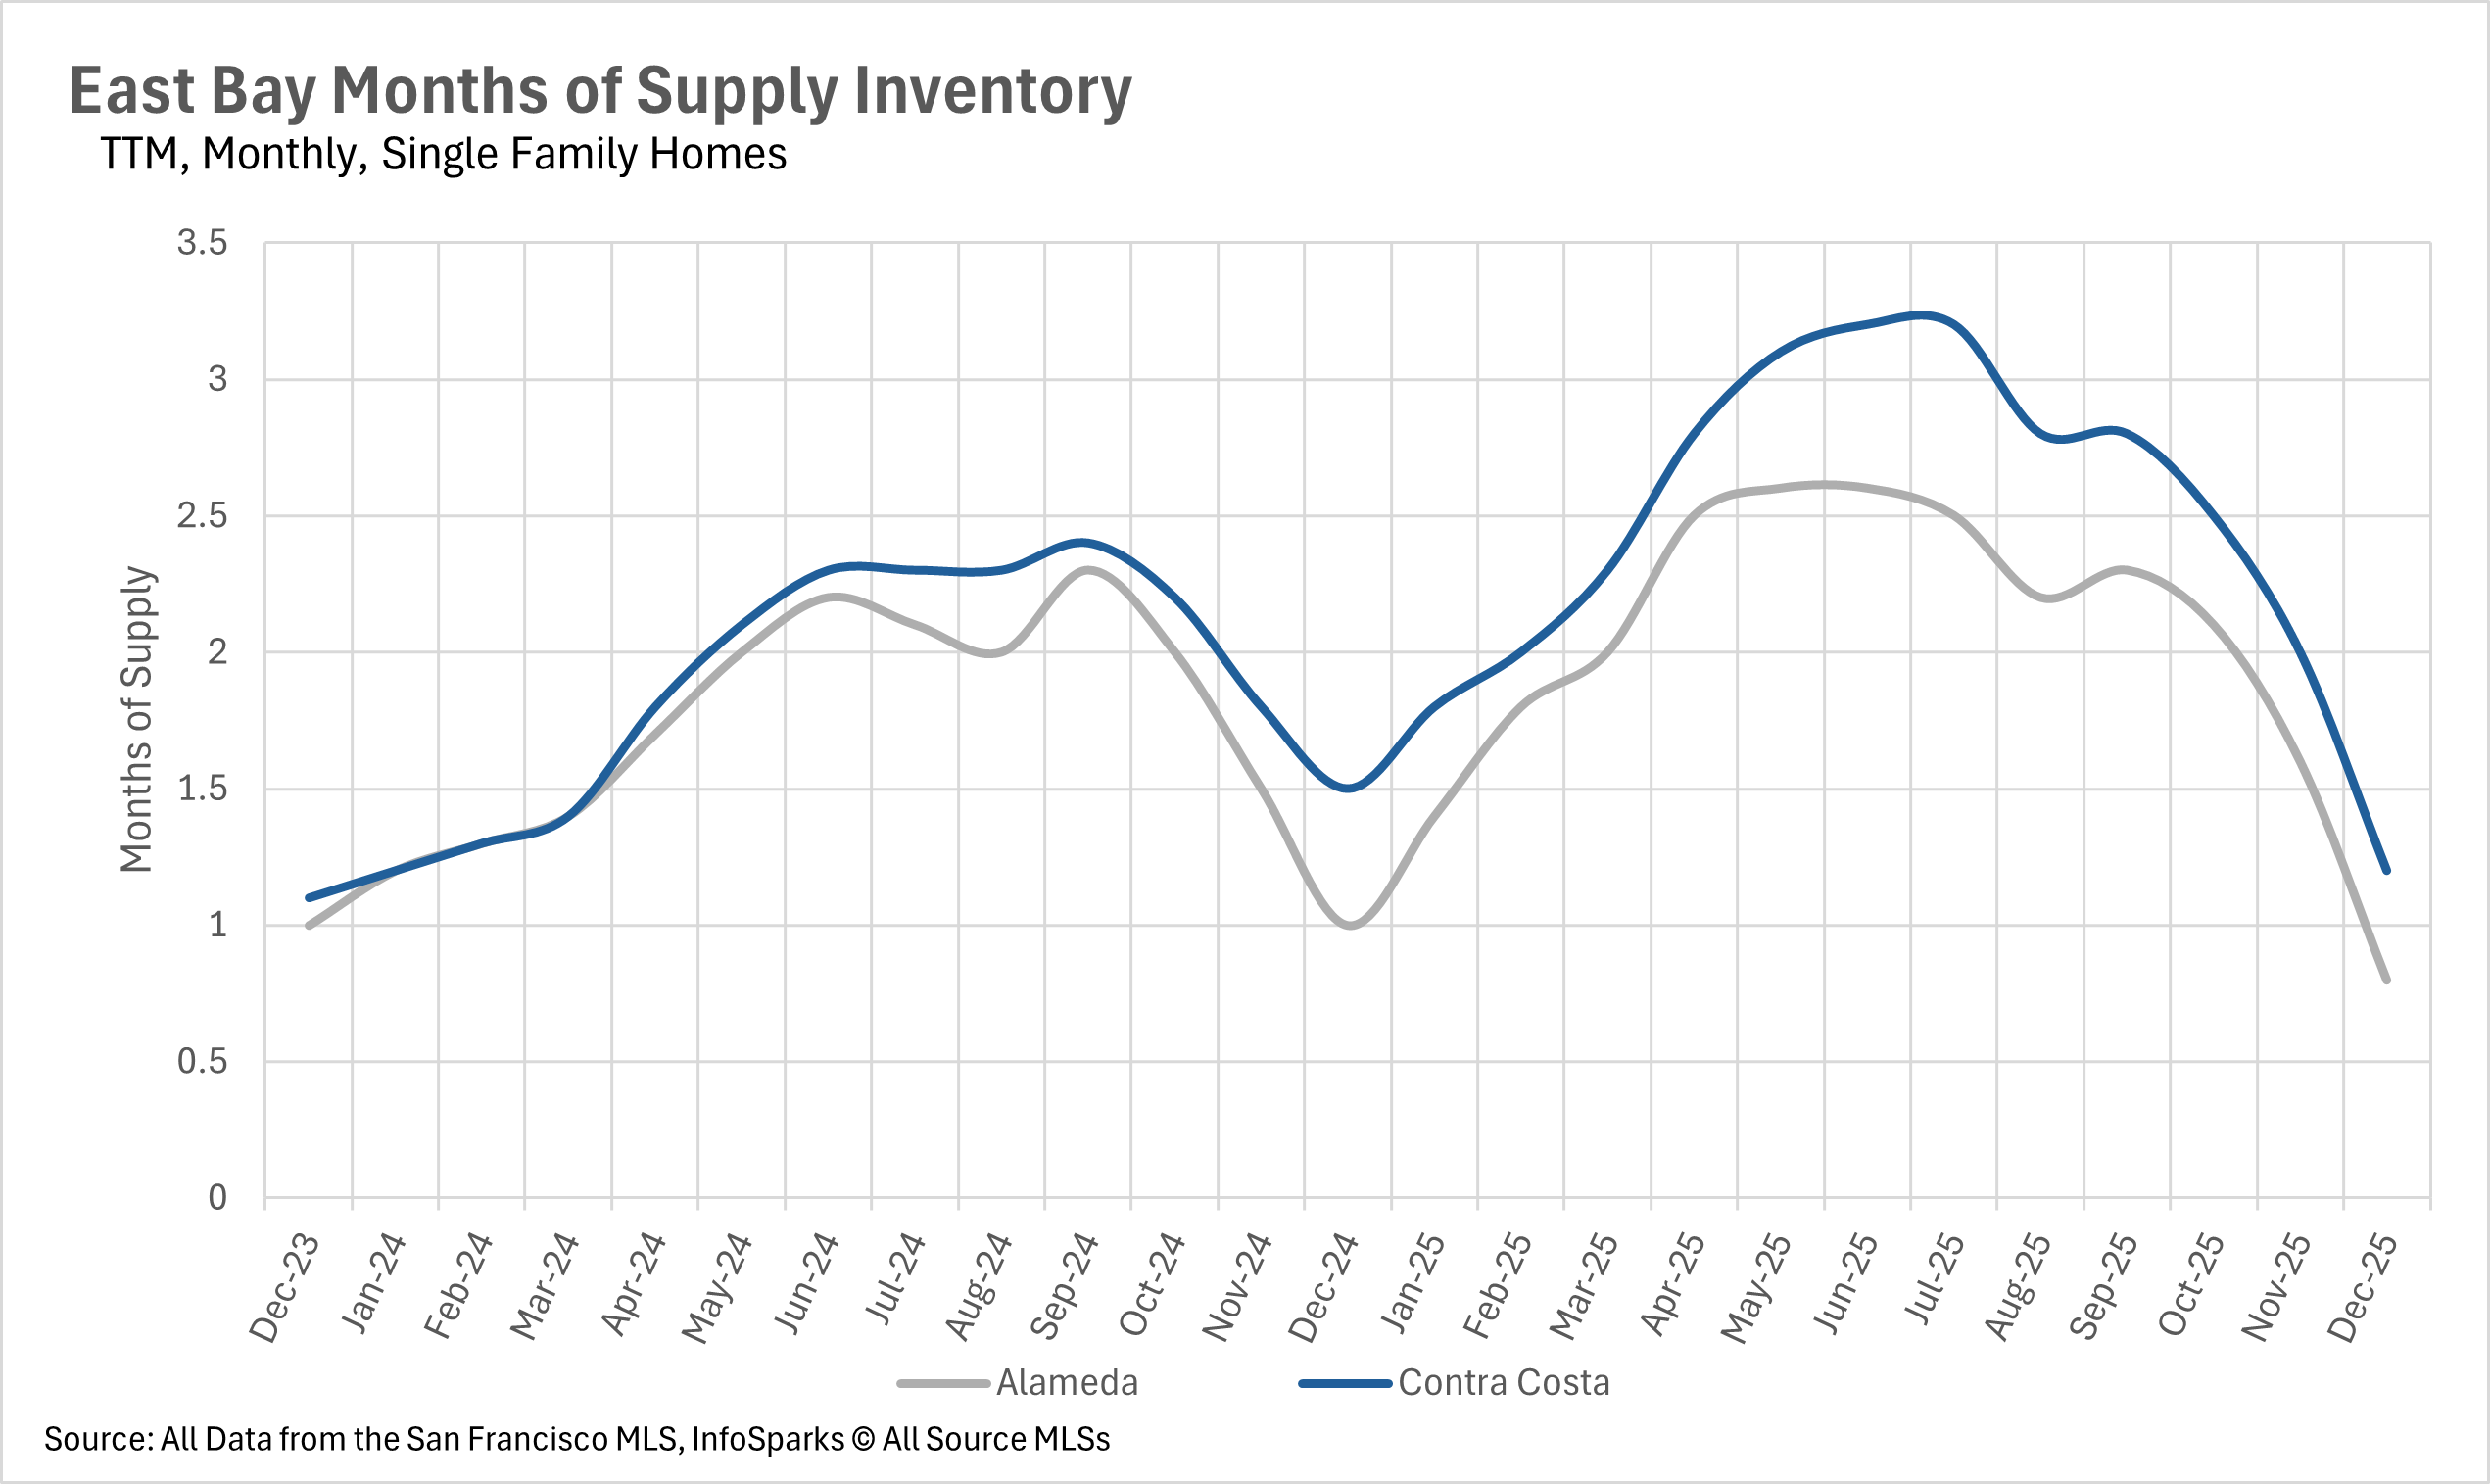
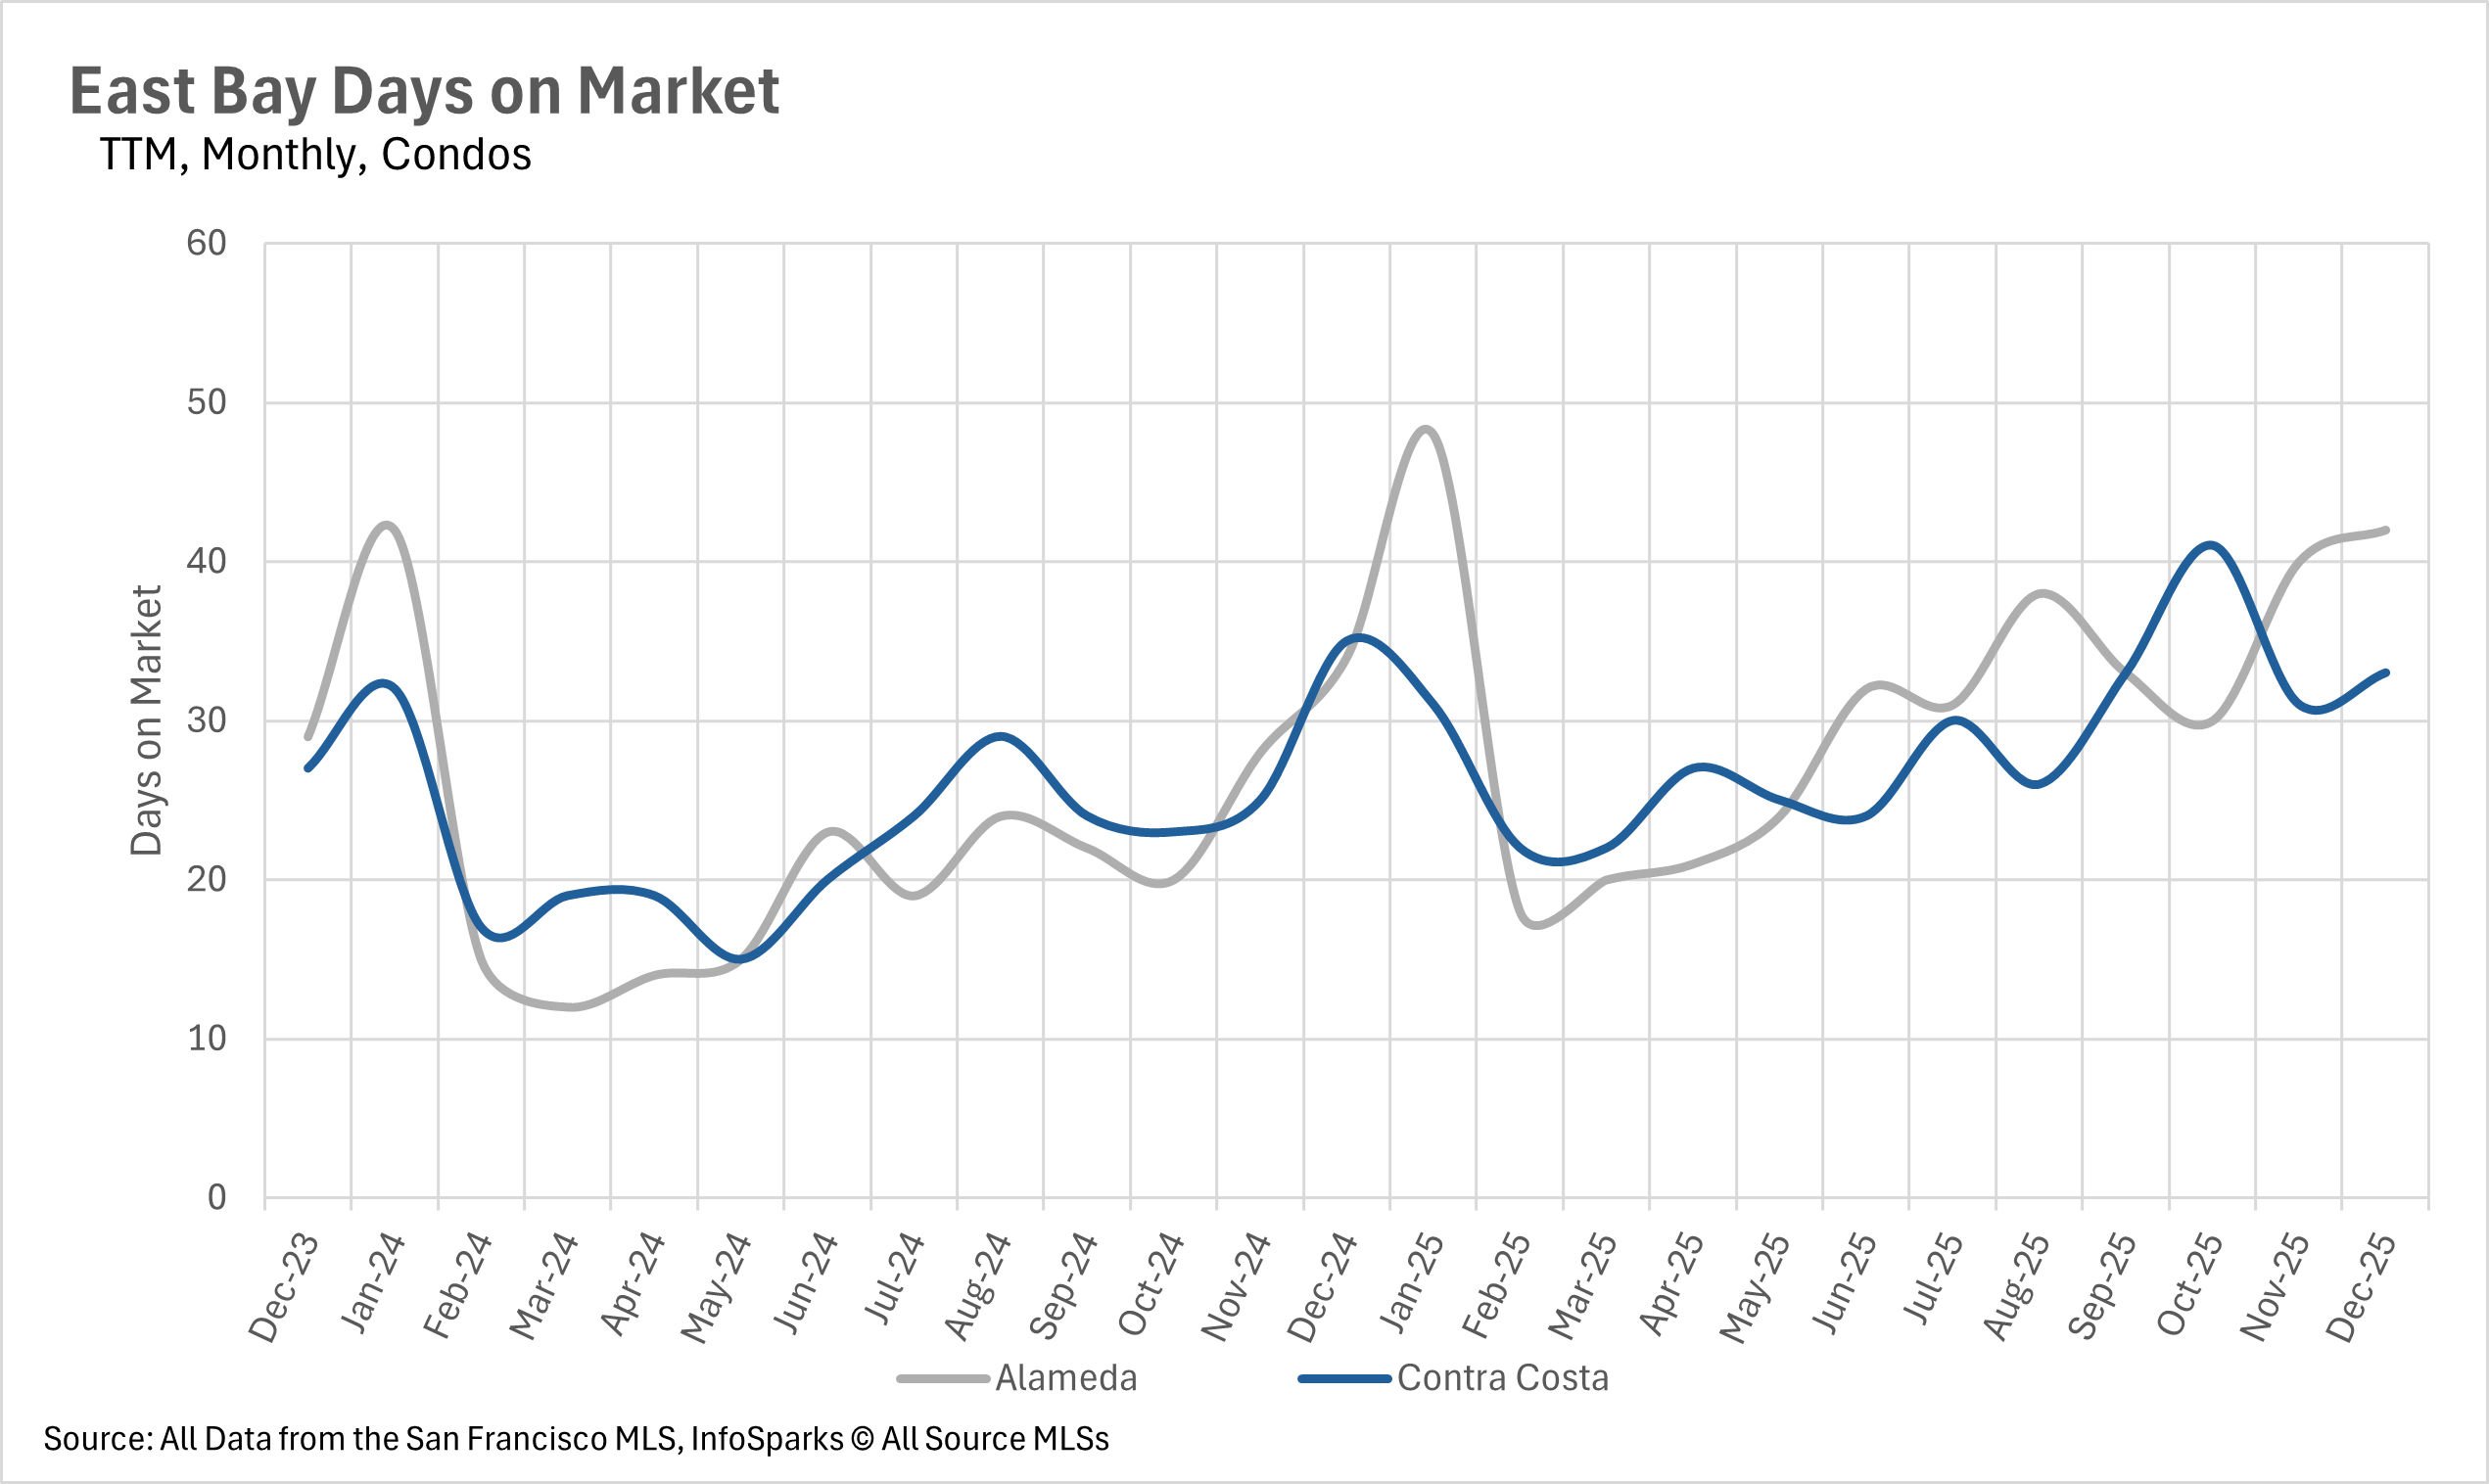
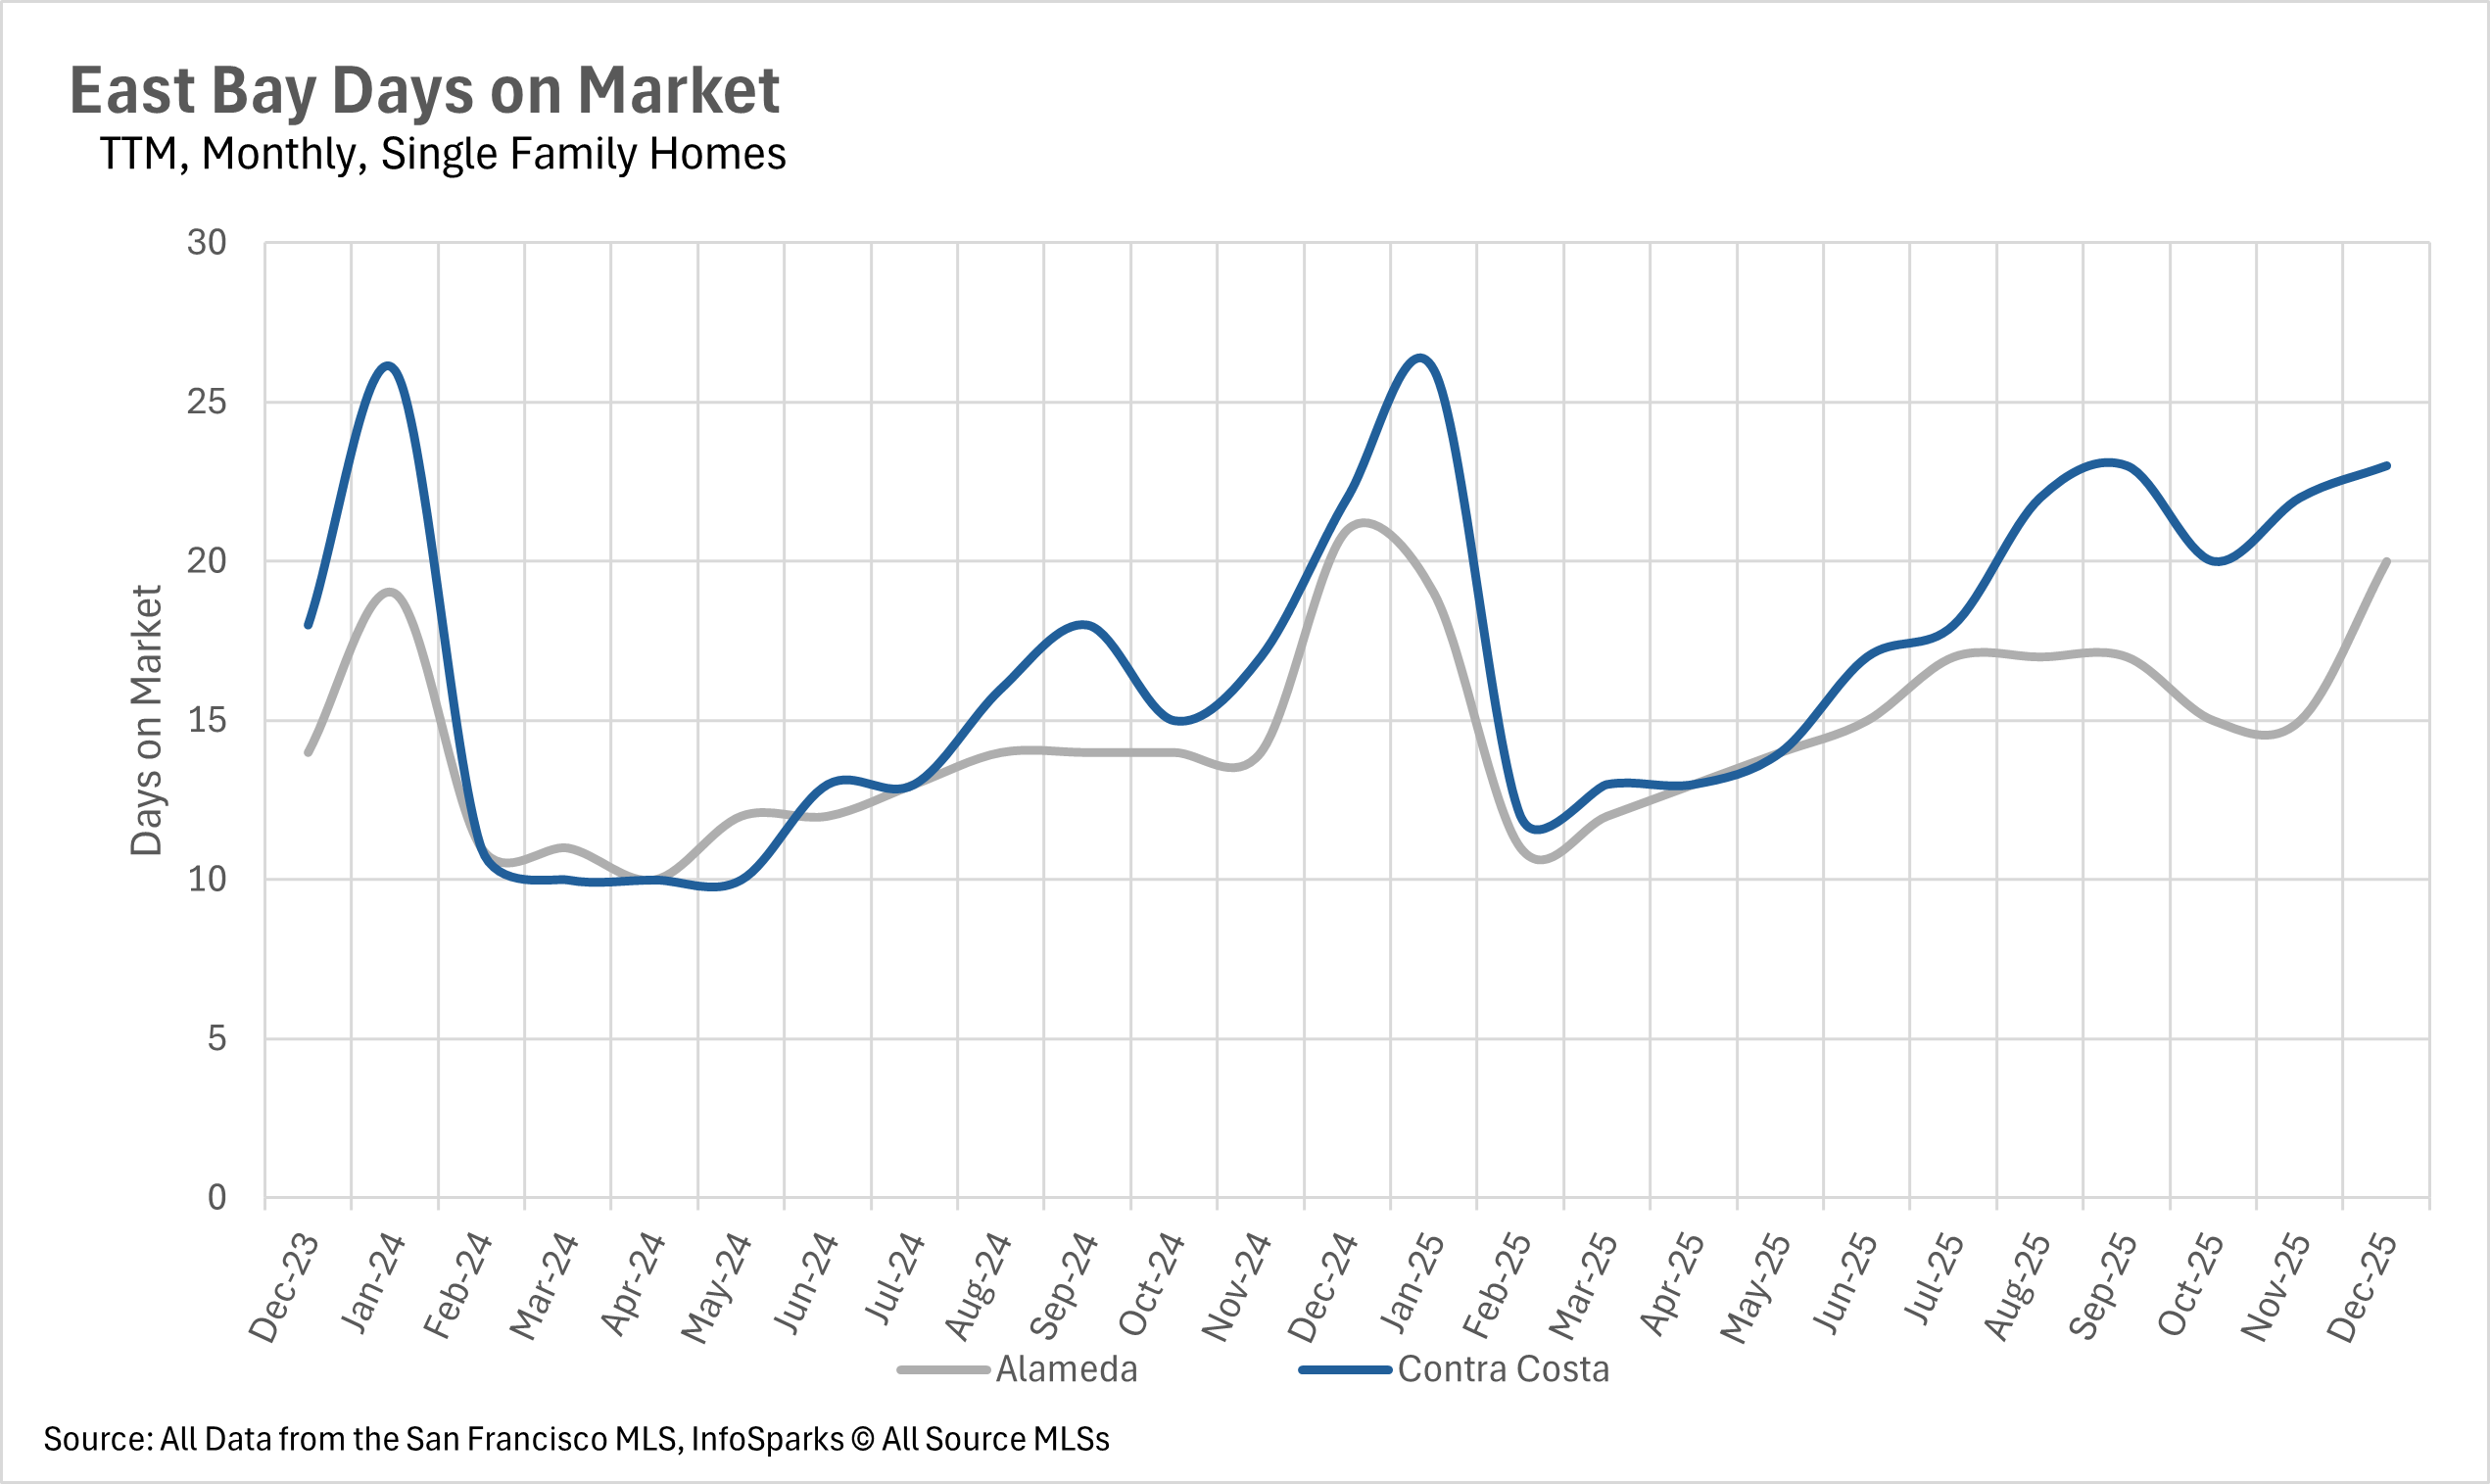
The East Bay demonstrated relative stability in single-family homes, with Alameda County up just 0.47% to $1,170,000 and Contra Costa down 1.81% to $839,500, though condos continued struggling with Alameda plummeting 19.55% to $522,500 and Contra Costa falling 7.60% to $462,000. The North Bay presented a tale of two markets, with Napa County emerging as the clear winner at 7.34% growth to $944,624 and Marin up modestly 0.83% to $1,512,500, while Sonoma and Solano declined by 1.18% and 0.61% respectively. North Bay condos showed extreme volatility with Marin crashing 33.59% while Sonoma rose 5.86% and Napa gained 13.13%.
Historic inventory contraction transforms Bay Area supply landscape
December brought an extraordinary inventory collapse across the entire Bay Area, creating some of the tightest supply conditions seen in years. San Francisco reached unprecedented levels with just 93 single-family homes for sale (down 43.64% year-over-year) and only 218 condos (down 44.10%), leaving a combined total of just 311 homes available in the entire city. Silicon Valley experienced similarly dramatic contraction, with single-family inventory plunging 43.01% month-over-month and 21.02% year-over-year to just 823 homes, while condo inventory dropped 33.04% month-over-month though remained essentially flat year-over-year.
 
The North Bay saw single-family inventory crater by 43.56% month-over-month and 38.85% year-over-year to just 1,407 homes, while condo inventory fell 36.83% month-over-month and 27.99% year-over-year to merely 211 units. This decline was exacerbated by new listings plummeting 51.19% year-over-year for single-family homes and 54.93% for condos. The East Bay showed relatively modest but still significant declines, with single-family inventory down 18.70% year-over-year to 1,265 homes and condo inventory falling 16.48% to 512 units. Across all regions, the magnitude of inventory decline exceeded typical seasonal patterns, suggesting that buyers who had been waiting on the sidelines throughout 2025 finally began acting, while new listings dried up dramatically as sellers held back during the holidays.
Market velocity shows extreme regional and property type divergence
December's days on market metrics revealed striking differences across regions and property types, with some markets accelerating dramatically while others slowed despite tight inventory. San Francisco saw the most dramatic acceleration, with single-family homes selling in just 15 days (down 16.67% year-over-year) and condos moving in 50 days (down 13.79%), creating an intensely competitive environment with very little time for buyer deliberation. The East Bay's single-family market also accelerated, with Alameda County homes selling in 20 days (down 4.76% year-over-year) and Contra Costa at 23 days, while condos slowed significantly with Alameda averaging 42 days (up 23.53%) and Contra Costa at 33 days.
 
Silicon Valley presented stark contrasts by county - San Mateo and Santa Clara maintained relatively quick movement at 18 and 14 days for single-family homes (though up 12.50% and 7.69% respectively), while Santa Cruz County experienced a dramatic slowdown with homes taking 43 days to sell (up 65.38% year-over-year). Silicon Valley condos showed mixed results with slight increases in San Mateo and Santa Clara, while Santa Cruz condos actually accelerated with a 16.13% decrease. The North Bay demonstrated the most widespread slowdown despite inventory collapse, with single-family homes in Sonoma spending 61 days on market (up 35.56%), Solano at 50 days (up 42.86%), and even Marin increasing slightly by 2.04%. However, Napa County condos bucked the trend with a 22.06% decrease in market time.
Extreme seller's market conditions dominate the entire Bay Area
December's inventory collapse pushed the entire Bay Area into extreme seller's market territory, with some regions reaching the tightest supply constraints in years. San Francisco achieved the most extreme conditions in the state with just 0.5 months of single-family home supply and 1.2 months of condo inventory - some of the lowest MSI figures seen in years with no indication of relief. Silicon Valley reached similarly extreme levels, with San Mateo and Santa Clara Counties both at just 0.6 months of single-family home supply (down 33.33% and 14.29% year-over-year respectively), while Santa Cruz dropped to 2.0 months (down 28.57%). Silicon Valley condos moved decisively toward seller's markets with San Mateo at 1.7 months, Santa Clara at 2.1 months, and Santa Cruz at 3.2 months.
 
The East Bay ended the year with extraordinarily tight conditions, posting just 0.8 months of single-family inventory in Alameda County and 1.2 months in Contra Costa (both down 20% year-over-year), while even condos entered seller's territory at 2.2 and 2.4 months respectively. The North Bay experienced a dramatic holiday season shift, with Marin County leading at an extreme 0.8 months of single-family supply (down 66.67% year-over-year), Sonoma at 1.5 months, Solano at 1.8 months, and even Napa - which had been a strong buyer's market throughout 2025 - dropping to 4.0 months. North Bay condos also tightened considerably with Marin at 2.0 months, Sonoma at 2.2 months, and Solano and Napa at 3.5 and 3.7 months respectively. This region-wide transformation into seller's market territory, combined with historically low new listing activity, suggests intense competition will continue into early 2026 until significant new inventory enters the market.
Local Lowdown Data

Let’s Talk

You’ve got questions and we can’t wait to answer them.