Leave a Message

Thank you for your message. We will be in touch with you shortly.

Buyers are gaining leverage for the first time in a while

Buyers are gaining leverage for the first time in a while
The Big Story
Quick Take:
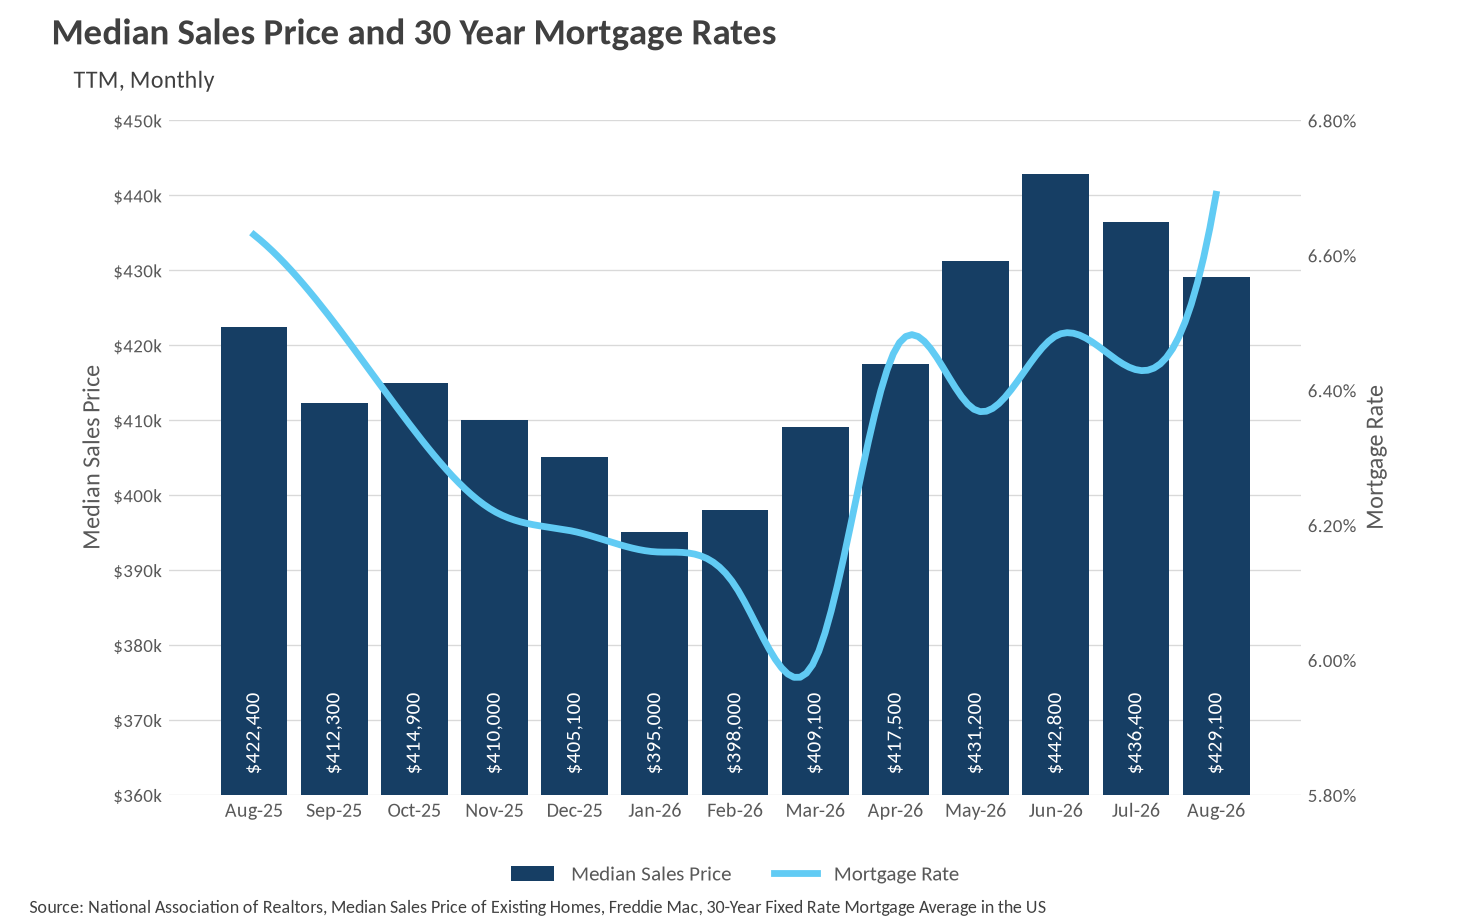
  • Median home sale prices slipped for the second straight month in August, falling to $429,100 from June's peak of $442,800, though they remain slightly above where they were a year ago.
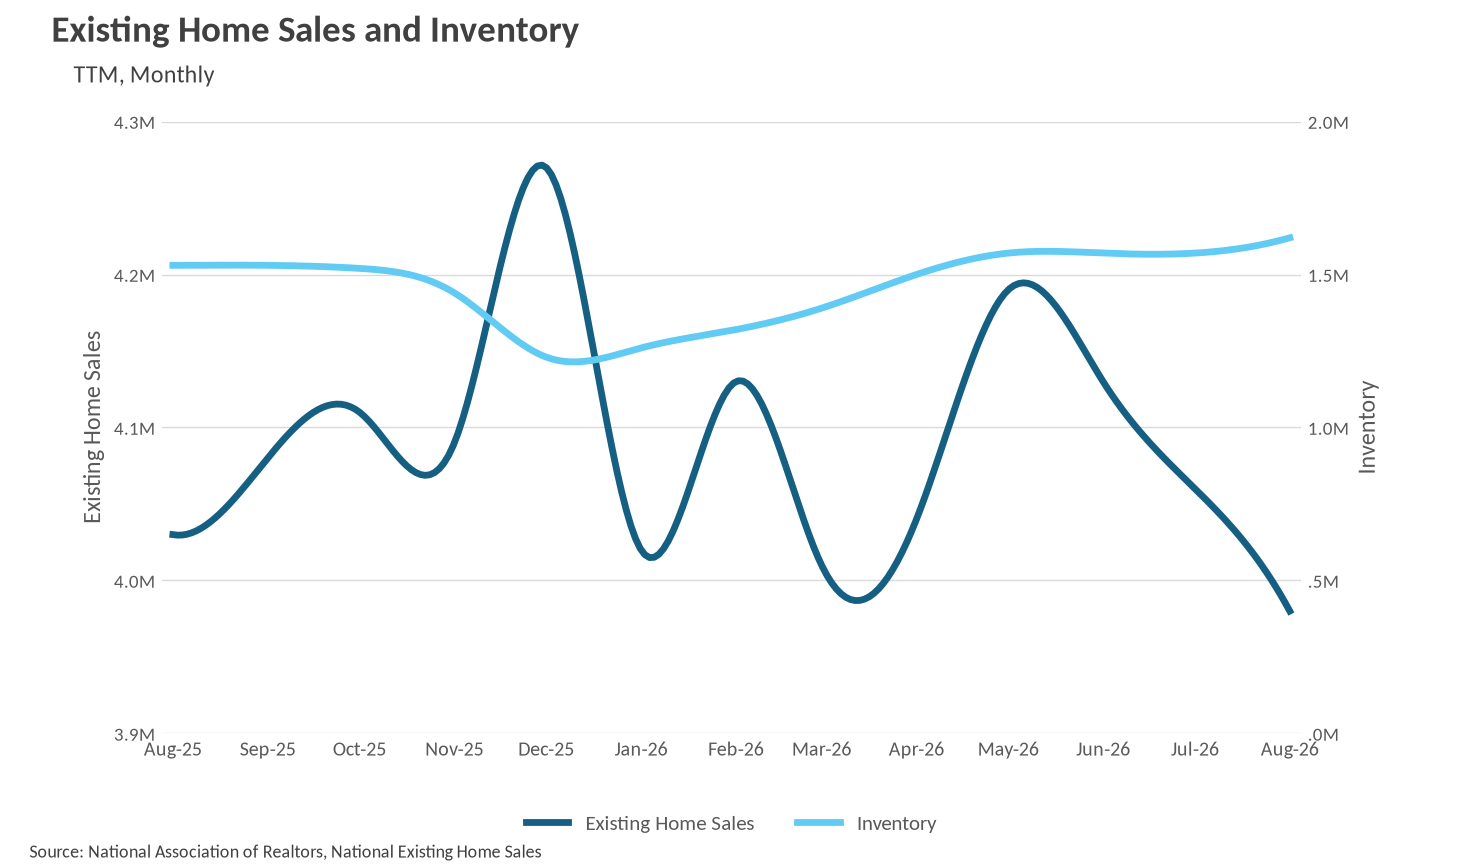
  • Inventory pushed higher again in August, reaching 1,620,000 homes for sale, the highest level we have seen in this cycle and nearly 6% above last year.
  • Existing home sales fell to 3,980,000, the softest reading in over a year, as mortgage rates climbed to 6.69% in August and 6.71% in September.
Note: You can find the charts & graphs for the Big Story at the end of the following section.
*National Association of REALTORS® data is released two months behind, so we estimate the most recent month's data when possible and appropriate.

The spring rally has given way to a summer cooldown
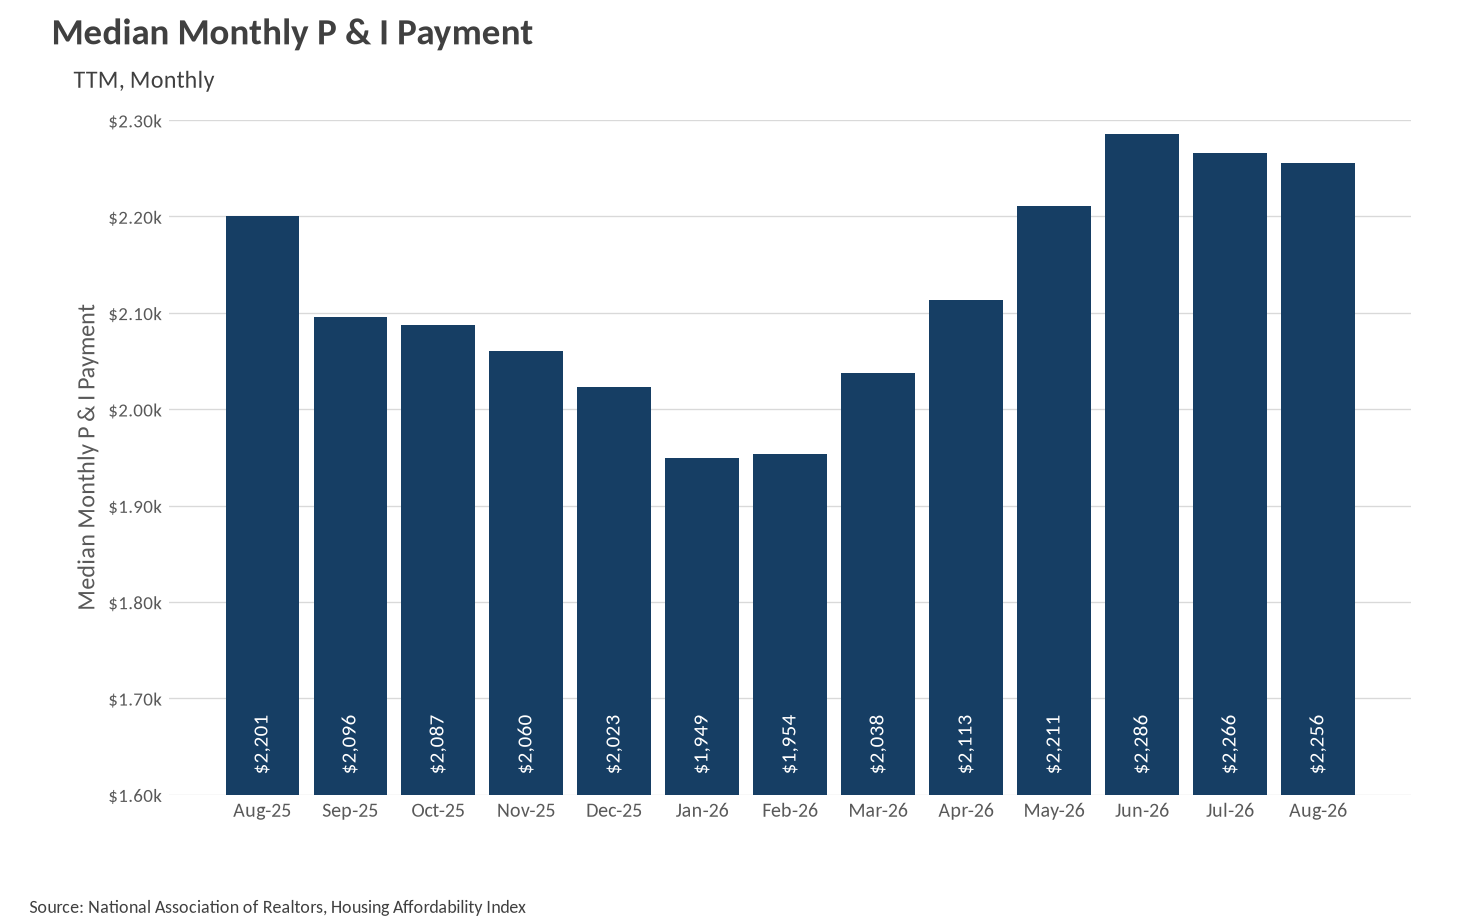
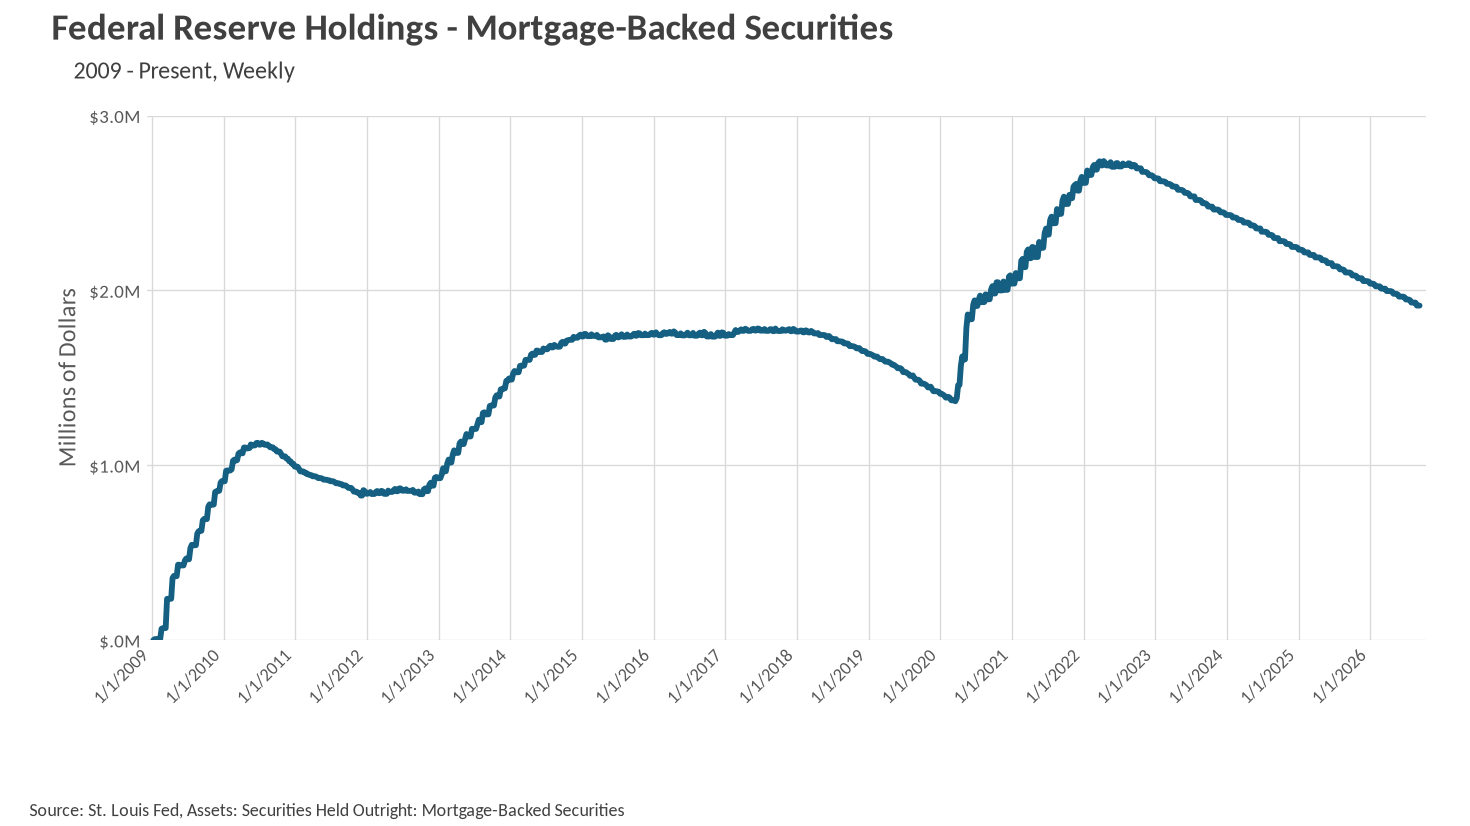
After five straight months of gains carried the median sale price to $442,800 in June, prices have now declined in each of the past two months. In August, the median home sold for $429,100, a 1.67% month-over-month decline from July's $436,400 and a 3.09% pullback from the June peak. The one bright spot is that prices are still running 1.59% above the $422,400 median we saw in August of last year, so the year-over-year comparison remains positive even as the seasonal momentum fades. The affordability story, however, has turned decisively less friendly. Mortgage rates jumped to 6.69% in August and edged up again to 6.71% in September, the highest readings in this entire data series and a full 71 basis points above the 6.00% low we saw back in March. The median monthly principal and interest payment now sits at $2,256, which is 2.50% higher than the $2,201 buyers were paying a year ago and more than $300 above the $1,949 January low. In other words, the affordability cushion that lower rates provided at the start of the year has now been completely erased. It is also worth noting that the Federal Reserve's mortgage-backed securities holdings have continued to run off, declining from roughly $2.05 trillion at the end of last year to about $1.91 trillion in September, which removes a meaningful source of demand for mortgage debt and helps explain why rates have been drifting higher even as the broader market cools.
Inventory keeps building, and that is the real story this month
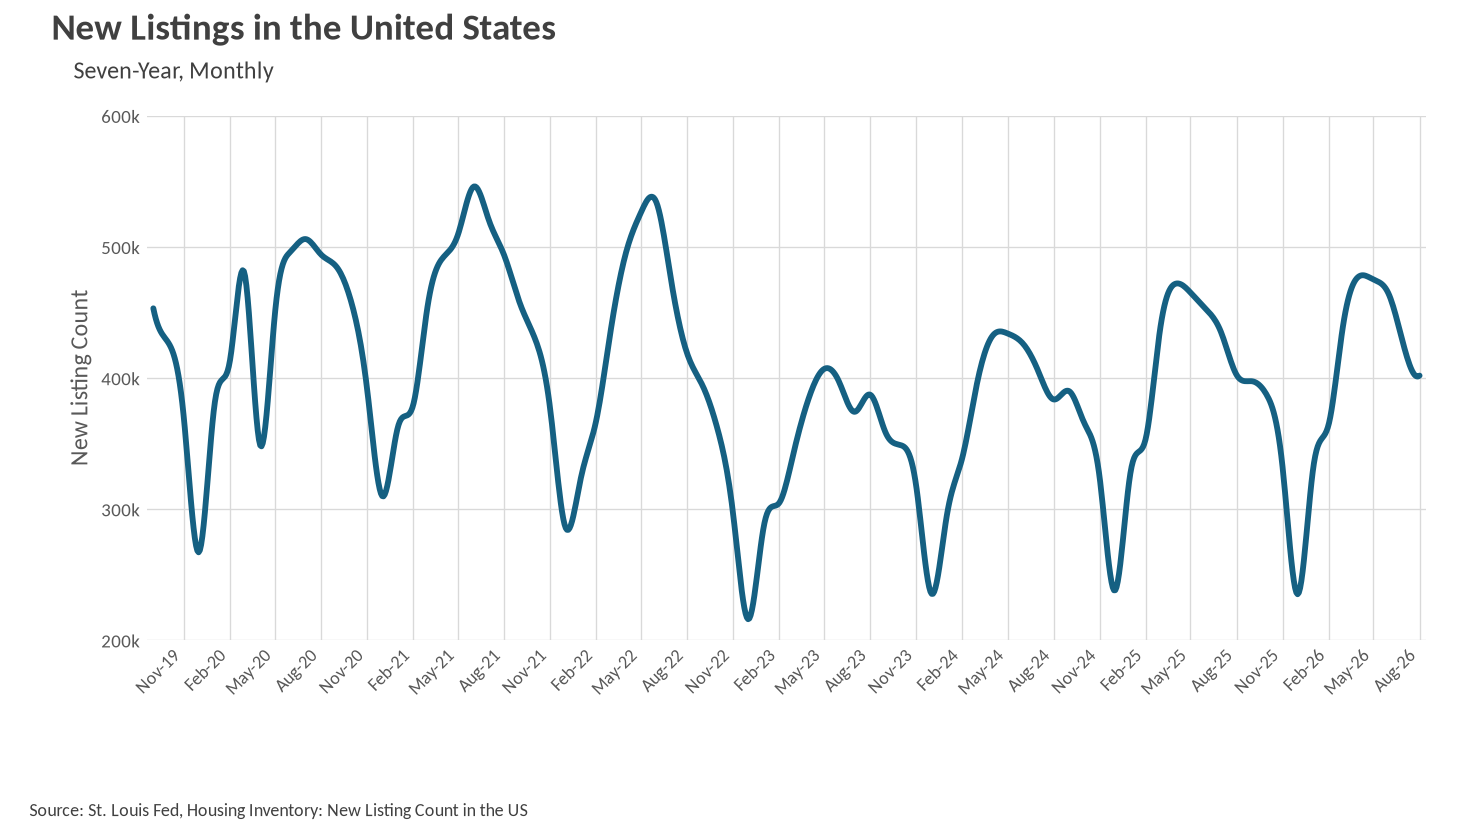
Inventory did not plateau after all. After holding flat at 1,570,000 homes for three consecutive months from May through July, inventory jumped to 1,620,000 in August, a 3.18% month-over-month increase and a 5.88% gain over the 1,530,000 homes available at this time last year. That is the highest inventory level anywhere in this data series, and it represents a 31.7% increase from the December low of 1,230,000. What makes this build particularly notable is that it is not being driven by a flood of new supply. New listings actually fell to 401,760 in August, down 5.18% from July's 423,732 and essentially flat compared to the 402,276 new listings we saw in August of last year. So sellers are not listing more aggressively than they were a year ago. Instead, inventory is accumulating because homes are not clearing at the pace they once did. That distinction matters, because supply that builds from weak absorption tends to be stickier and puts more direct pressure on pricing than supply that builds from a surge of eager sellers.
Existing home sales have slipped below last year's pace
Existing home sales came in at 3,980,000 in August, a 1.97% month-over-month decline from July's 4,060,000 and a 1.24% drop from the 4,030,000 pace we saw in August of last year. This is the weakest sales figure in the data we have, and it marks a clear reversal from the spring, when sales were running above the prior year and reached 4,190,000 in May. The culprit is not hard to identify. Buyers who were enjoying sub-$2,000 monthly payments in January are now looking at $2,256, and mortgage rates that started the year at 6.16% are now sitting at 6.71%. When financing costs move that much in nine months, the marginal buyer simply steps out of the market, and that is exactly what the sales data is showing. Three consecutive months of declining sales, combined with inventory pushing to new highs, tells us that the balance of the market has shifted in a way it had not through the first half of the year. The question now is whether rates stabilize and let buyers re-engage this fall, or whether we continue to see demand erode into the winter.
Buyers are gaining leverage for the first time in a while
When determining whether a market is a buyers’ market or a sellers’ market, we look to the Months of Supply Inventory (MSI) metric. The state of California has historically averaged around three months of MSI, so any area with at or around three months of MSI is considered a balanced market. Any market that has lower than three months of MSI is considered a seller’s market, whereas markets with more than three months of HSI is considered buyers’ markets.

At the national level, the numbers point clearly toward a buyers' market. With 1,620,000 homes for sale in August against an annualized sales pace of 3,980,000, the implied months of supply works out to roughly 4.9 months, comfortably above the three-month threshold that separates balanced markets from buyers' markets. A year ago, that same calculation produced about 4.6 months, so supply has loosened meaningfully over the past twelve months. Every component of the equation is currently moving in buyers' favor: inventory is at a cycle high and rising, sales are falling on both a monthly and annual basis, and median prices have declined for two straight months. The obvious catch is affordability. Buyers may have more negotiating room and more homes to choose from than at any point in recent memory, but with rates at 6.71% and monthly payments up more than $300 since January, the cost of taking advantage of that leverage has risen sharply. Sellers, for their part, should expect longer marketing times and more price sensitivity than they saw this spring. As always, real estate is a highly localized asset, which is why you should check out what's going on in your local market below in the Local Lowdown!

Big Story Data

The Local Lowdown
Quick Take:
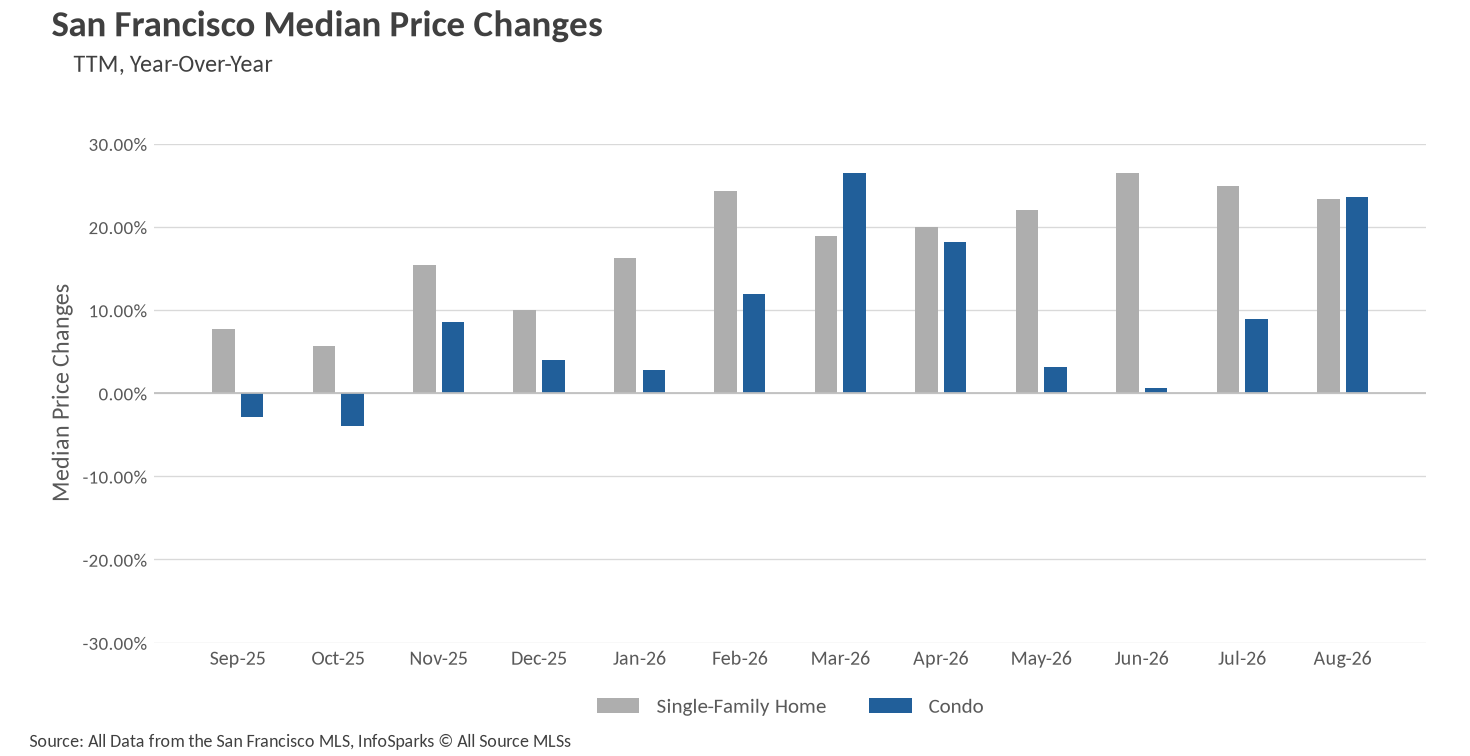
  • Single-family home prices are up more than 23% year-over-year, though August's median of $1,850,000 marks the third consecutive monthly step down from the spring peak.
  • Inventory continues to tighten, with single-family listings down 33% and condo listings down more than 36% compared to last August.
  • Single-family homes are selling in 13 days, while condos have accelerated dramatically to 19 days, down from 51 days a year ago.
Note: You can find the charts/graphs for the Local Lowdown at the end of this section.

Prices cool off from spring highs but remain far above last year
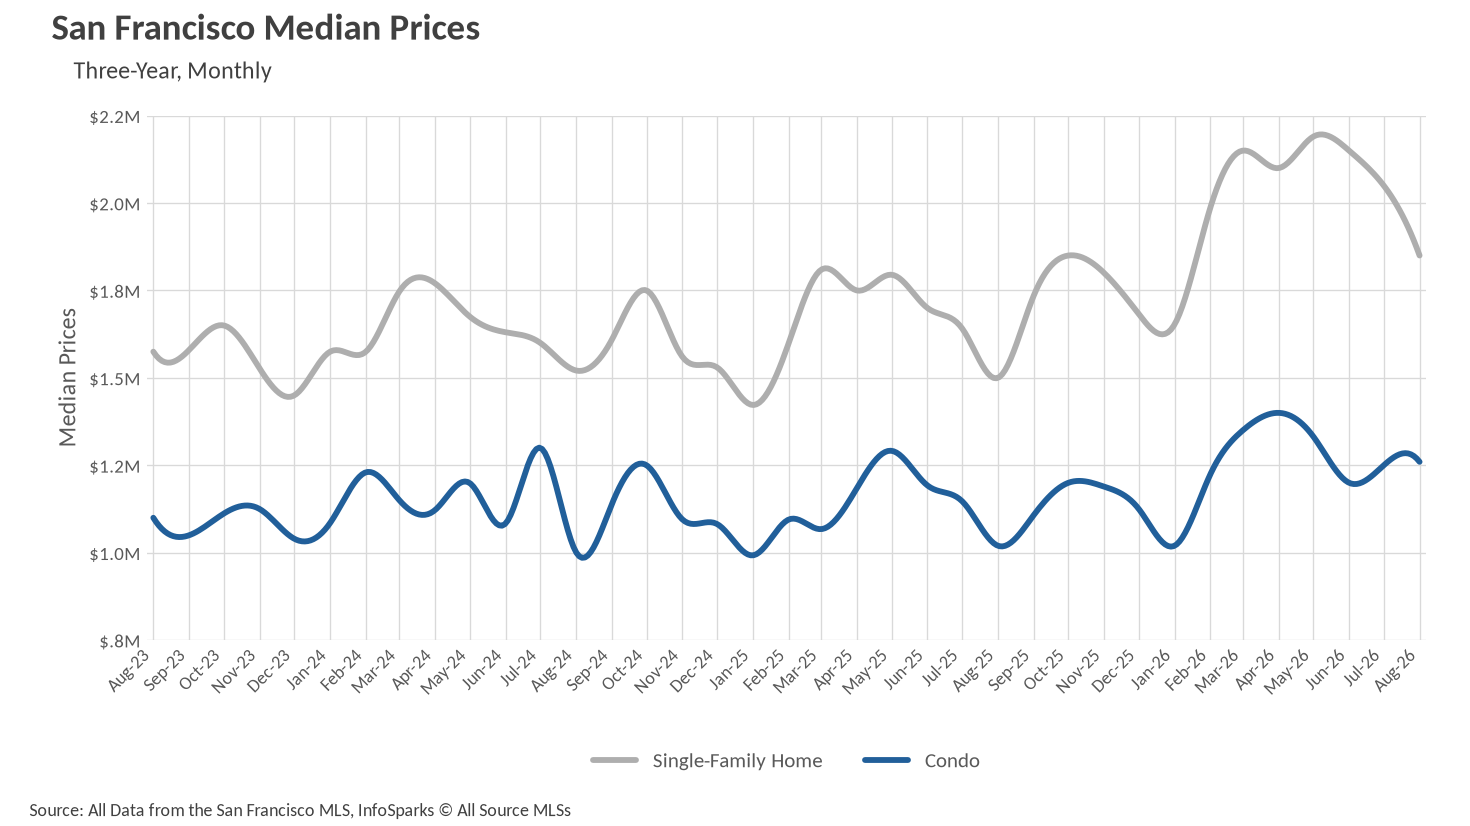
August delivered a familiar pattern for San Francisco's single-family market: strong annual growth paired with a seasonal retreat from the spring peak. The median sale price landed at $1,850,000, a 23.33% gain over the $1,500,000 recorded in August 2025, but also the third straight monthly decline from May's high of $2,190,000. July's $2,050,000 gave way to a 9.76% month-over-month drop, which is typical of late-summer trading when the most competitive listings have already cleared the market.

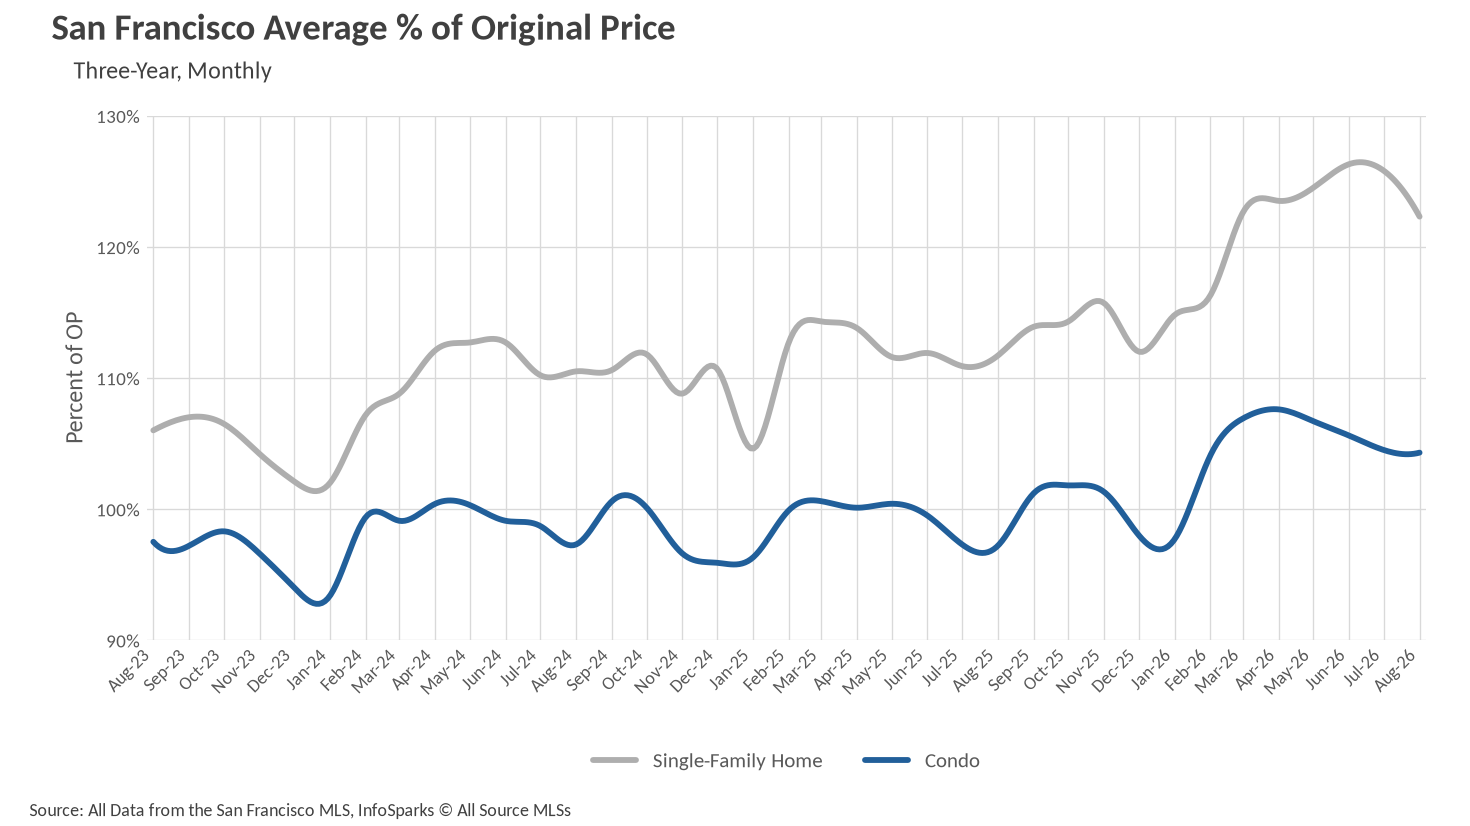
The condo market told a quietly encouraging story. At $1,260,000, the median condo price rose 0.80% from July and climbed 23.53% year-over-year, matching the single-family market's annual pace for the first time in recent memory. Condos have now posted three consecutive months of stability in the $1.2 million range after a volatile spring. Bidding behavior remains aggressive on the single-family side, where homes sold for an average of 22% above their original asking price, well ahead of the 12% premium recorded last August, even as that figure eased from the 26% peak seen in June and July. Condos held steady at 4% over asking, up from 3% below asking a year ago.

Supply keeps shrinking even as sellers return
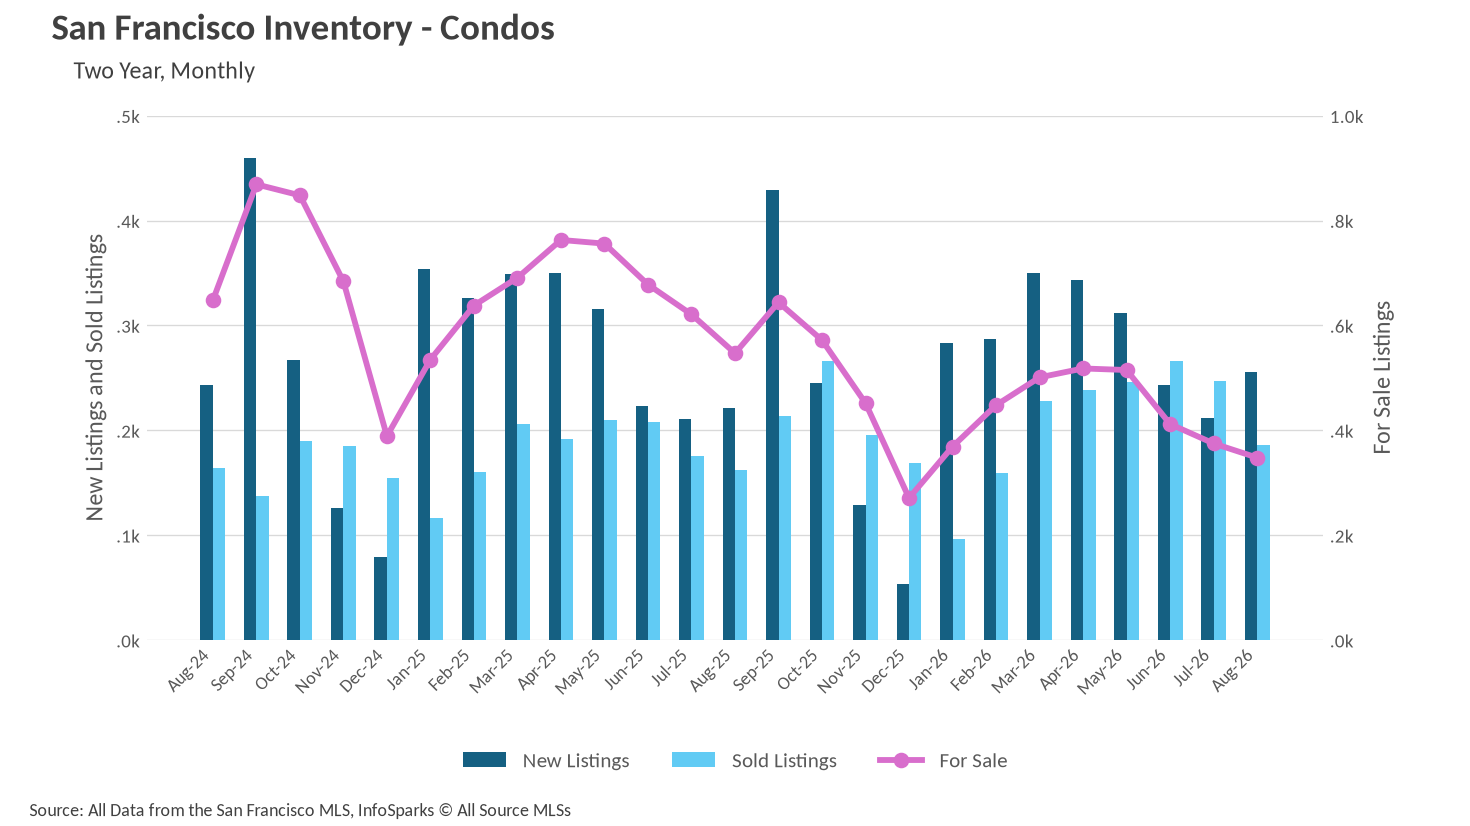
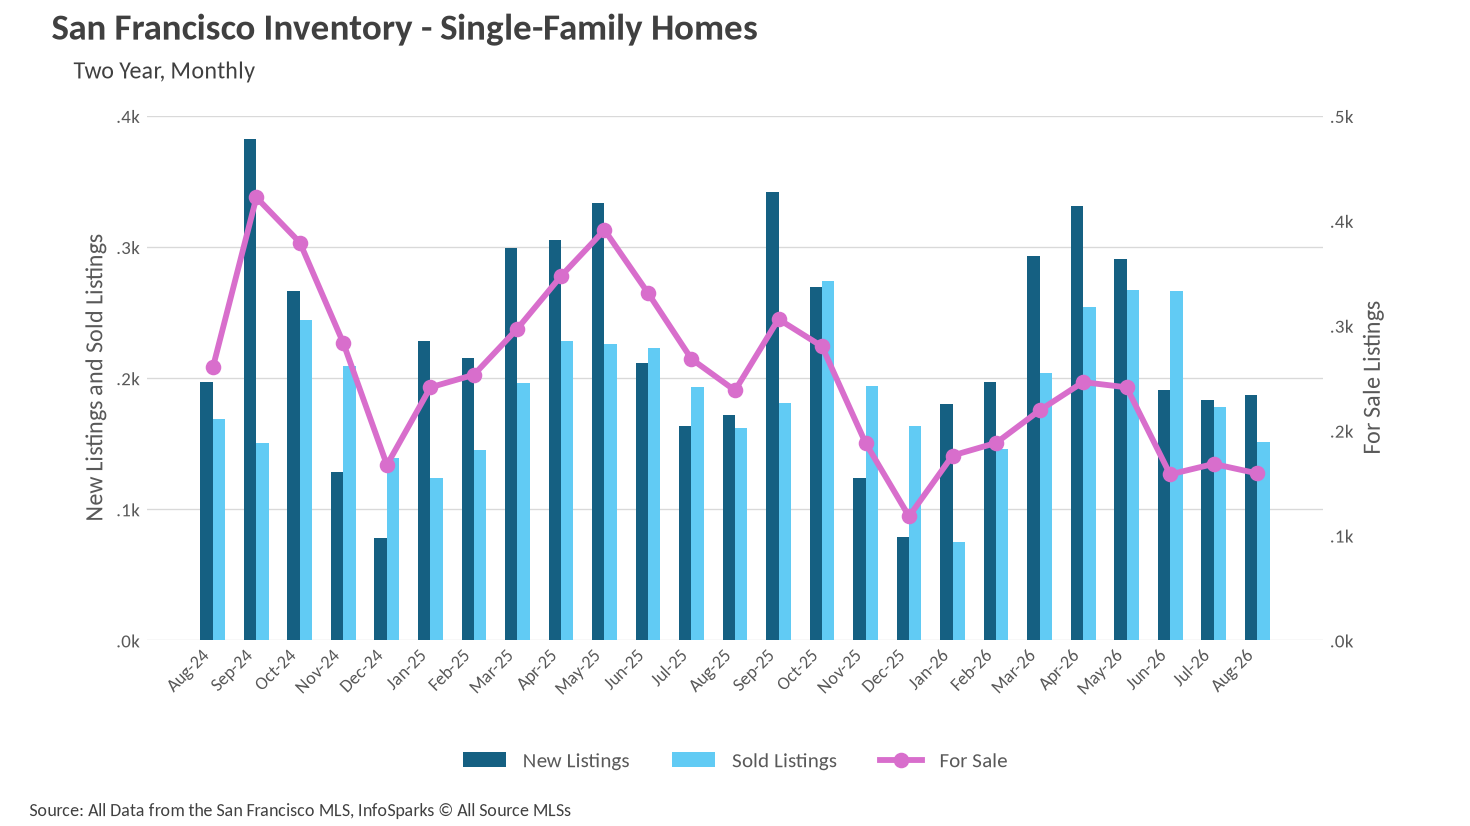
The most recent inventory reading, for August 2026, shows no relief for buyers. There were just 159 single-family homes for sale citywide at month's end, down 5.36% from July's 168 and down 33.19% from the 238 available in August 2025. What makes the figure notable is that sellers actually showed up: 187 new single-family listings hit the market in August, an 8.72% increase over last August's 172. Buyers simply absorbed them faster than they arrived.

The condo picture is similar. Active condo listings fell to 348, a 7.20% decline from July and a 36.38% drop from the 547 units available a year ago. New condo listings rose 15.84% year-over-year to 256, and closed condo sales jumped 14.81% to 186, meaning the additional supply was more than met by demand. With only about 507 homes and condos available across the entire city, San Francisco's total for-sale inventory remains at a fraction of where it stood in the summer of 2024, when more than 900 properties were on the market in August alone.

Condos have caught up to the single-family pace
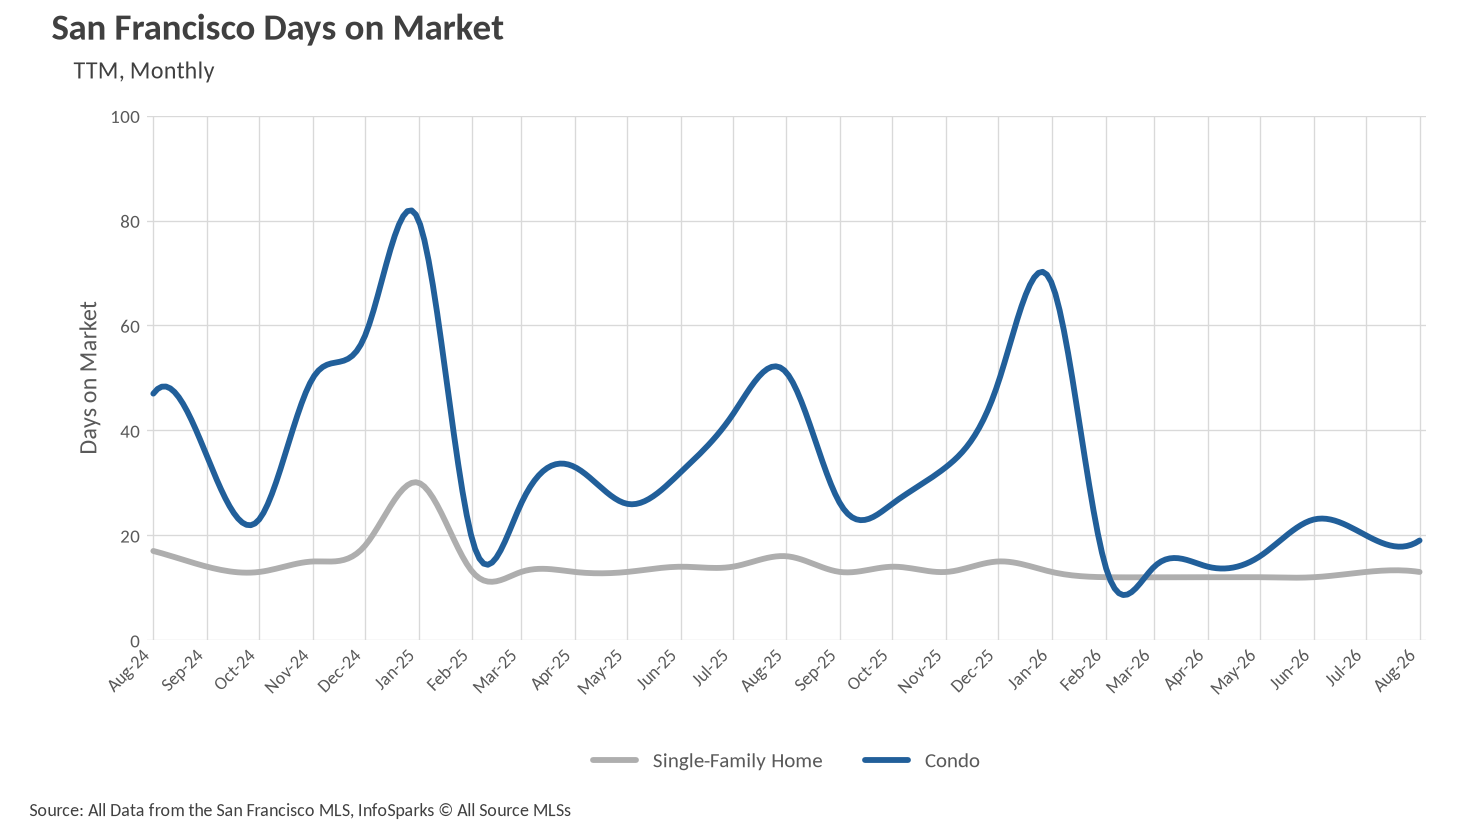
Single-family homes continue to move almost as quickly as they can be listed, spending an average of 13 days on market in August. That is a 18.75% improvement over the 16 days recorded last August, and it holds the tight 12-to-13 day band the segment has occupied all year.

The more dramatic shift is in the condo market. Condos sold in an average of 19 days in August, down from 20 days in July and down a remarkable 62.75% from the 51 days they required in August 2025. A year ago, condo sellers faced a late-summer slowdown that stretched marketing times past seven weeks. This August, they faced nothing of the kind. The gap between the two property types, which once ran five weeks or more, has narrowed to less than a week, a sign that the condo segment has genuinely re-engaged rather than simply benefiting from a quiet single-family market.
San Francisco remains a decisively seller-favored market
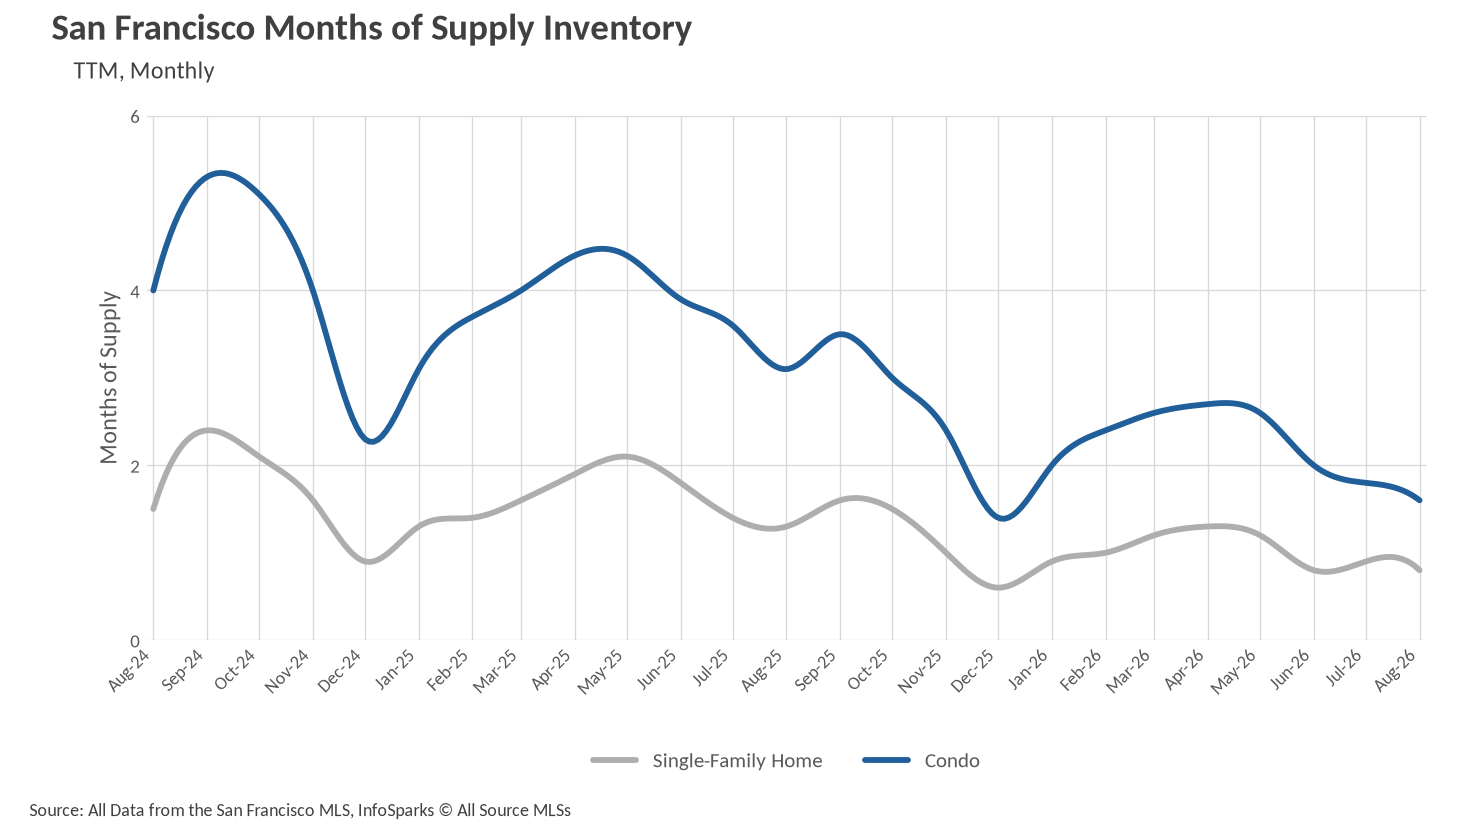
When determining whether a market is a buyers’ market or a sellers’ market, we look to the Months of Supply Inventory (MSI) metric. The state of California has historically averaged around three months of MSI, so any area with at or around three months of MSI is considered a balanced market. Any market that has lower than three months of MSI is considered a seller’s market, whereas markets with more than three months of MSI are considered buyers’ markets.

San Francisco sits far below that three-month threshold on both sides of the market. Single-family MSI registered 0.8 months in August, down from 0.9 in July and 38.46% below the 1.3 months recorded last August. At the current sales pace, the city's entire single-family inventory would be exhausted in roughly 24 days. The condo segment, which was essentially balanced at 3.1 months a year ago, has tightened to 1.6 months, a 48.39% year-over-year decline and its lowest reading since last December. That transition is the single most important structural change in this market over the past twelve months: condos are no longer the buyer-friendly alternative they were in 2024 and early 2025. With supply shrinking in both segments despite rising new listings, sellers retain the clear advantage heading into the fall.

Local Lowdown Data

ActivePipe Message ID: 4059810

Let’s Talk

You’ve got questions and we can’t wait to answer them.