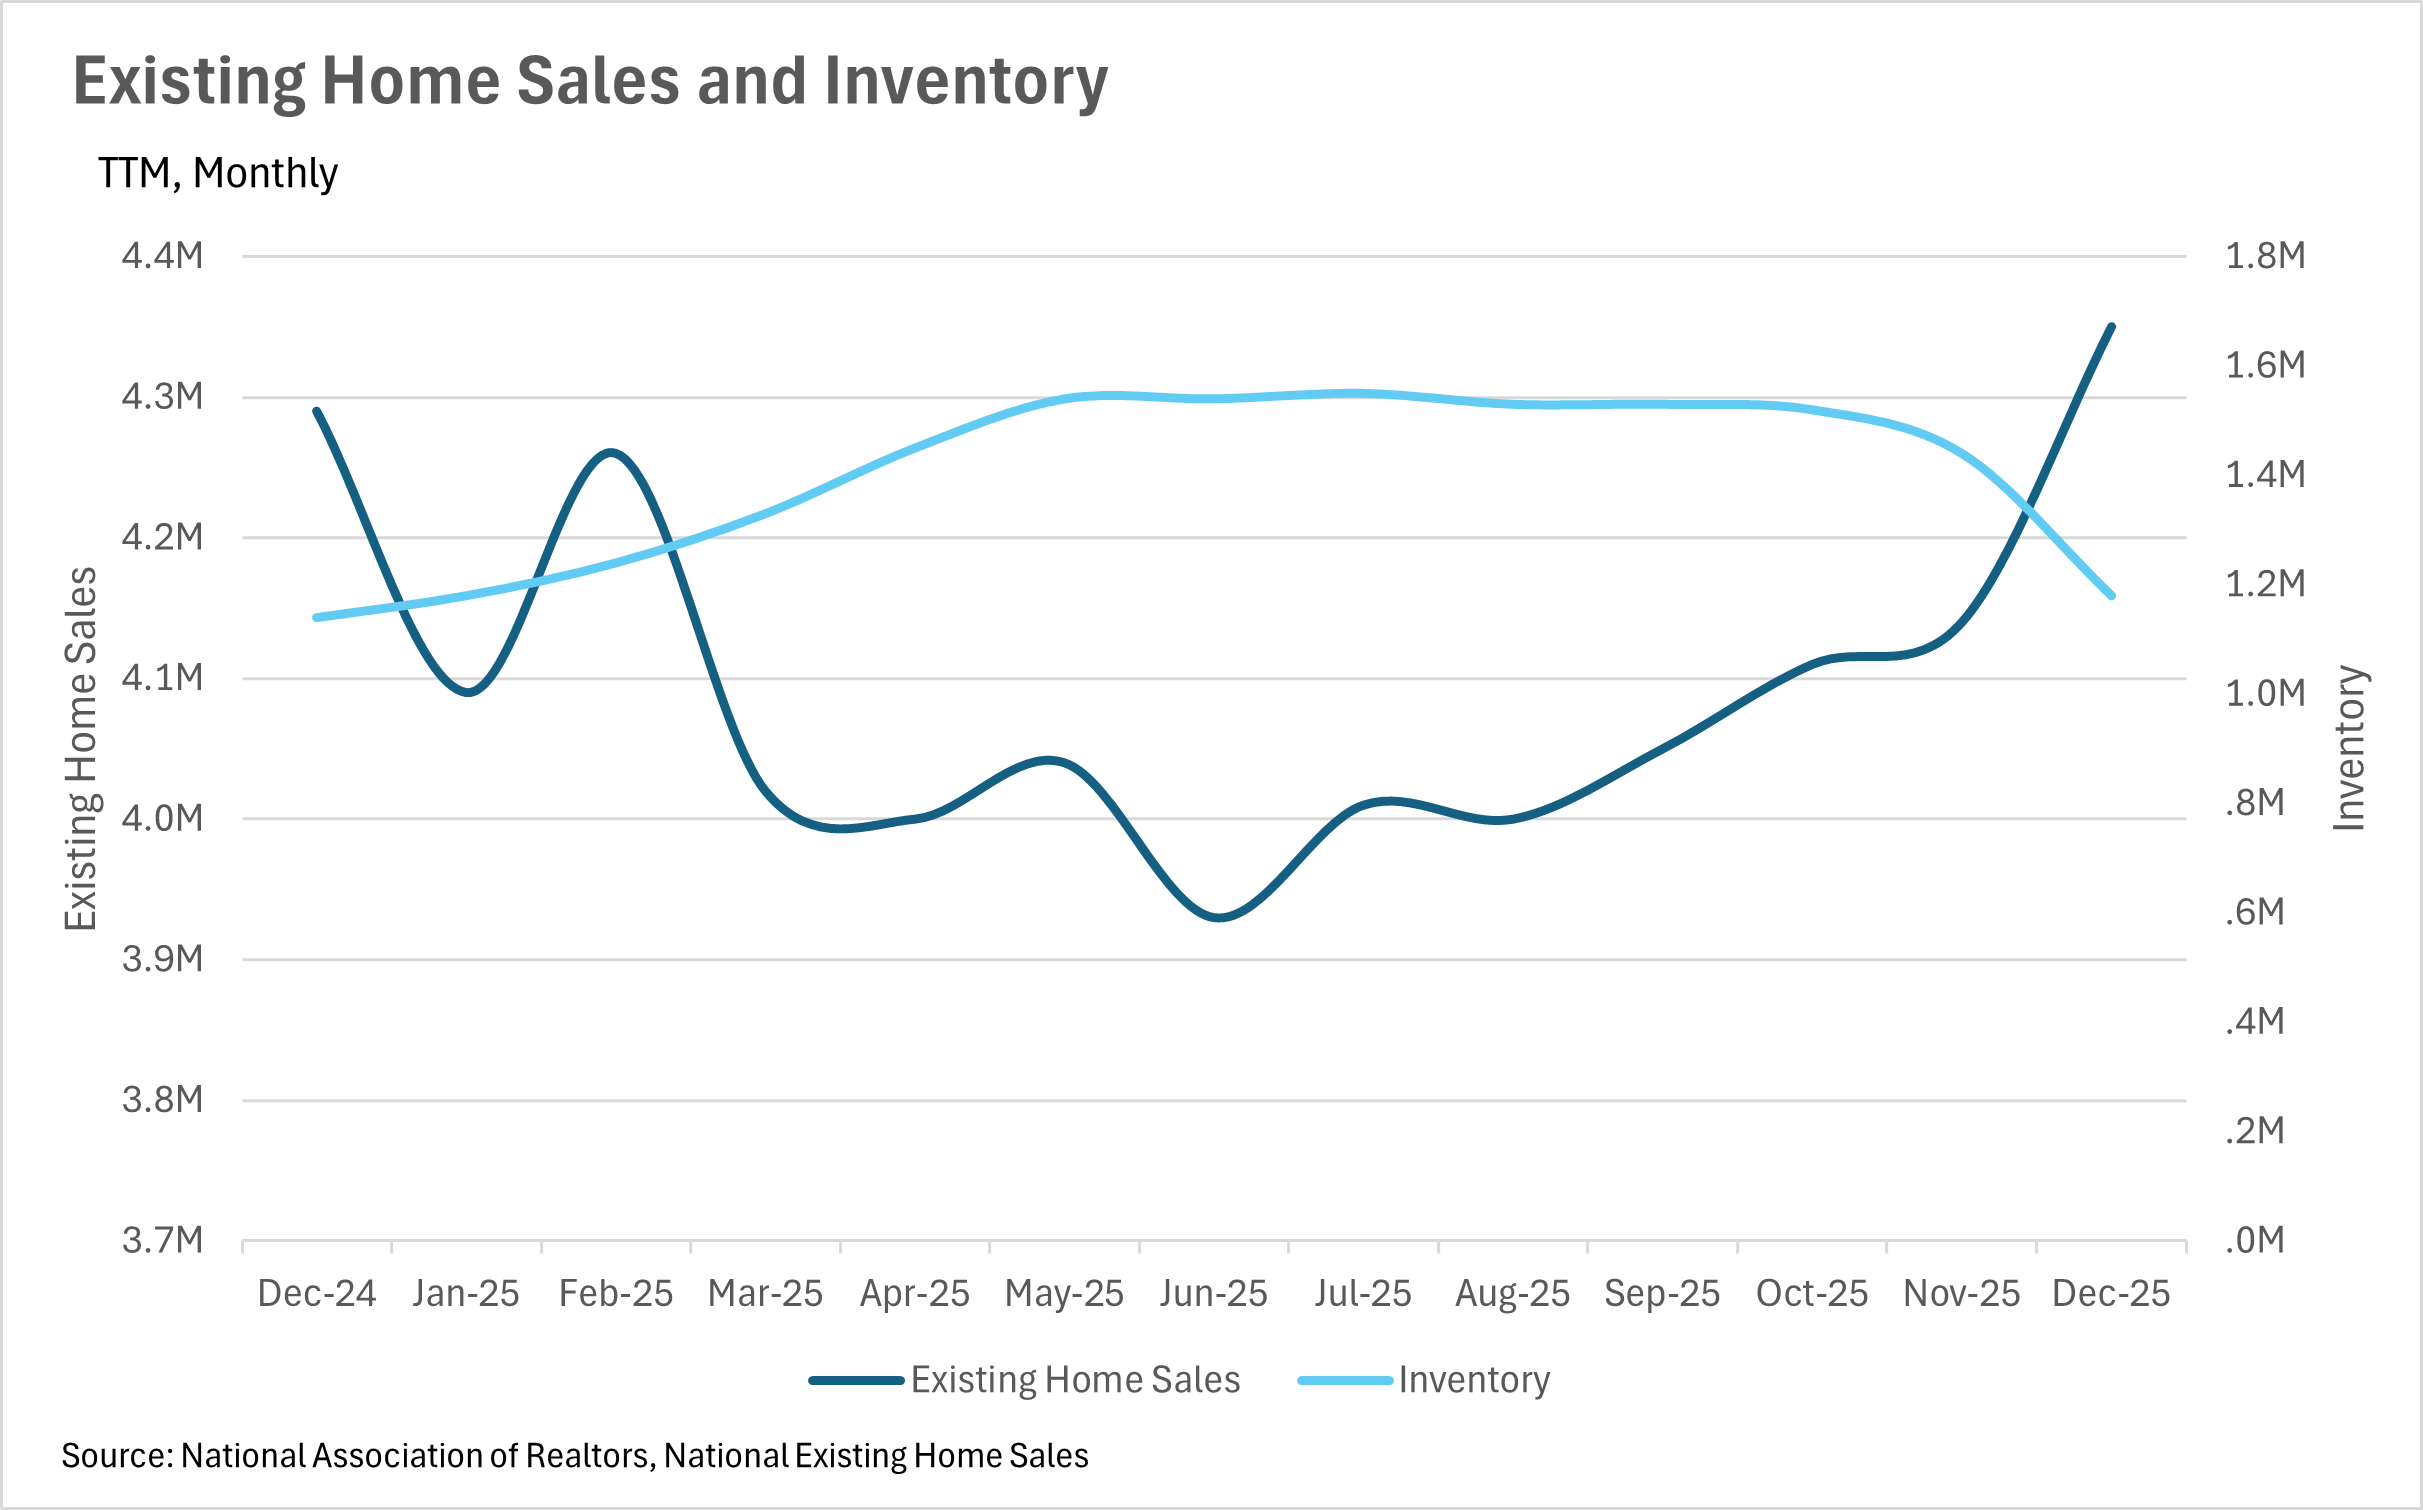
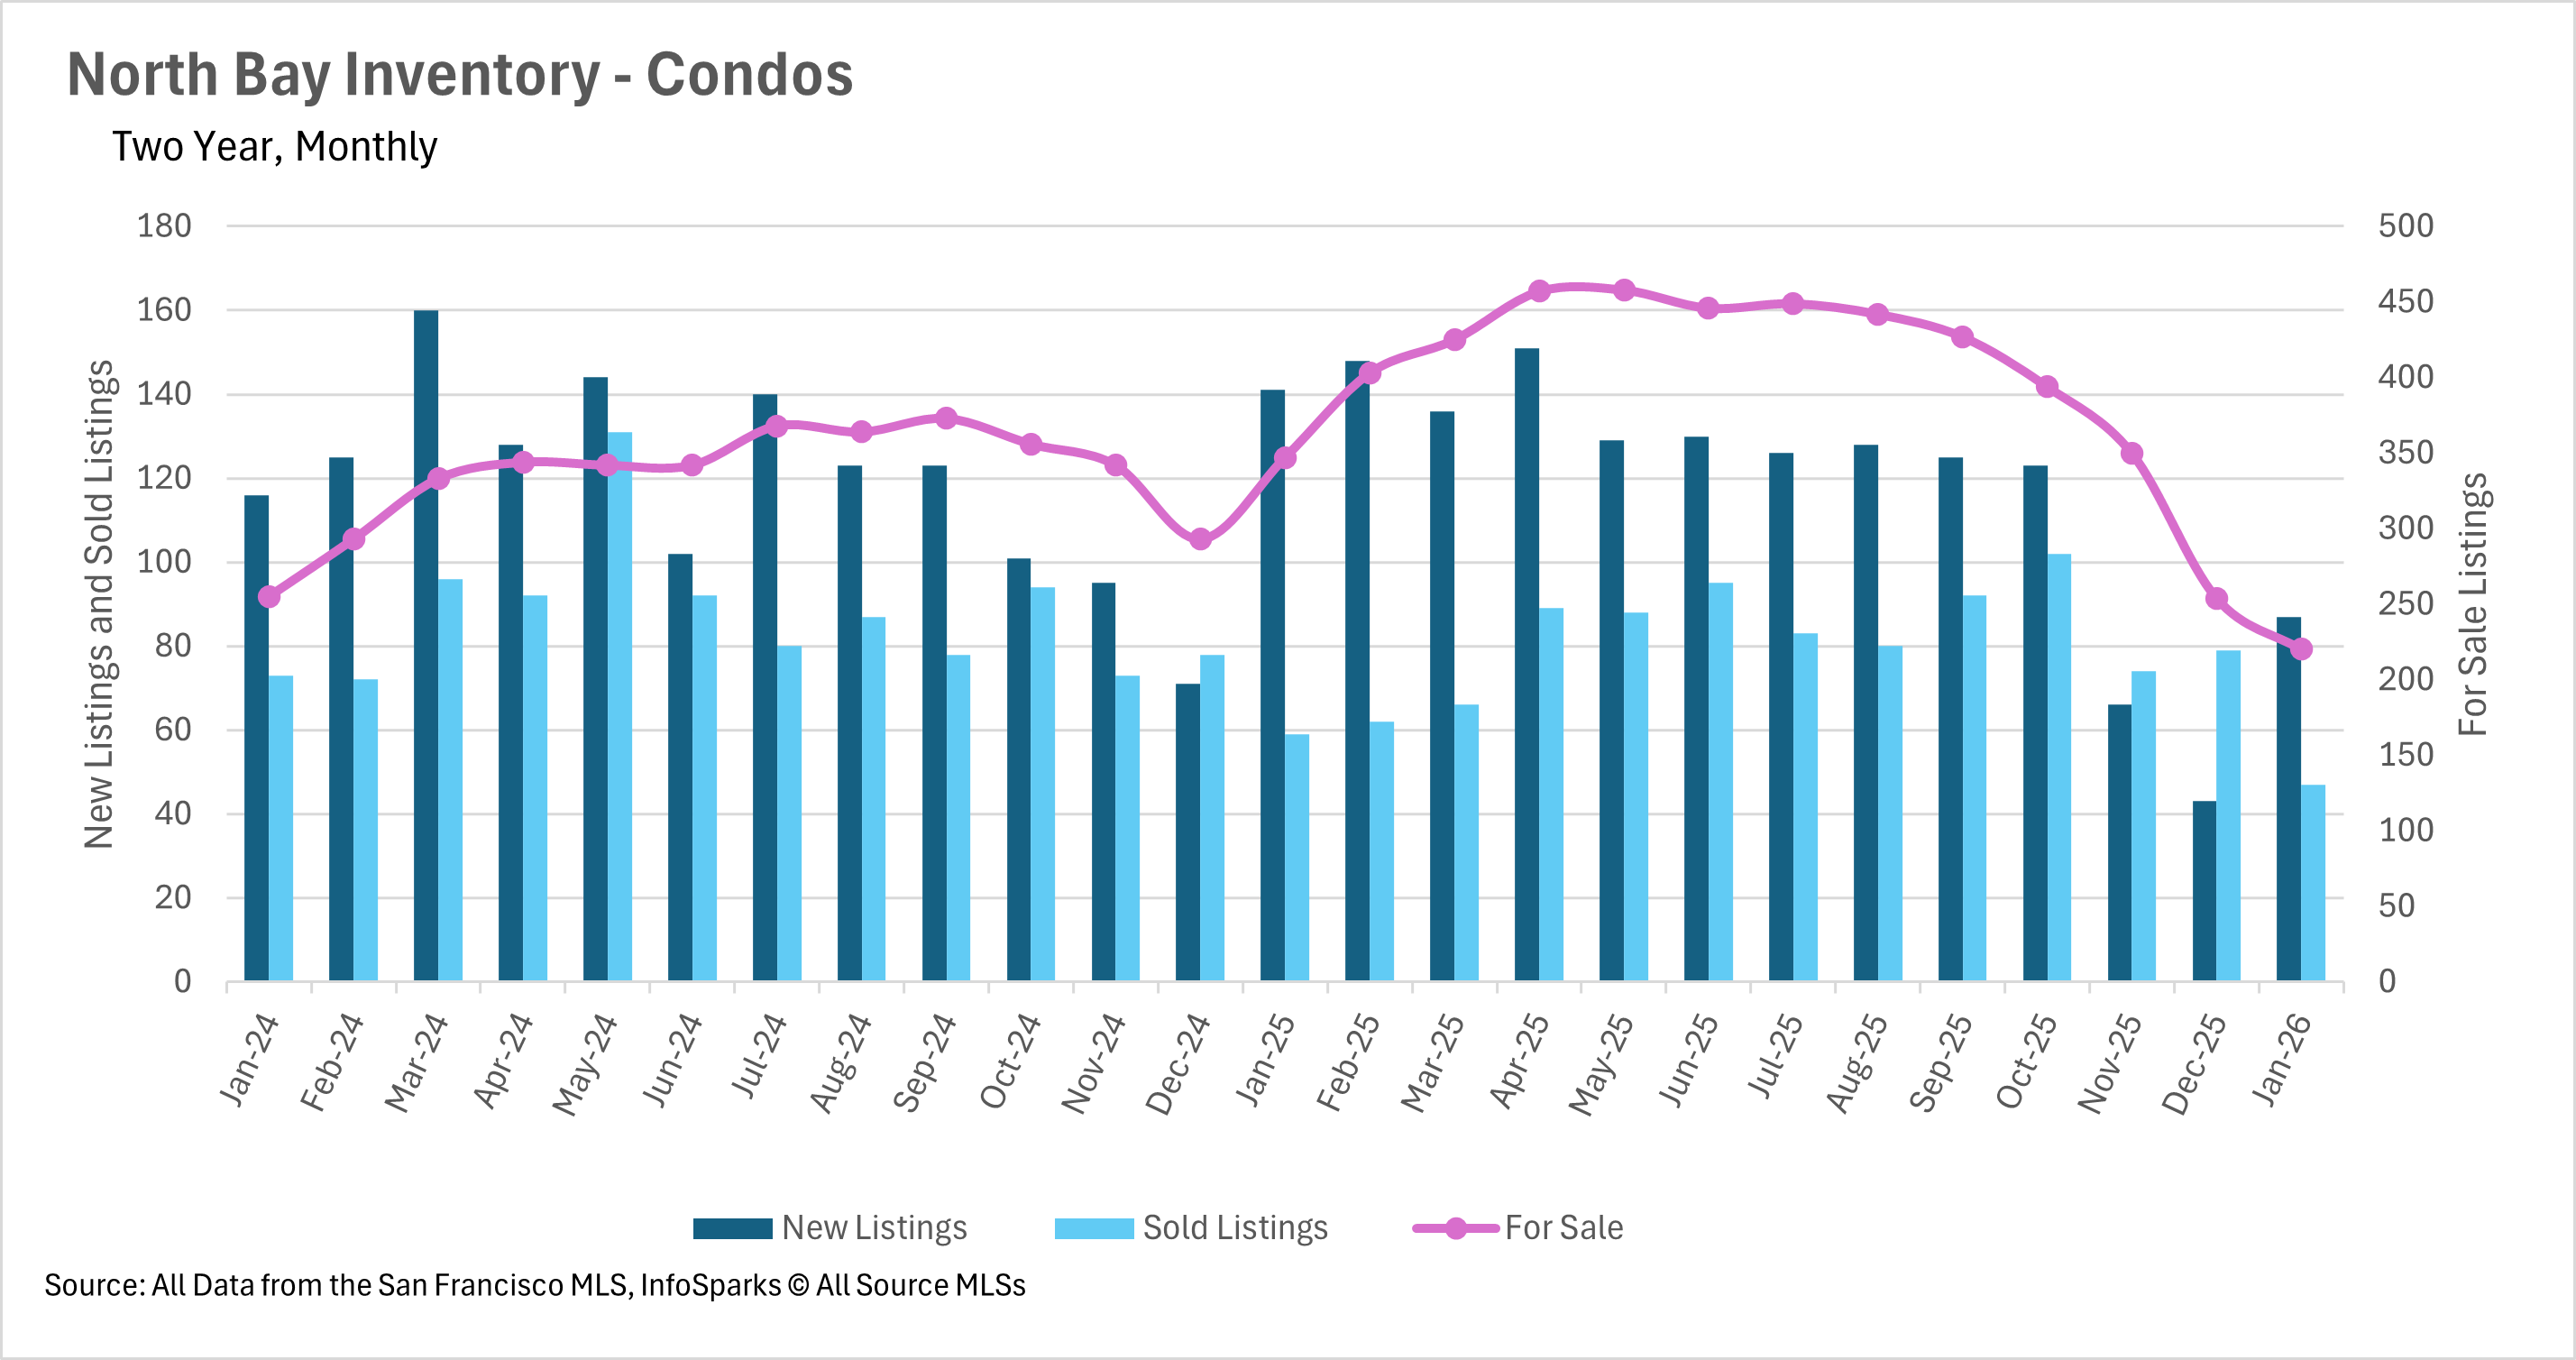
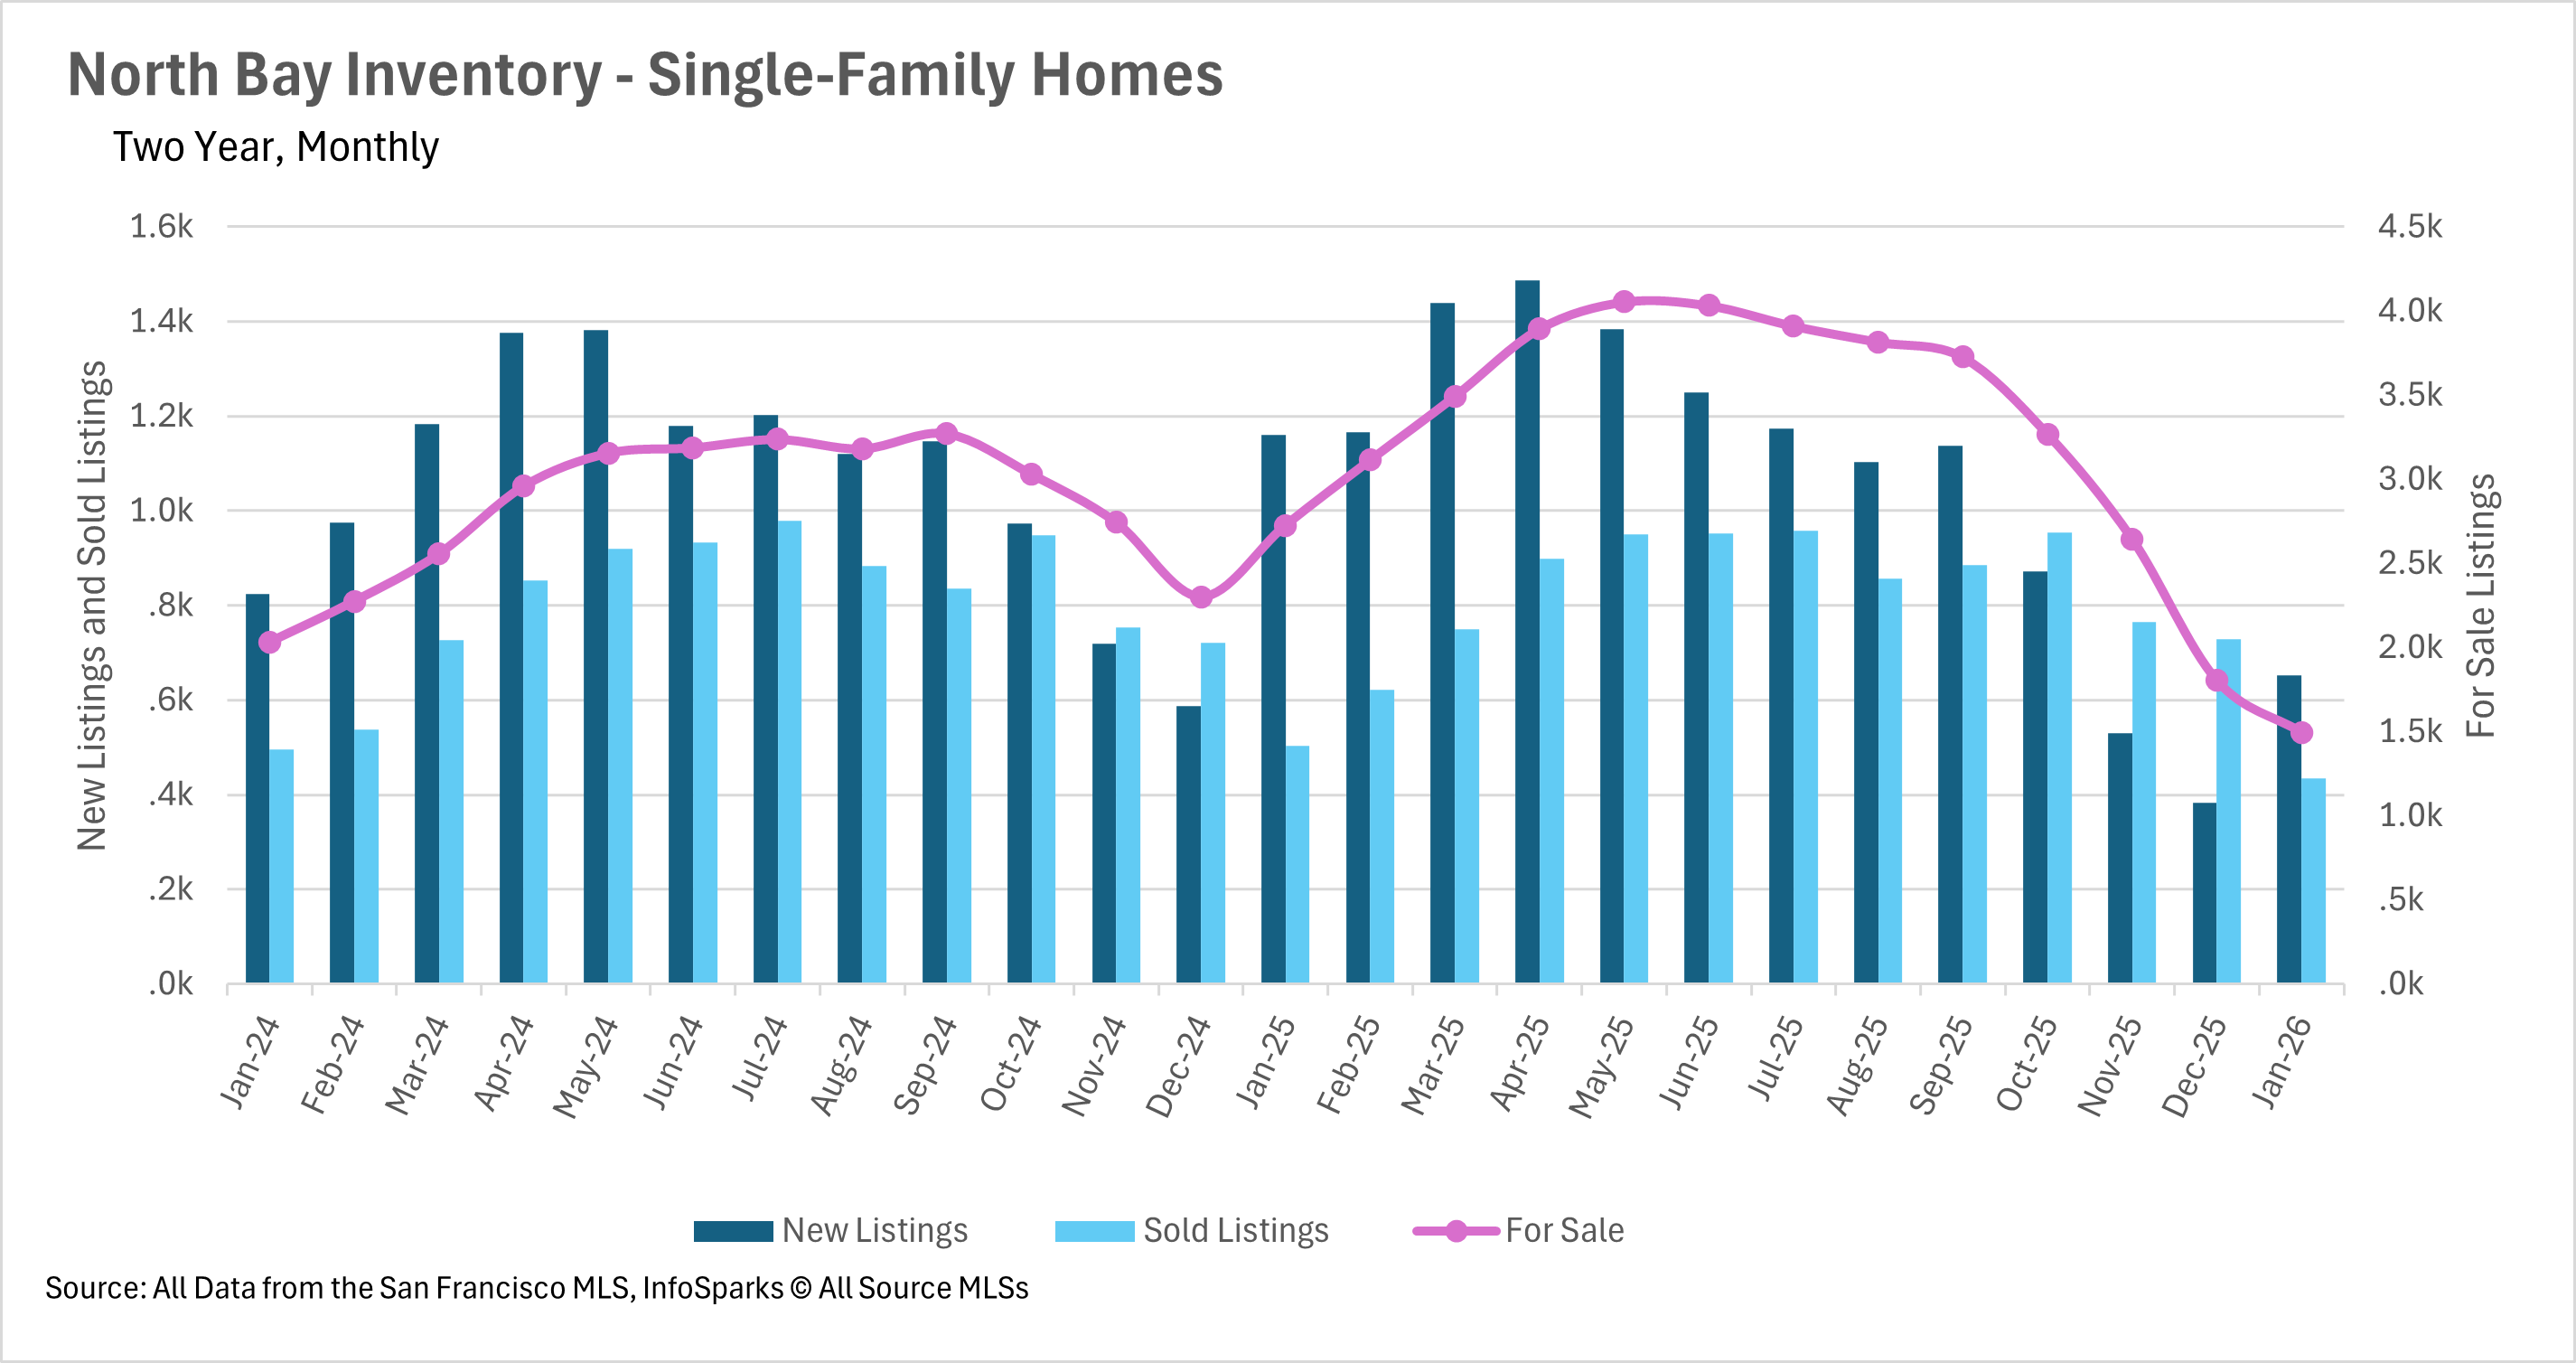
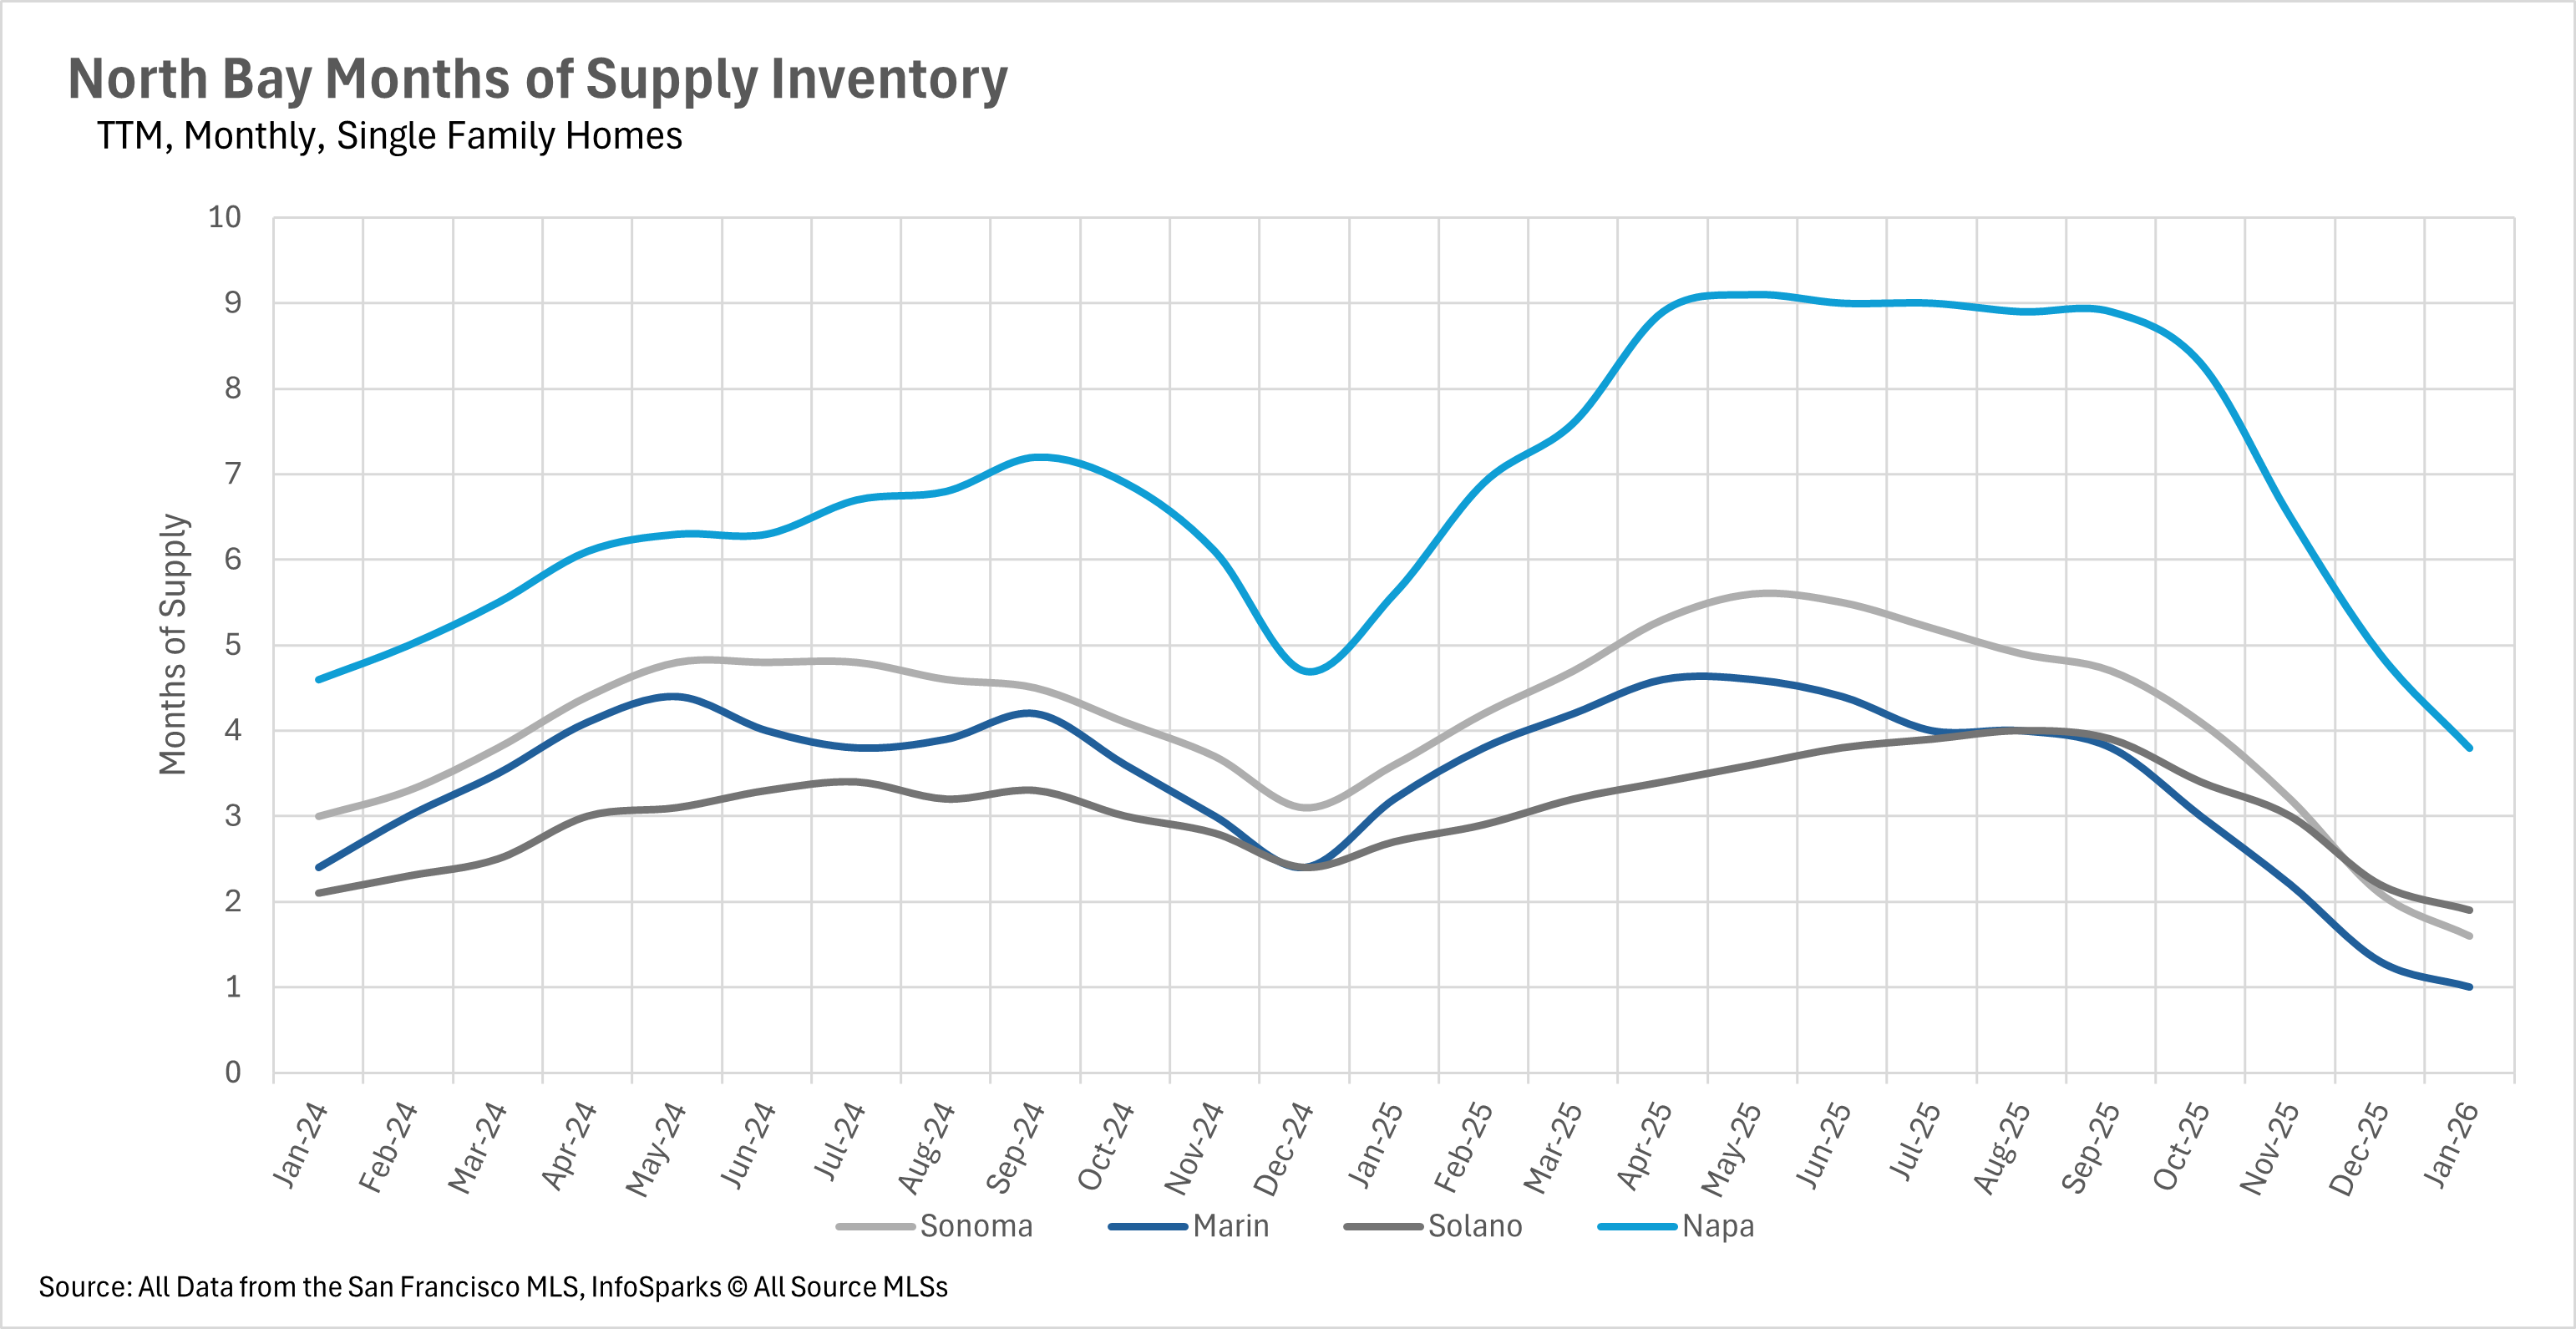
Inventory and sale metrics are roughly in line with what we were seeing around this time last year.

|
|
|
|
|
|
|
|
|
|
|
|
|
|
|
|
|
|
|
|
|
|
|
|
|
|
|
|
|
|
|
|
|
|
|
|
|
Stay up to date on the latest real estate trends.


You’ve got questions and we can’t wait to answer them.