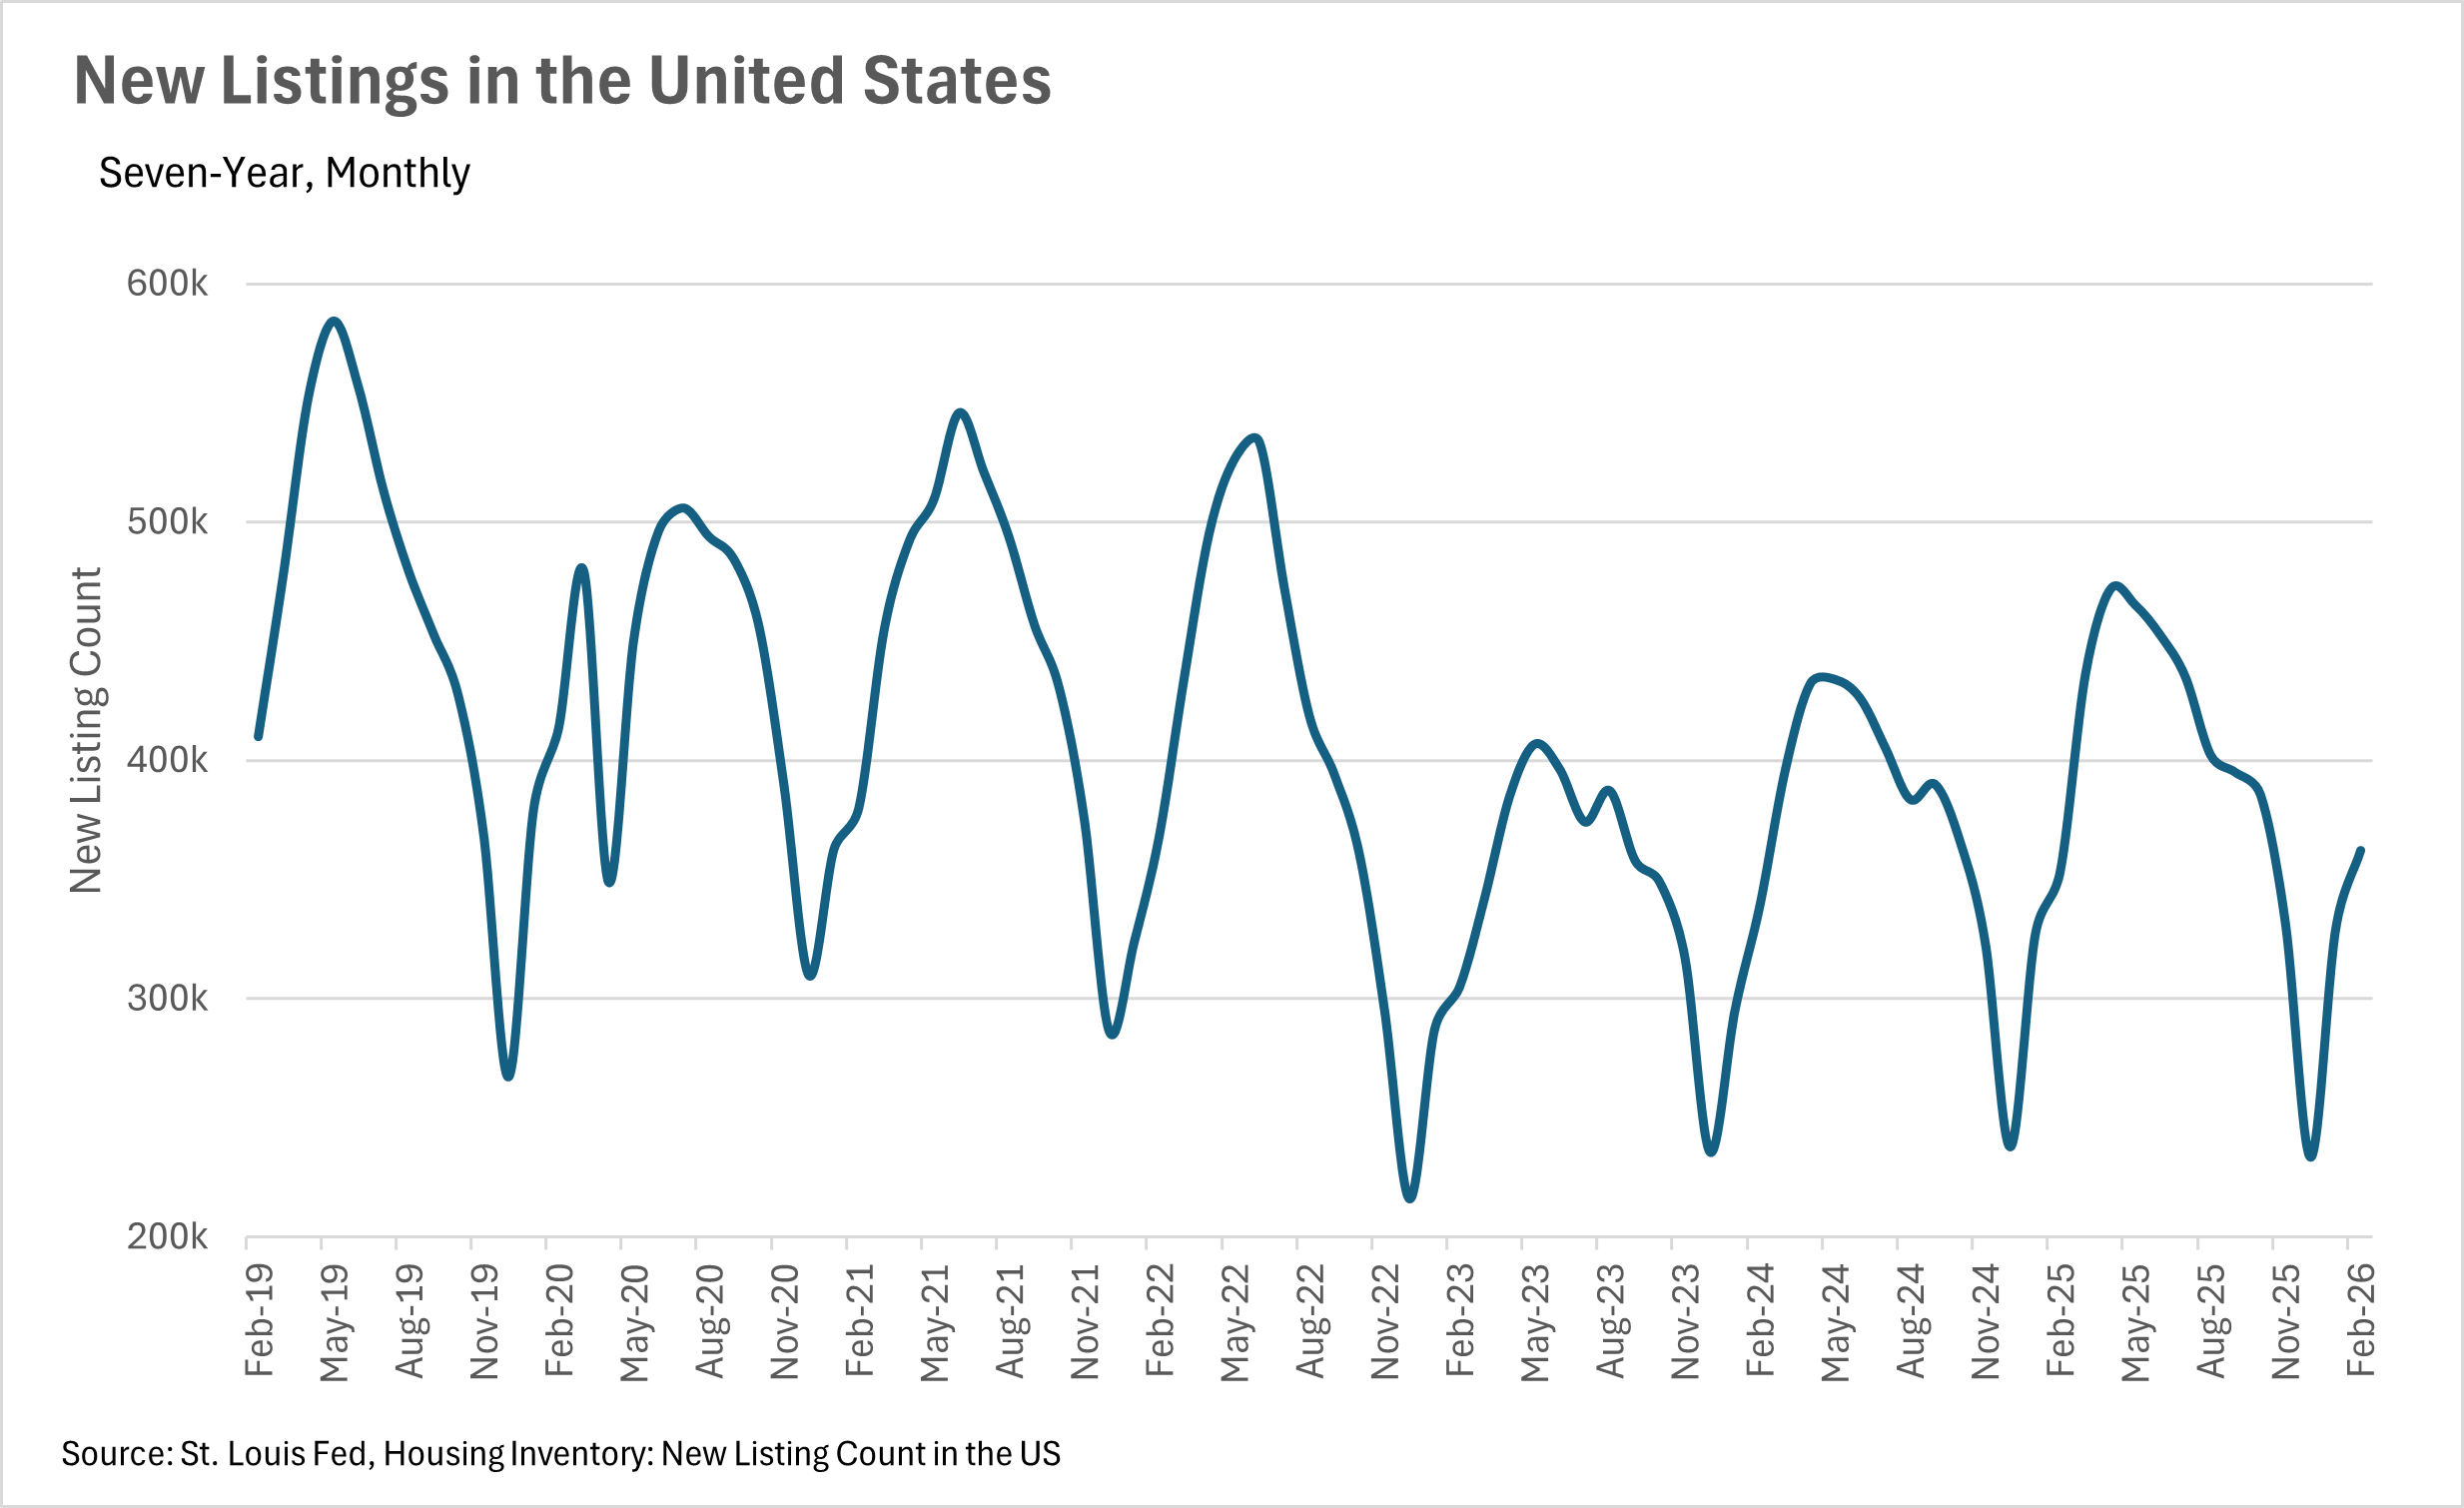
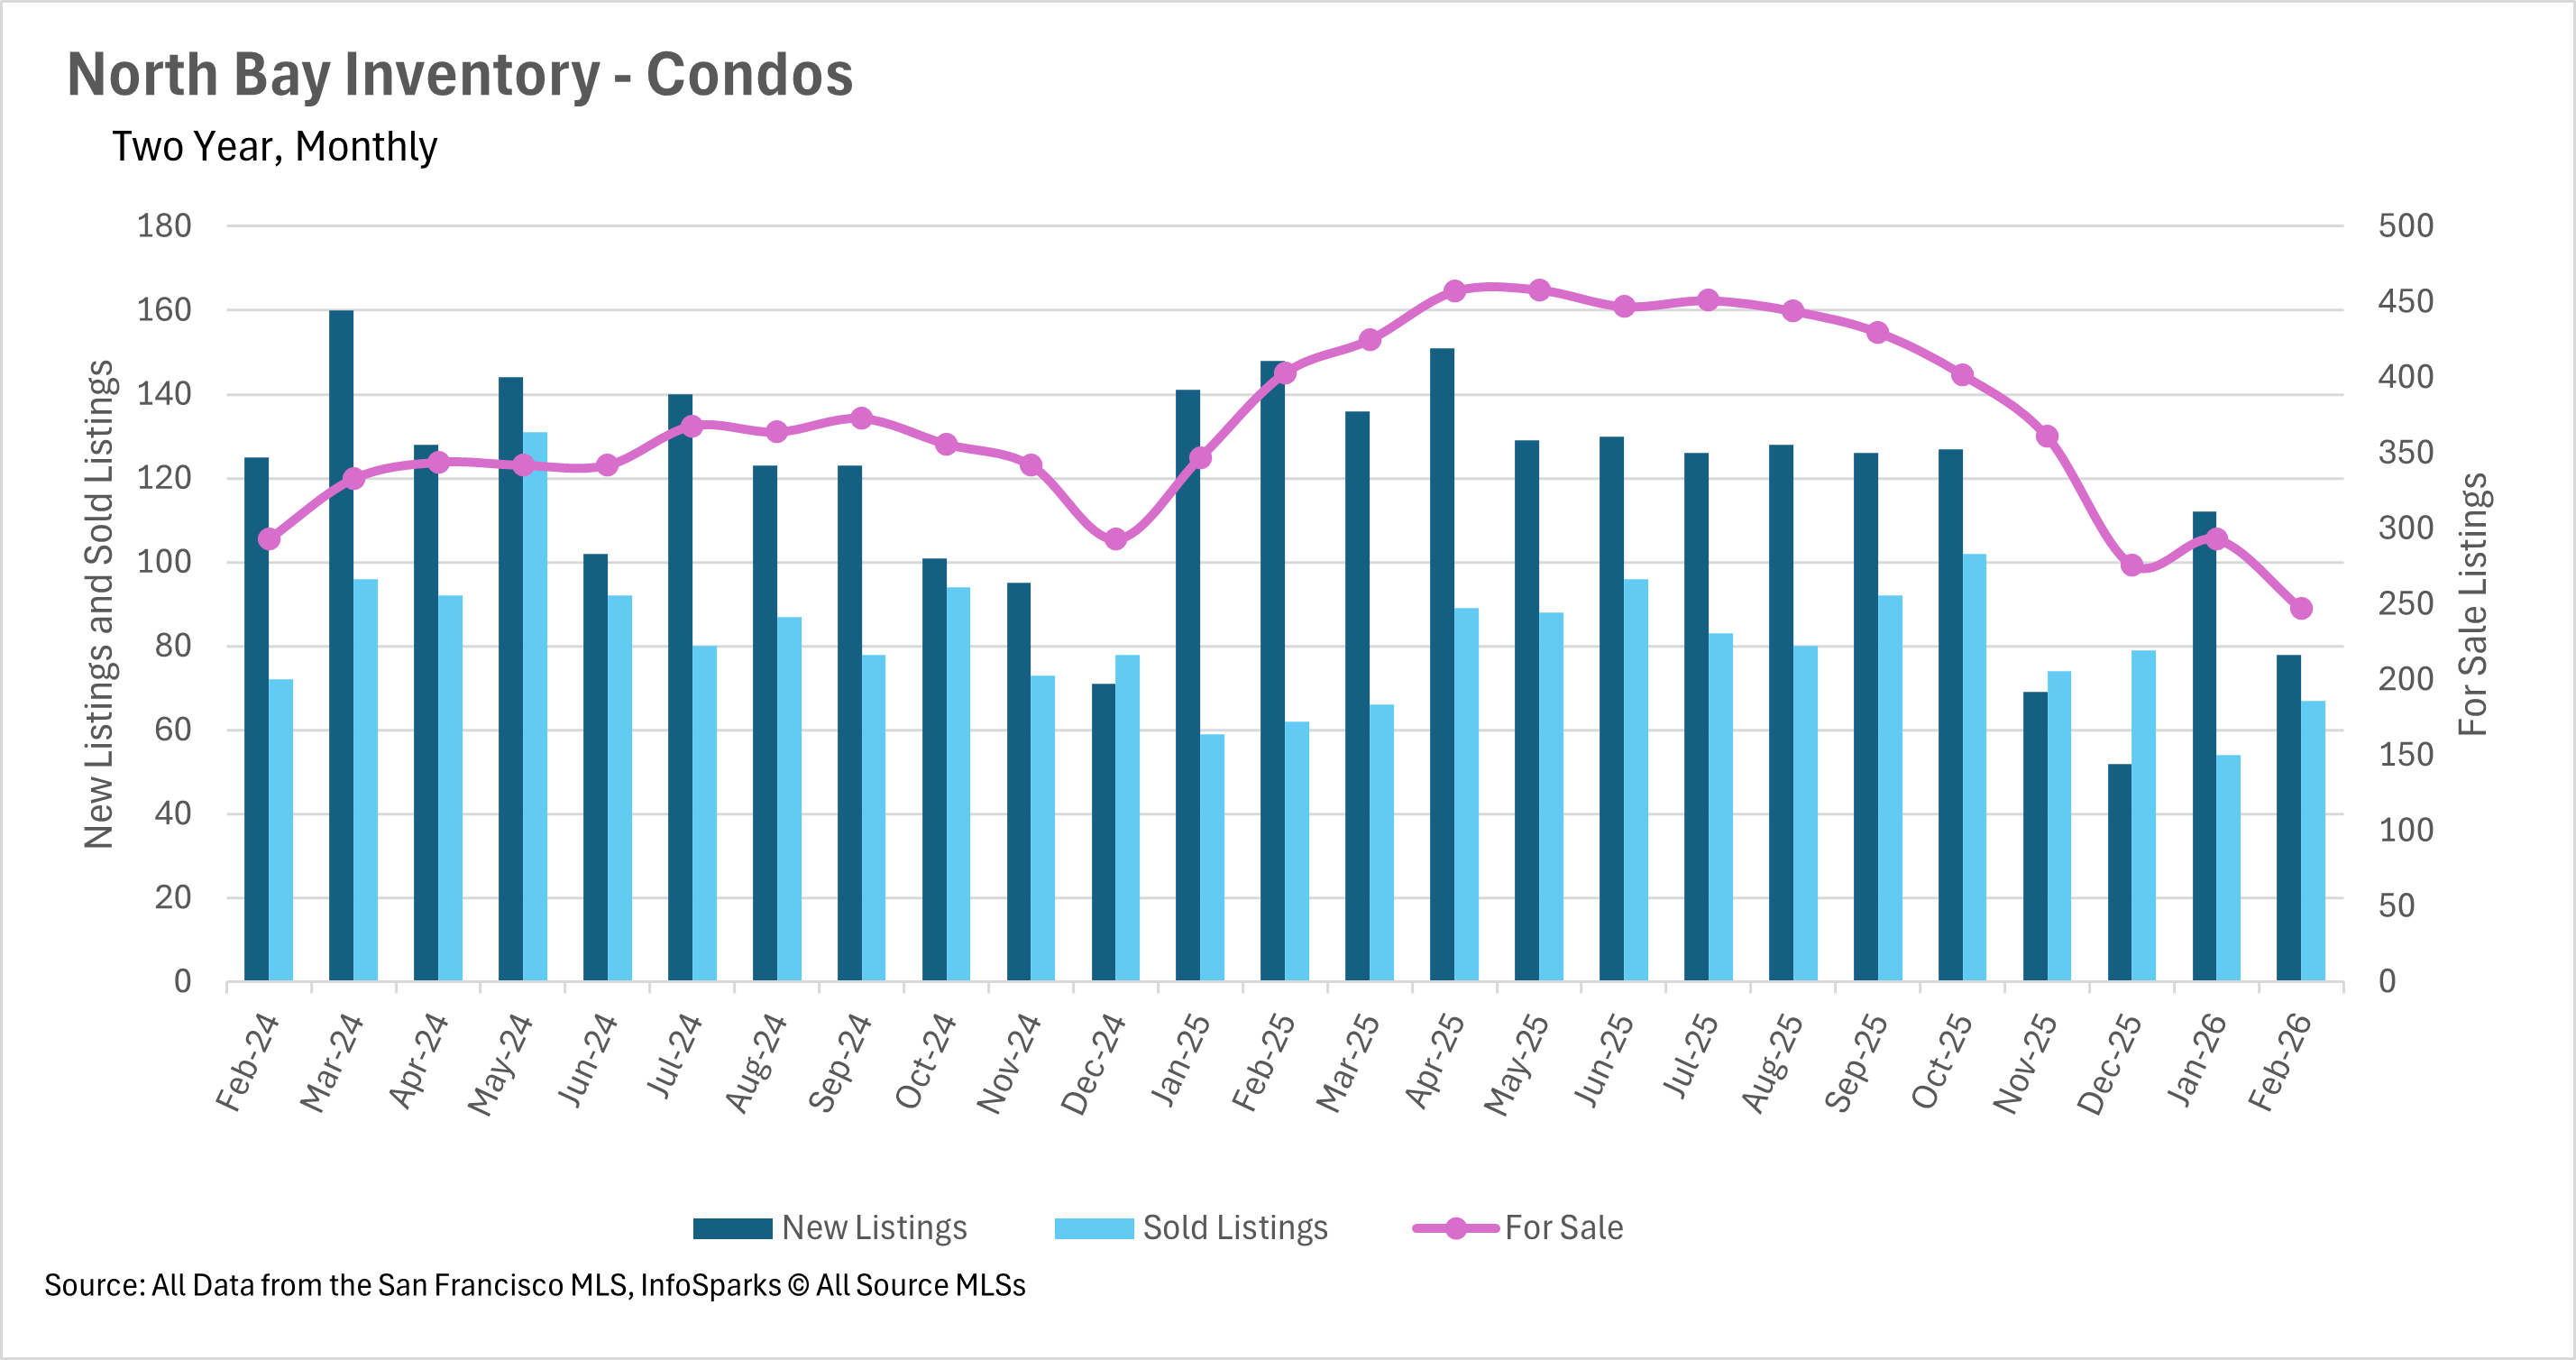
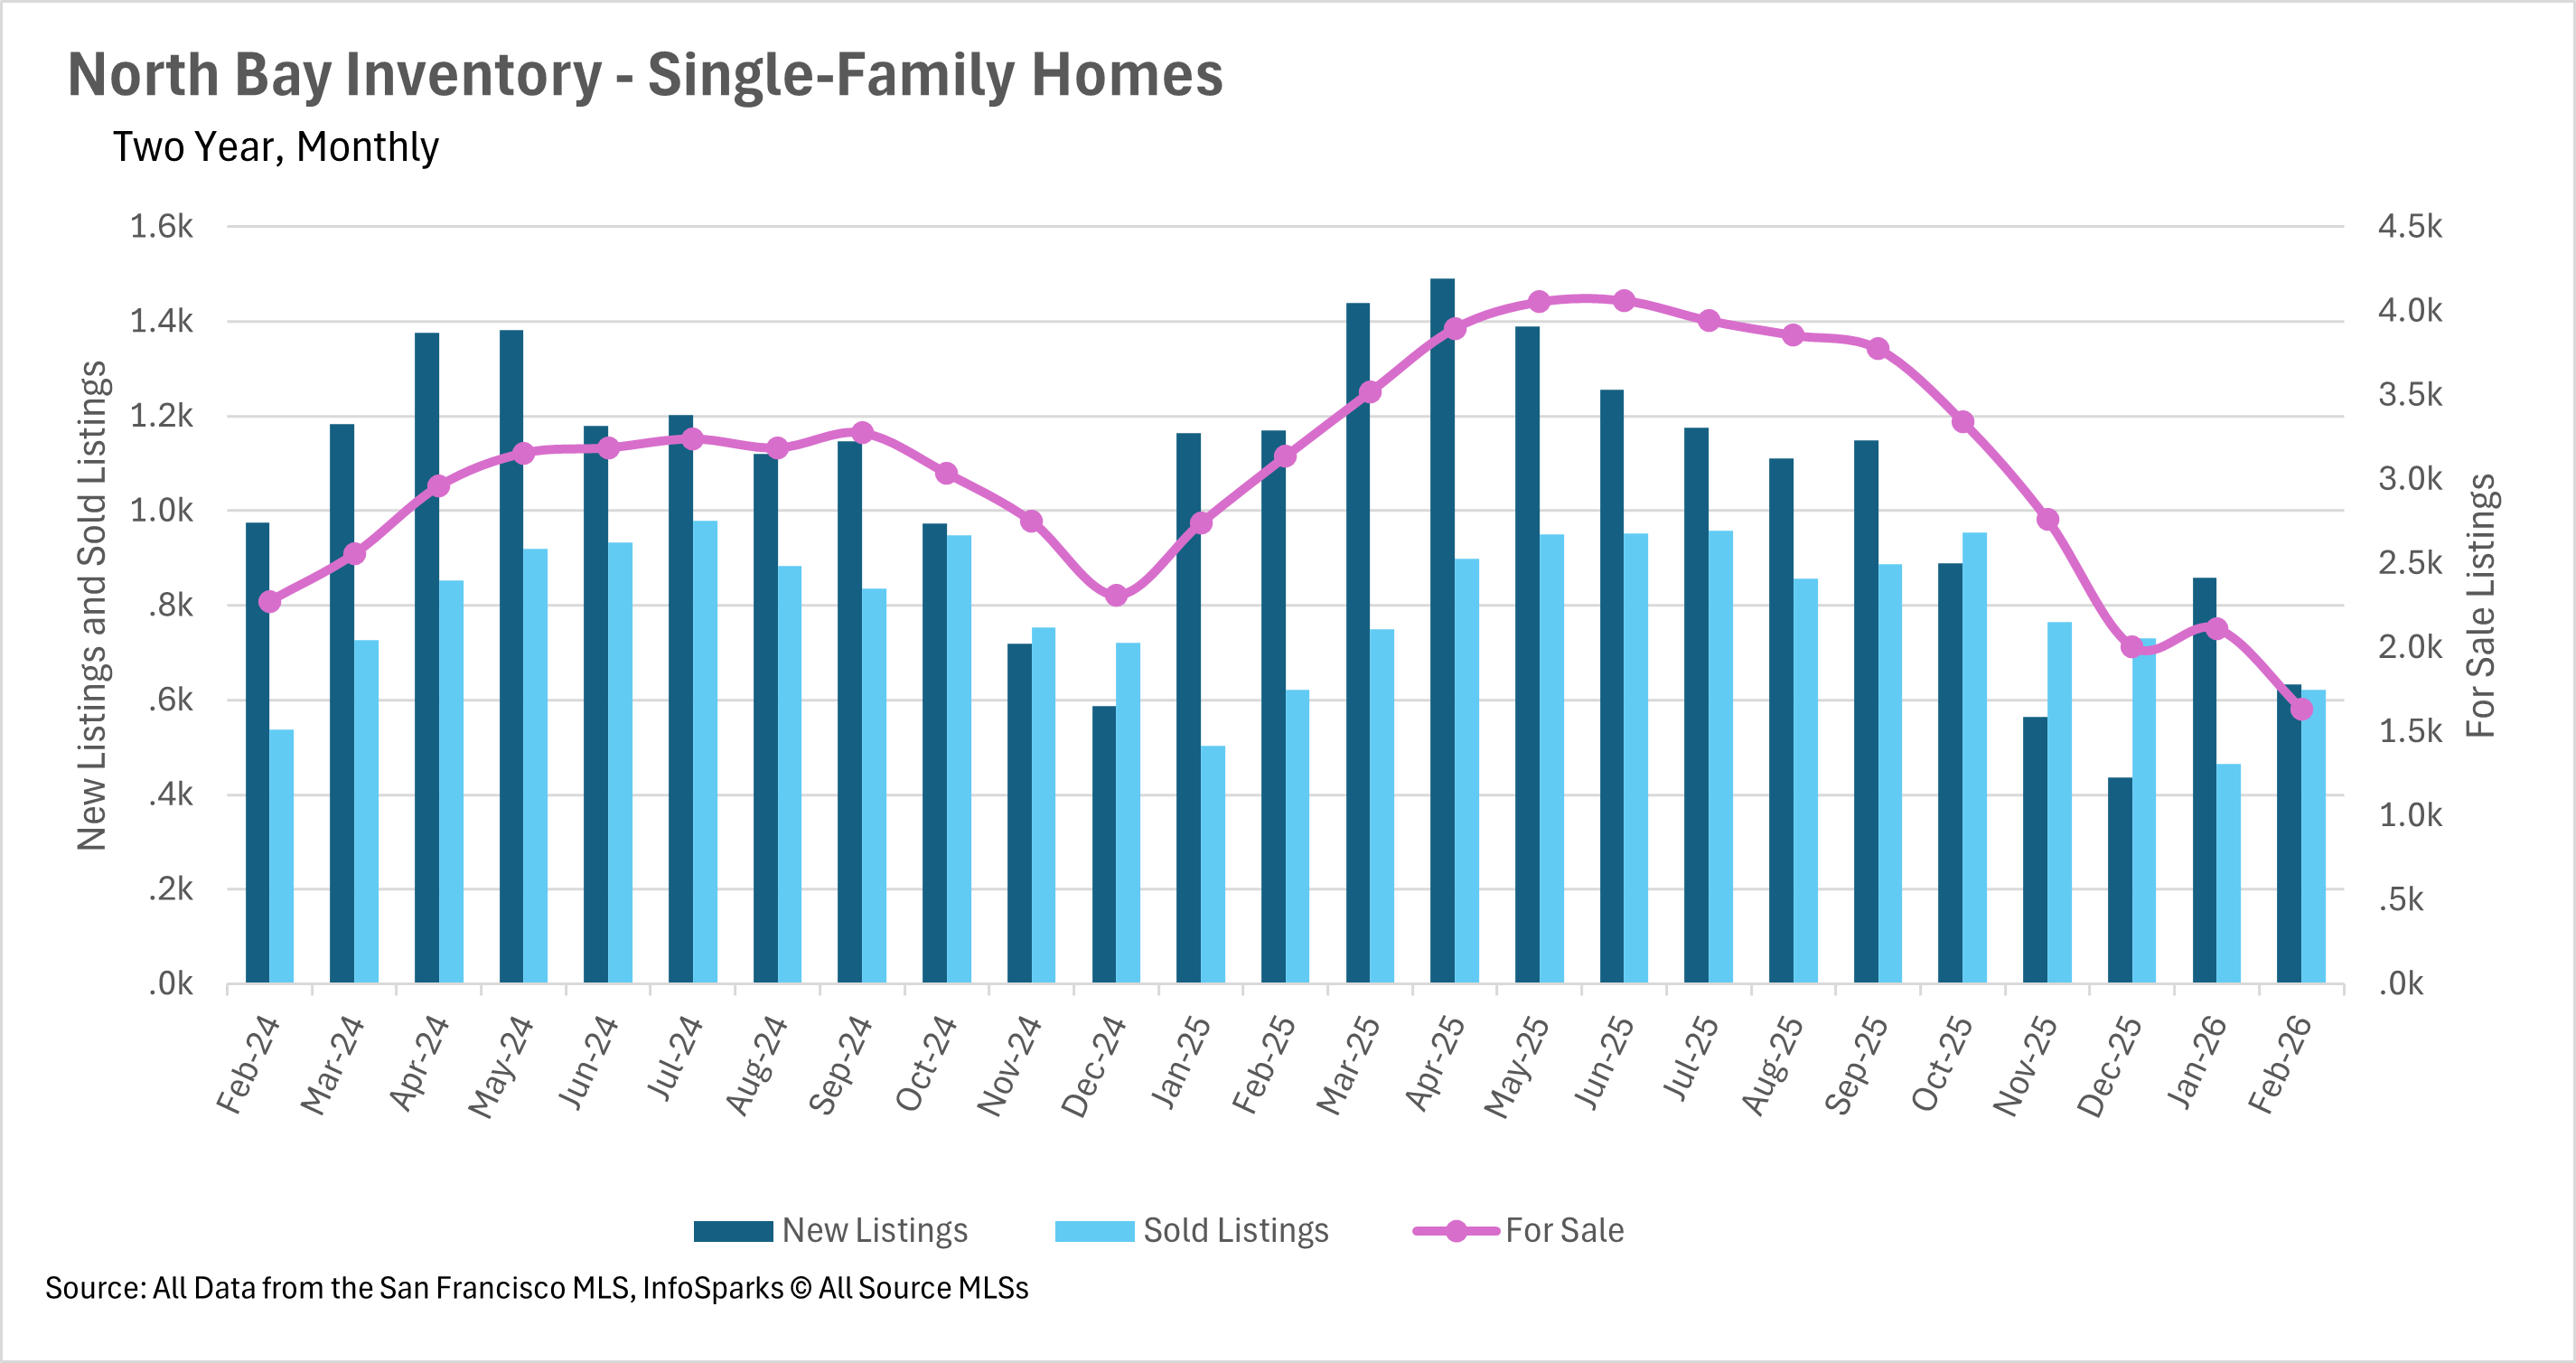
New listings are ticking up as we head into the spring

|
|
|
|
|
|
|
|
|
|
|
|
|
|
|
|
|
|
|
|
|
|
|
|
|
|
|
|
|
|
|
|
|
|
|
|
|
Stay up to date on the latest real estate trends.


You’ve got questions and we can’t wait to answer them.