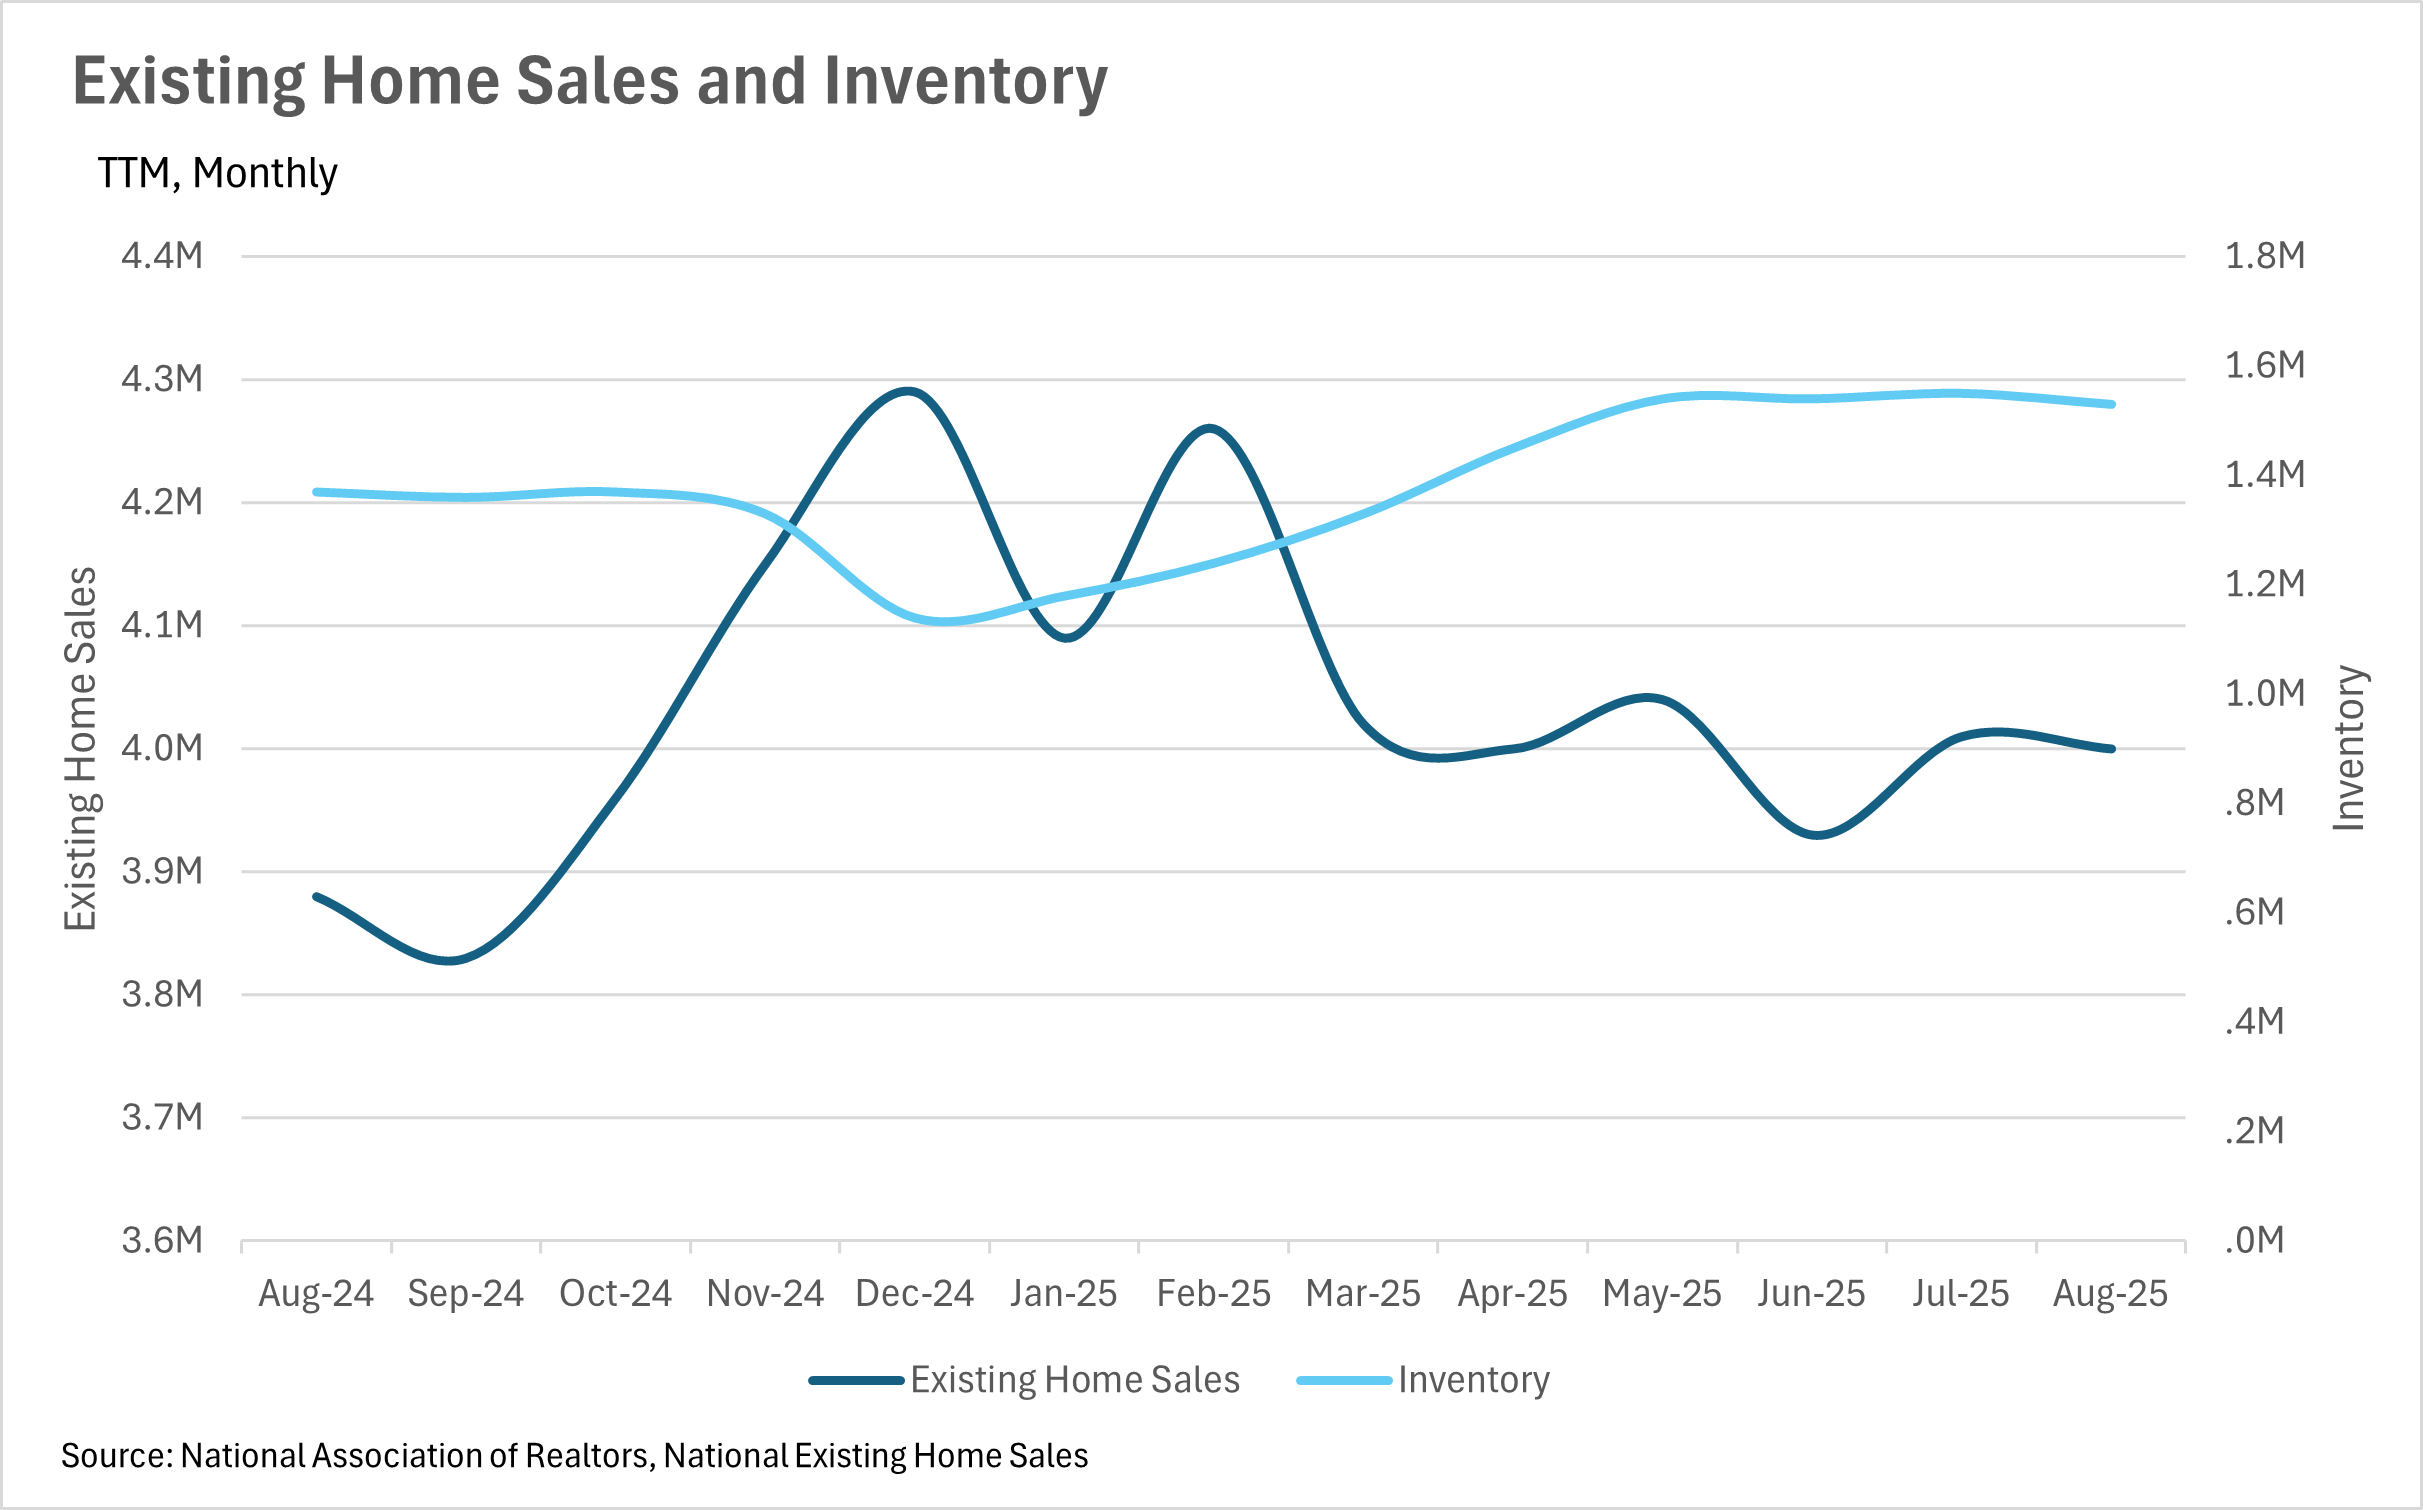
Inventories are still growing at a faster rate than existing home sales...

Greater Bay Area market update

The Big Story
Quick Take:
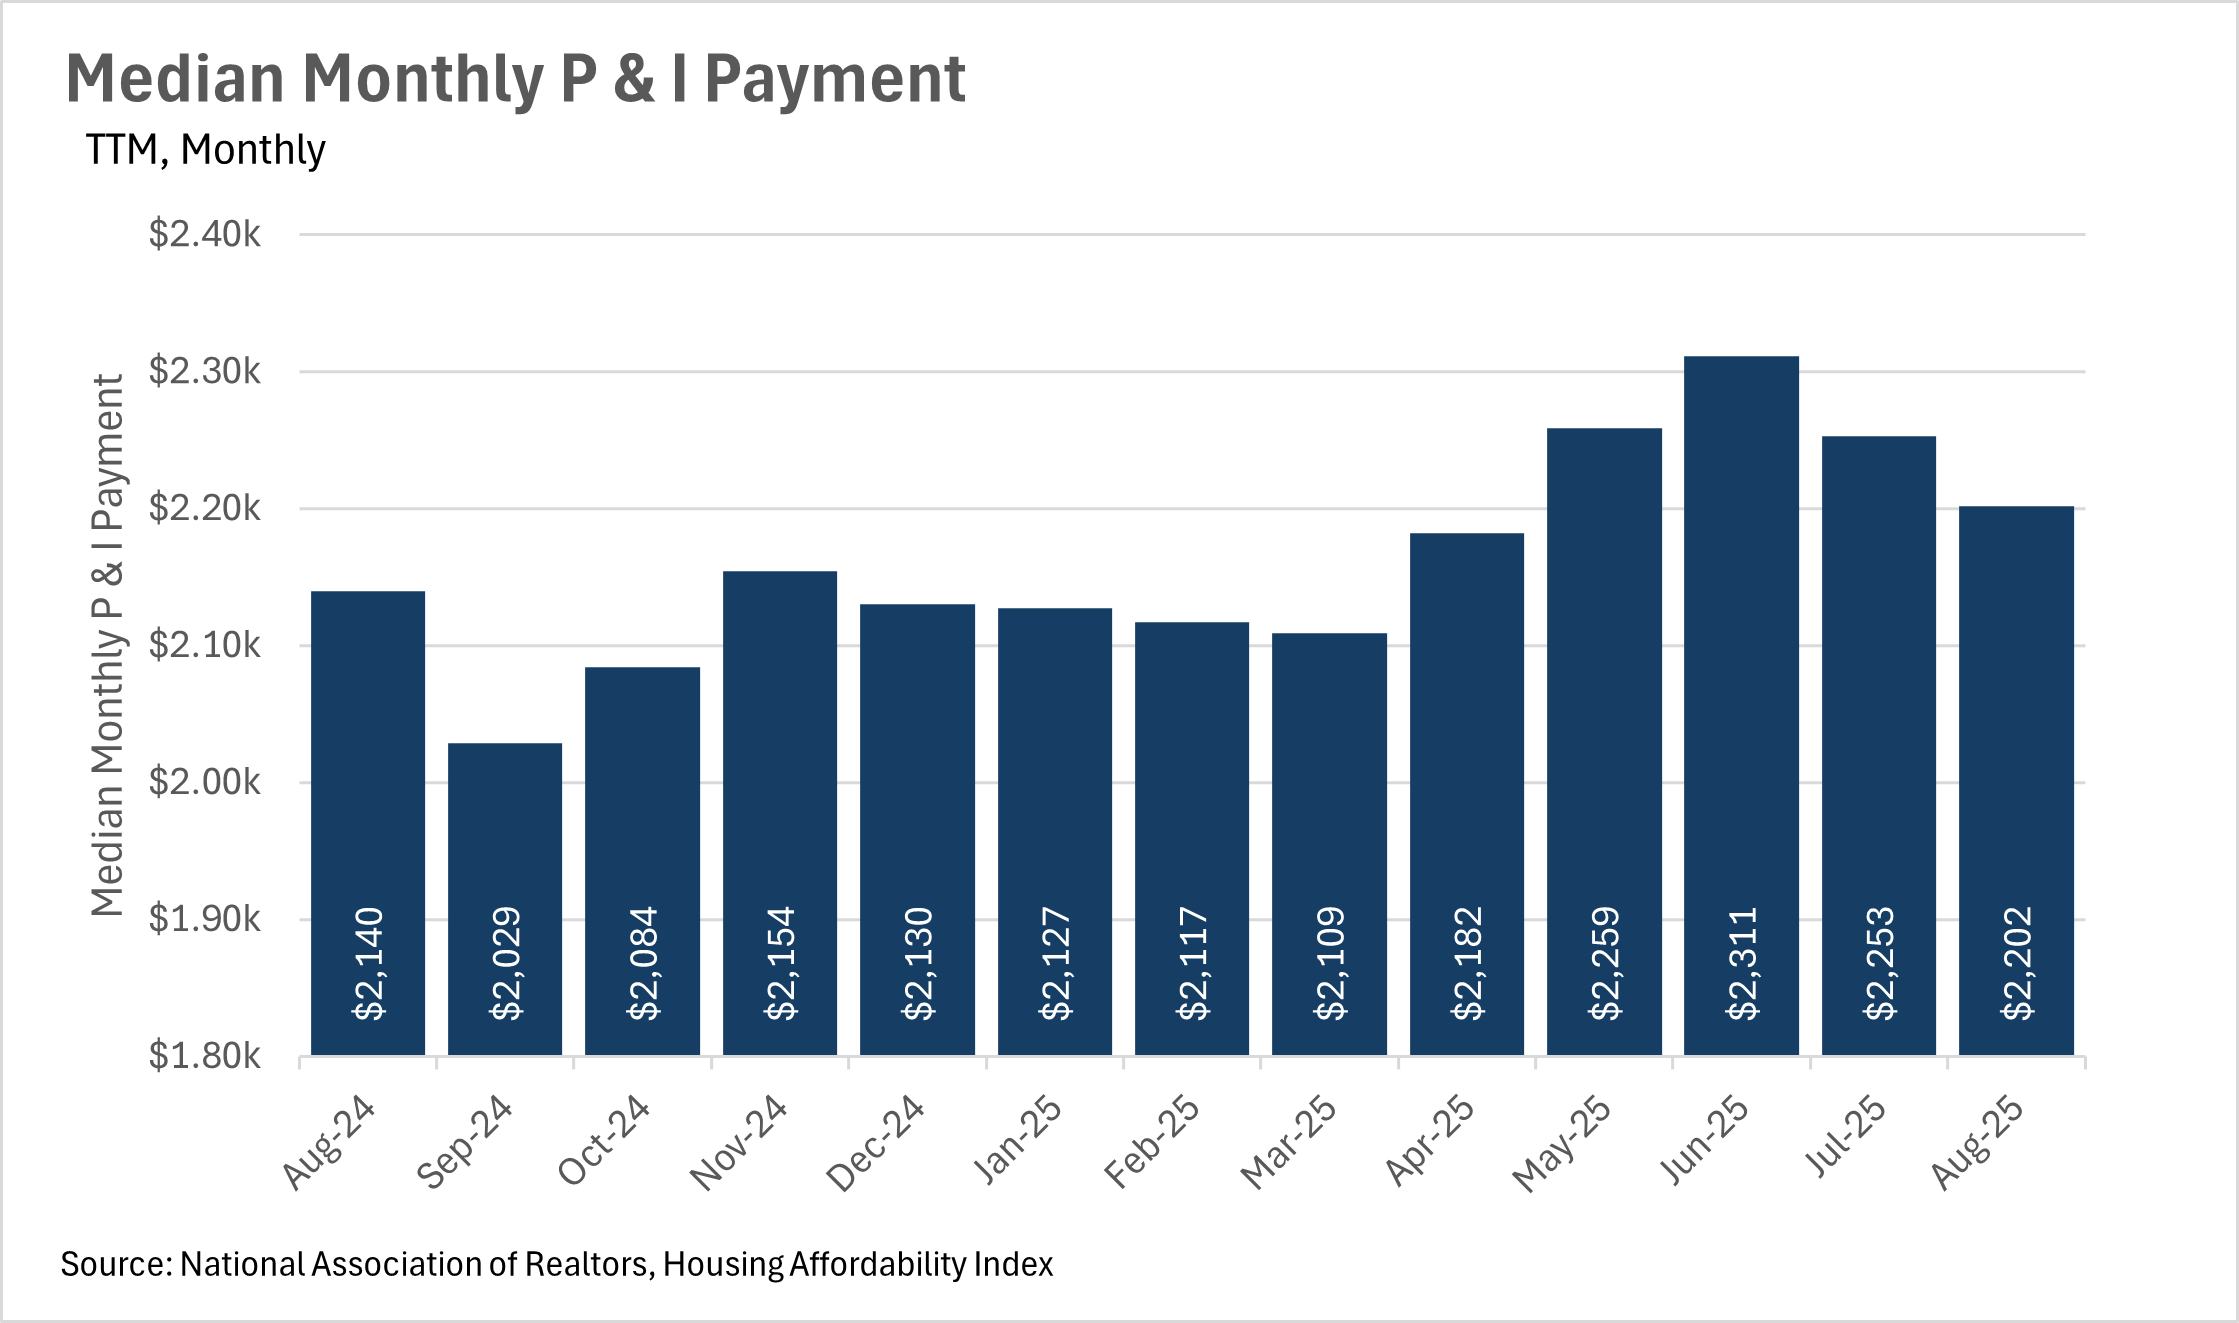
  • Affordability remains an issue nationwide, as monthly P&I payments ticked up by 2.90% year-over-year.
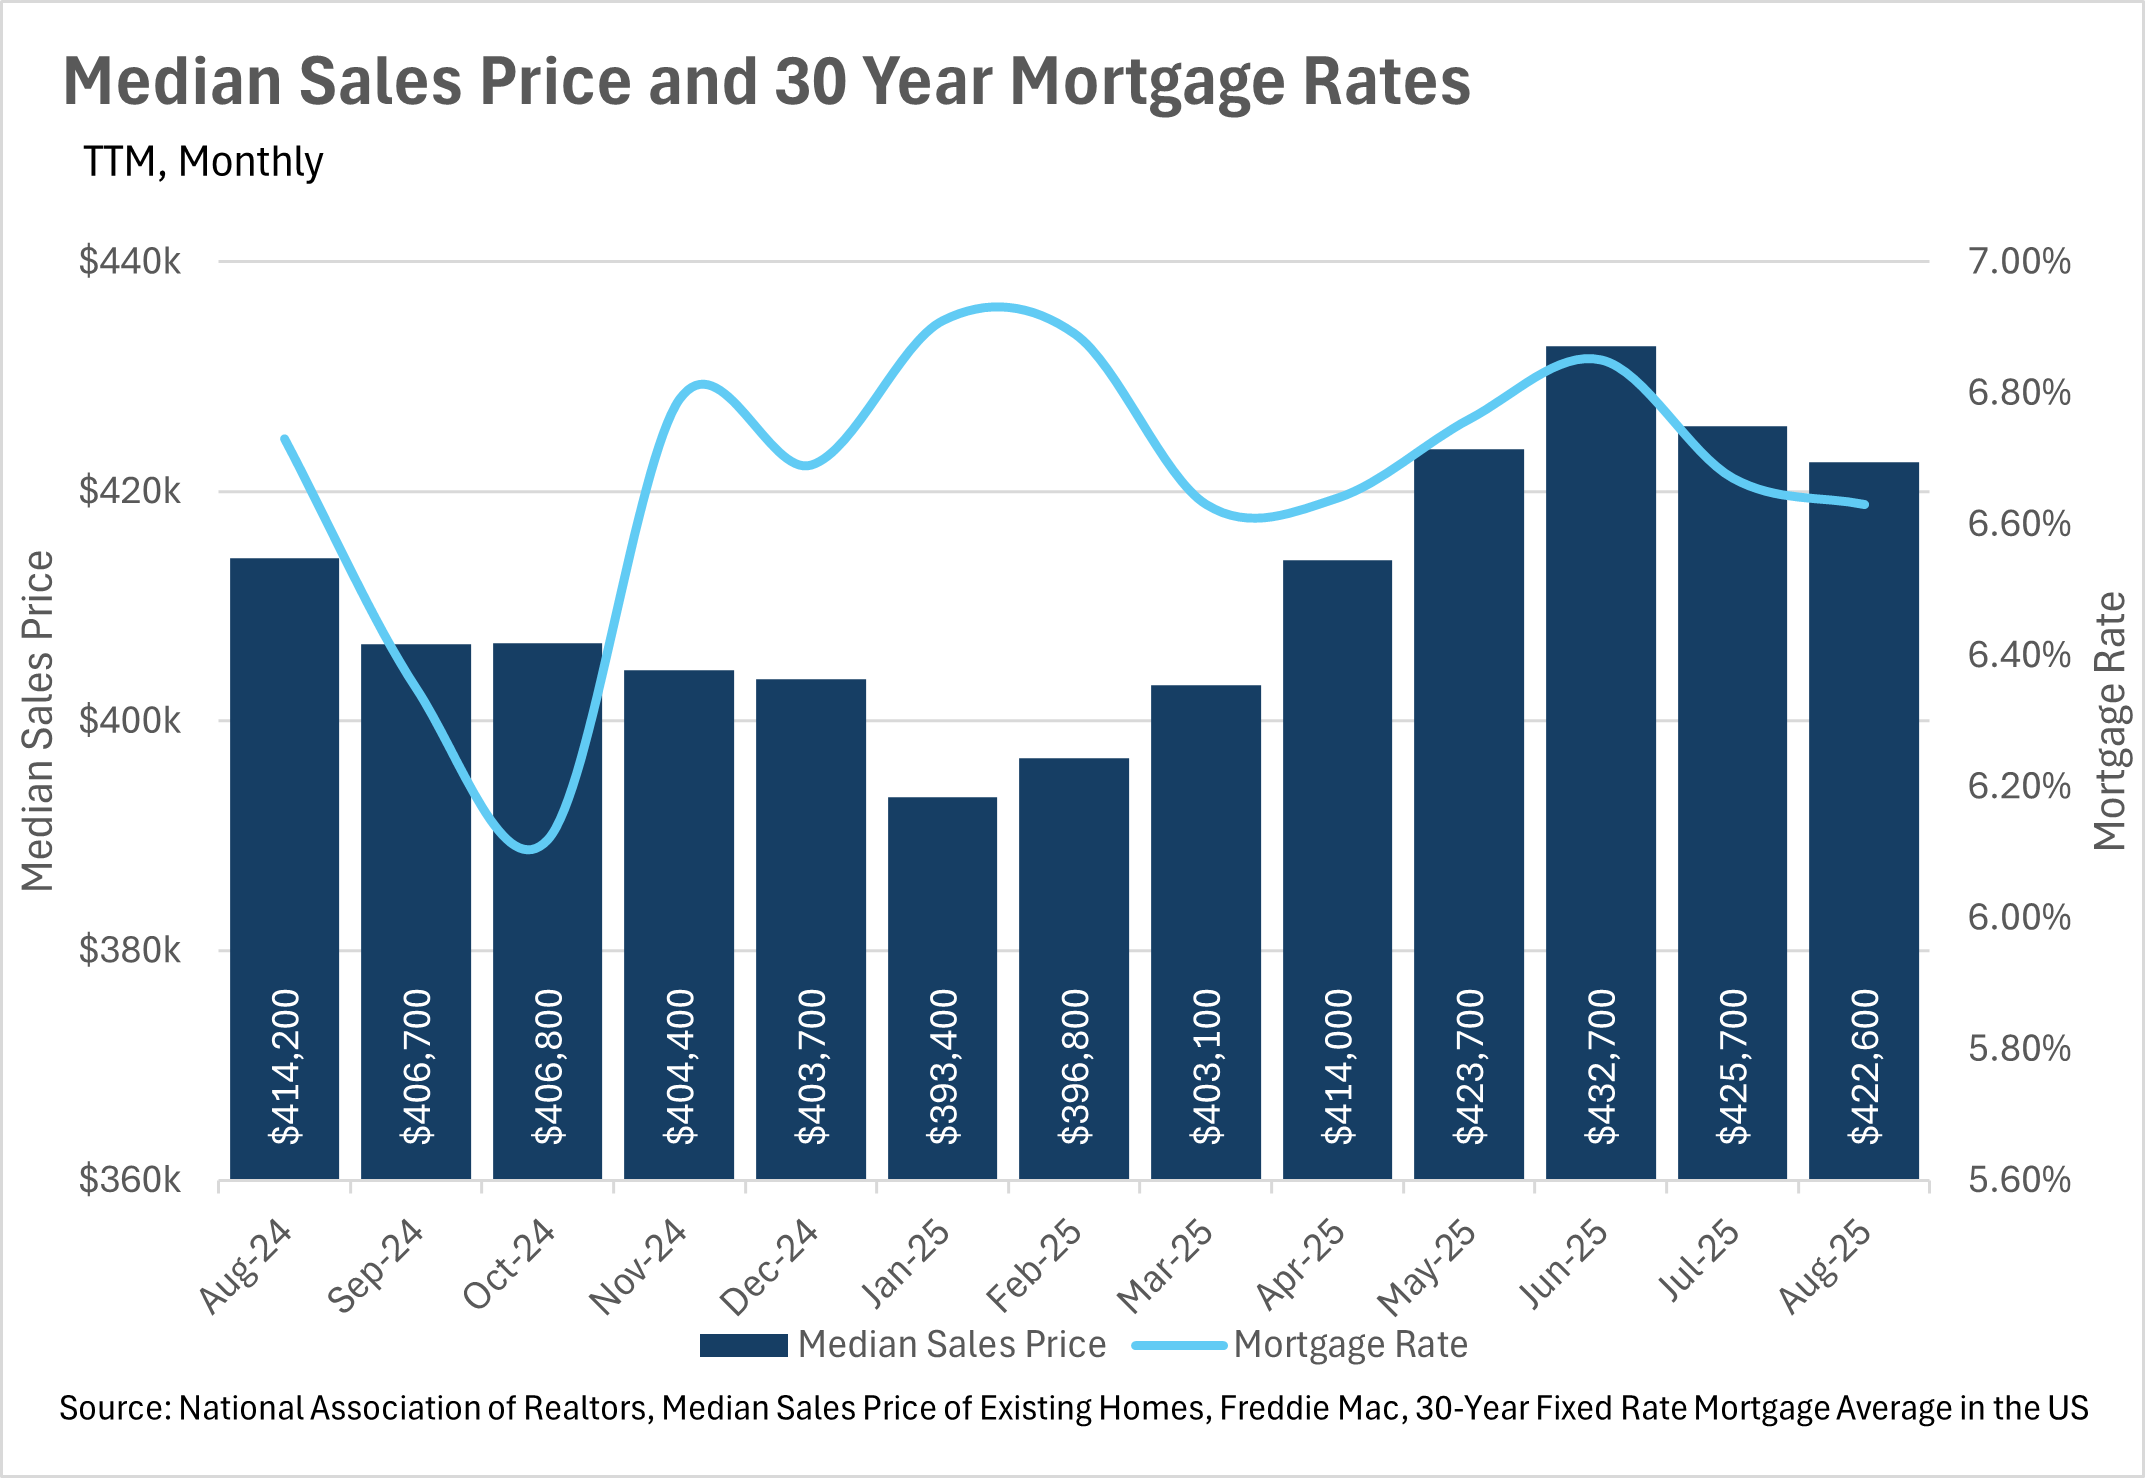
  • Mortgage rates are finally starting to decline, as we enter a rate-cutting cycle.
  • Inventories are still growing at a faster rate than existing home sales.
  • Quick observation about Macroeconomics/The Broader Market
 
Note: You can find the charts & graphs for the Big Story at the end of the following section.
*National Association of REALTORS® data is released two months behind, so we estimate the most recent month's data when possible and appropriate.
 
Mortgage rates have begun to decline thanks to the Fed
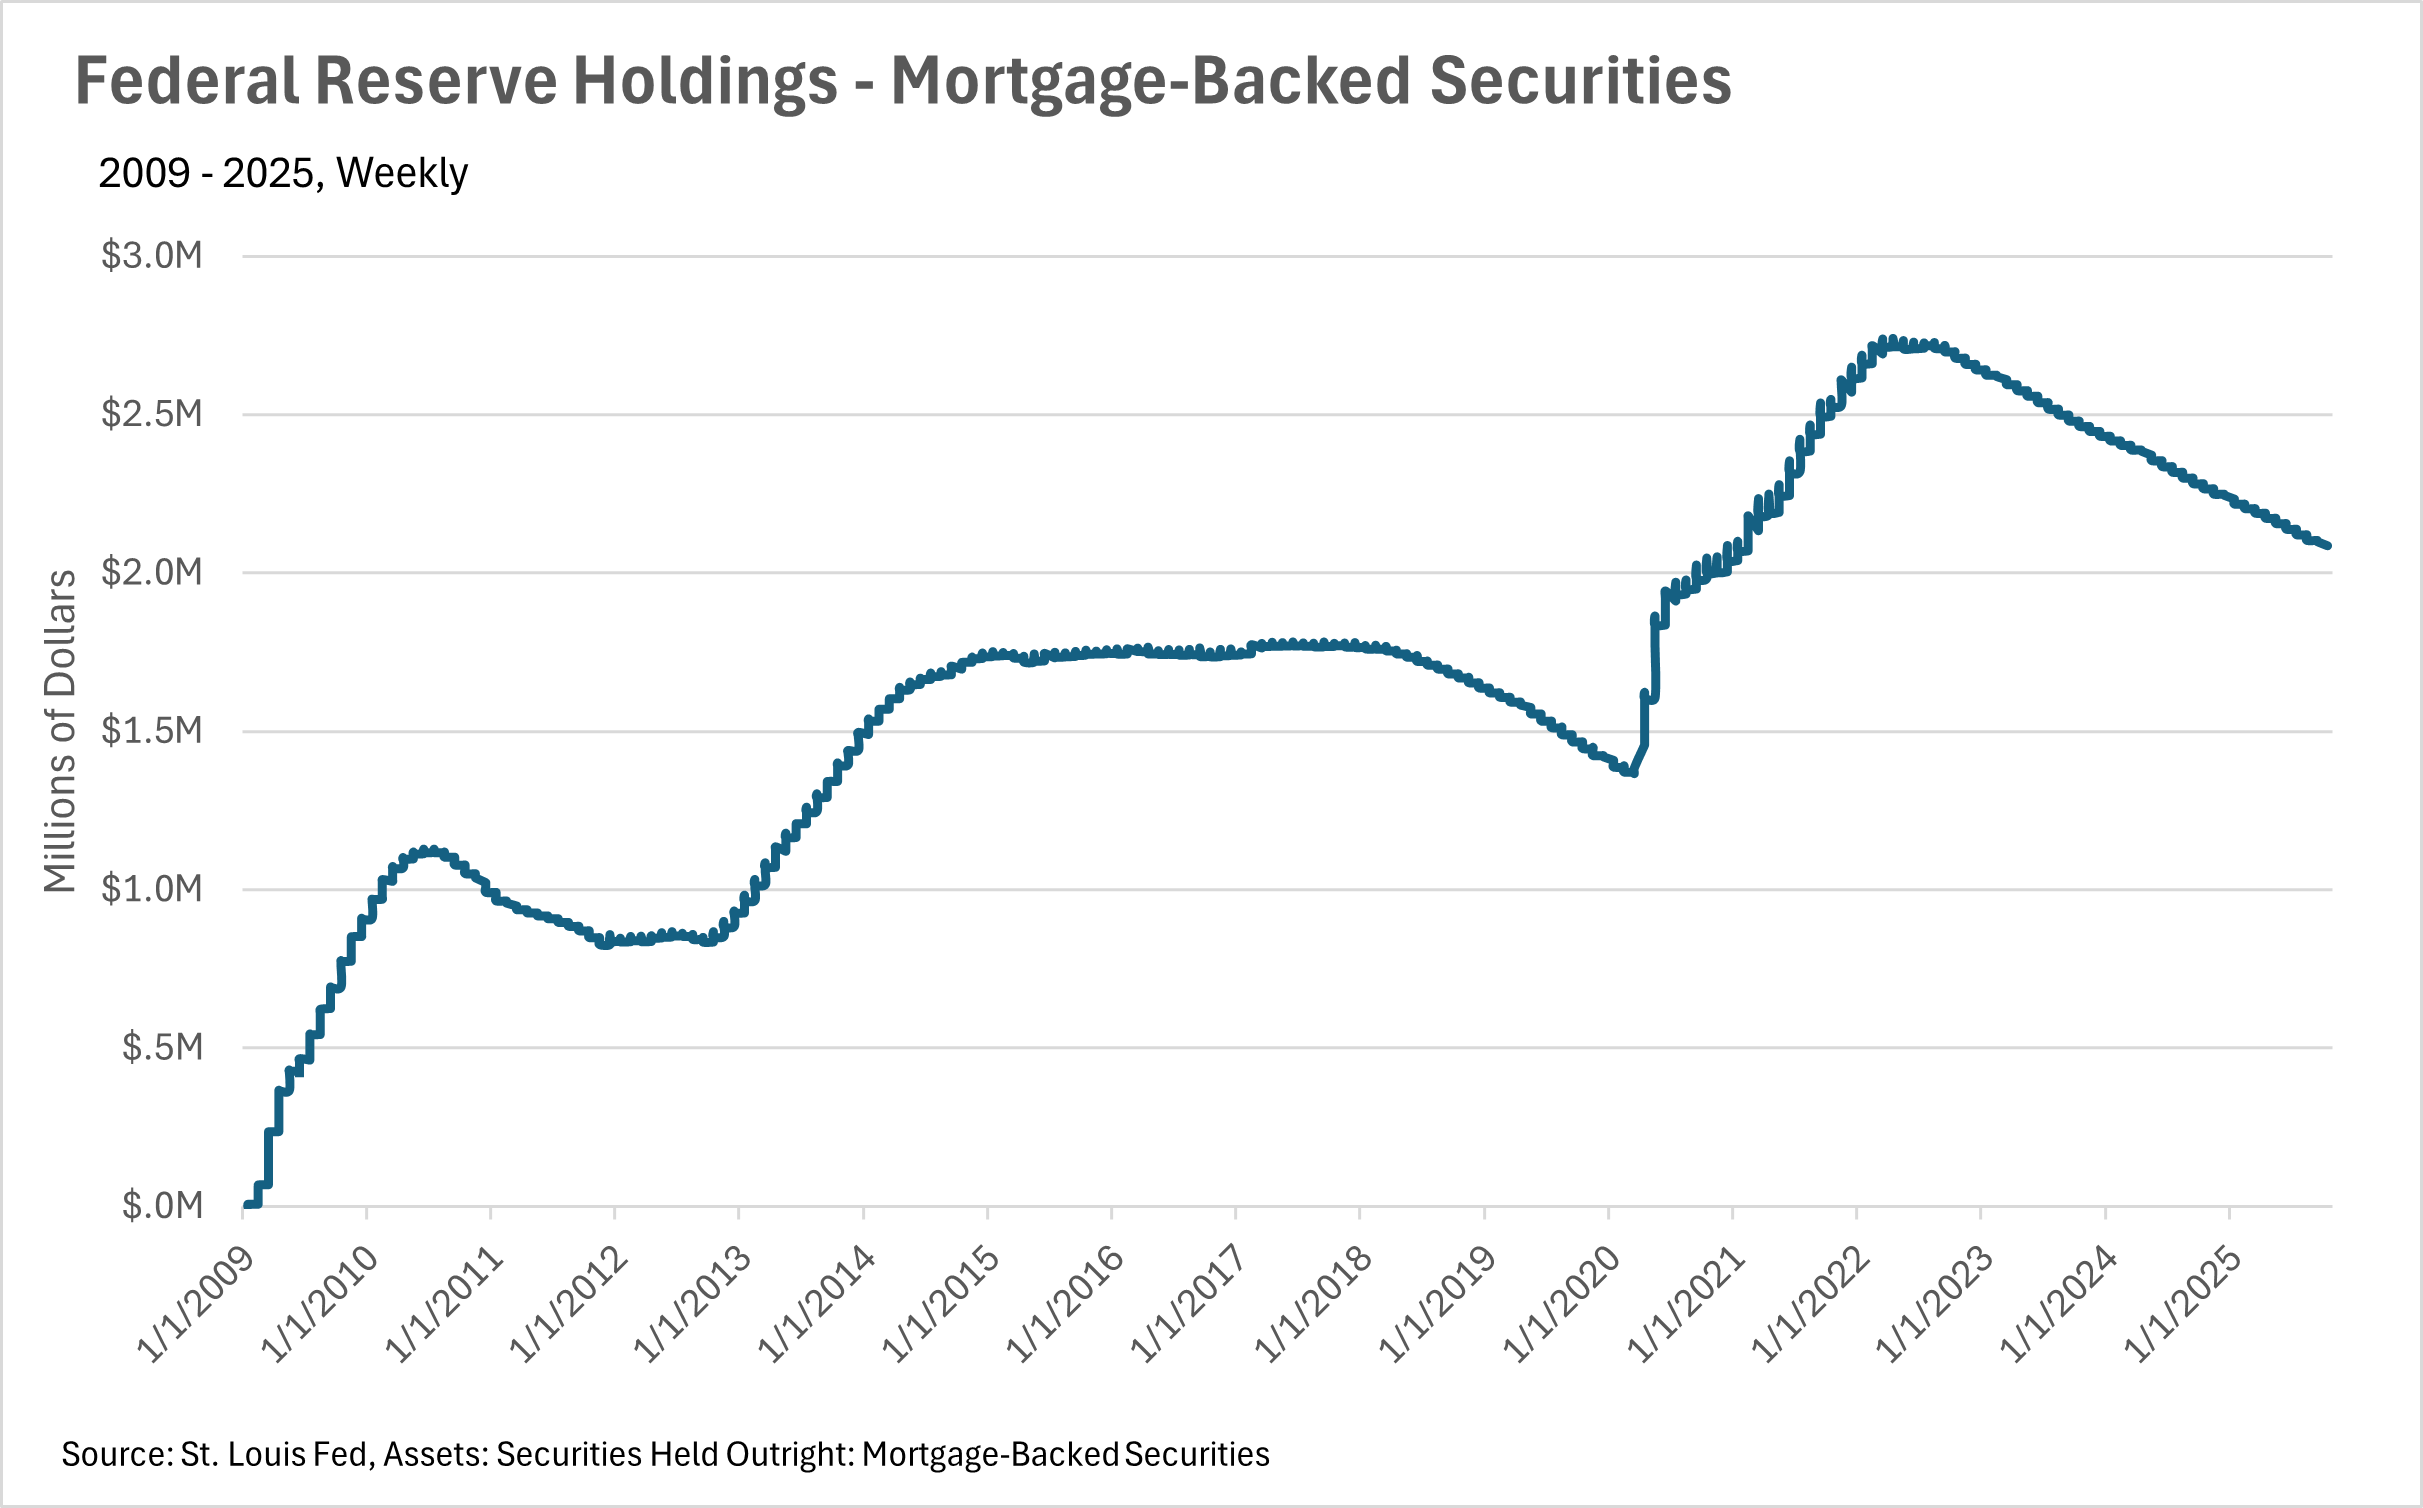
Recently, the Fed came out and announced a quarter-point cut to the federal funds rate, but that was not the most exciting news that they announced. Fed Chairman Jerome Powell announced that we should expect two more quarter-point cuts before the end of the year, signalling that we are in the beginning innings of a Fed cutting cycle. This, of course, is huge news for the housing market. Despite the fact that many markets have retained much of their post-pandemic gains in value, the housing market has been largely stagnant, with inventories building as home buyers decide to sit on the sidelines and wait.
 
Affordability remains a concern throughout the country
Housing affordability has been a huge problem facing the country ever since the onset of the COVID-19 pandemic. Although many thought that home prices would decrease as interest rates increased, many markets did not see a normalization of home prices. This, of course, has left many prospective home buyers worried about where the market will go as we enter a new rate-cutting cycle. Many fear that lower interest rates may bring a slew of new buyers to the market, pushing home prices up even further, and making home ownership even less attainable for first-time buyers. On the flip side, homeowners stand to benefit in a huge way if declining interest rates lead to a housing frenzy, as they’ll accumulate significant equity in a very small period of time, just like what we saw throughout 2020-2022.
Inventories continue to build nationwide
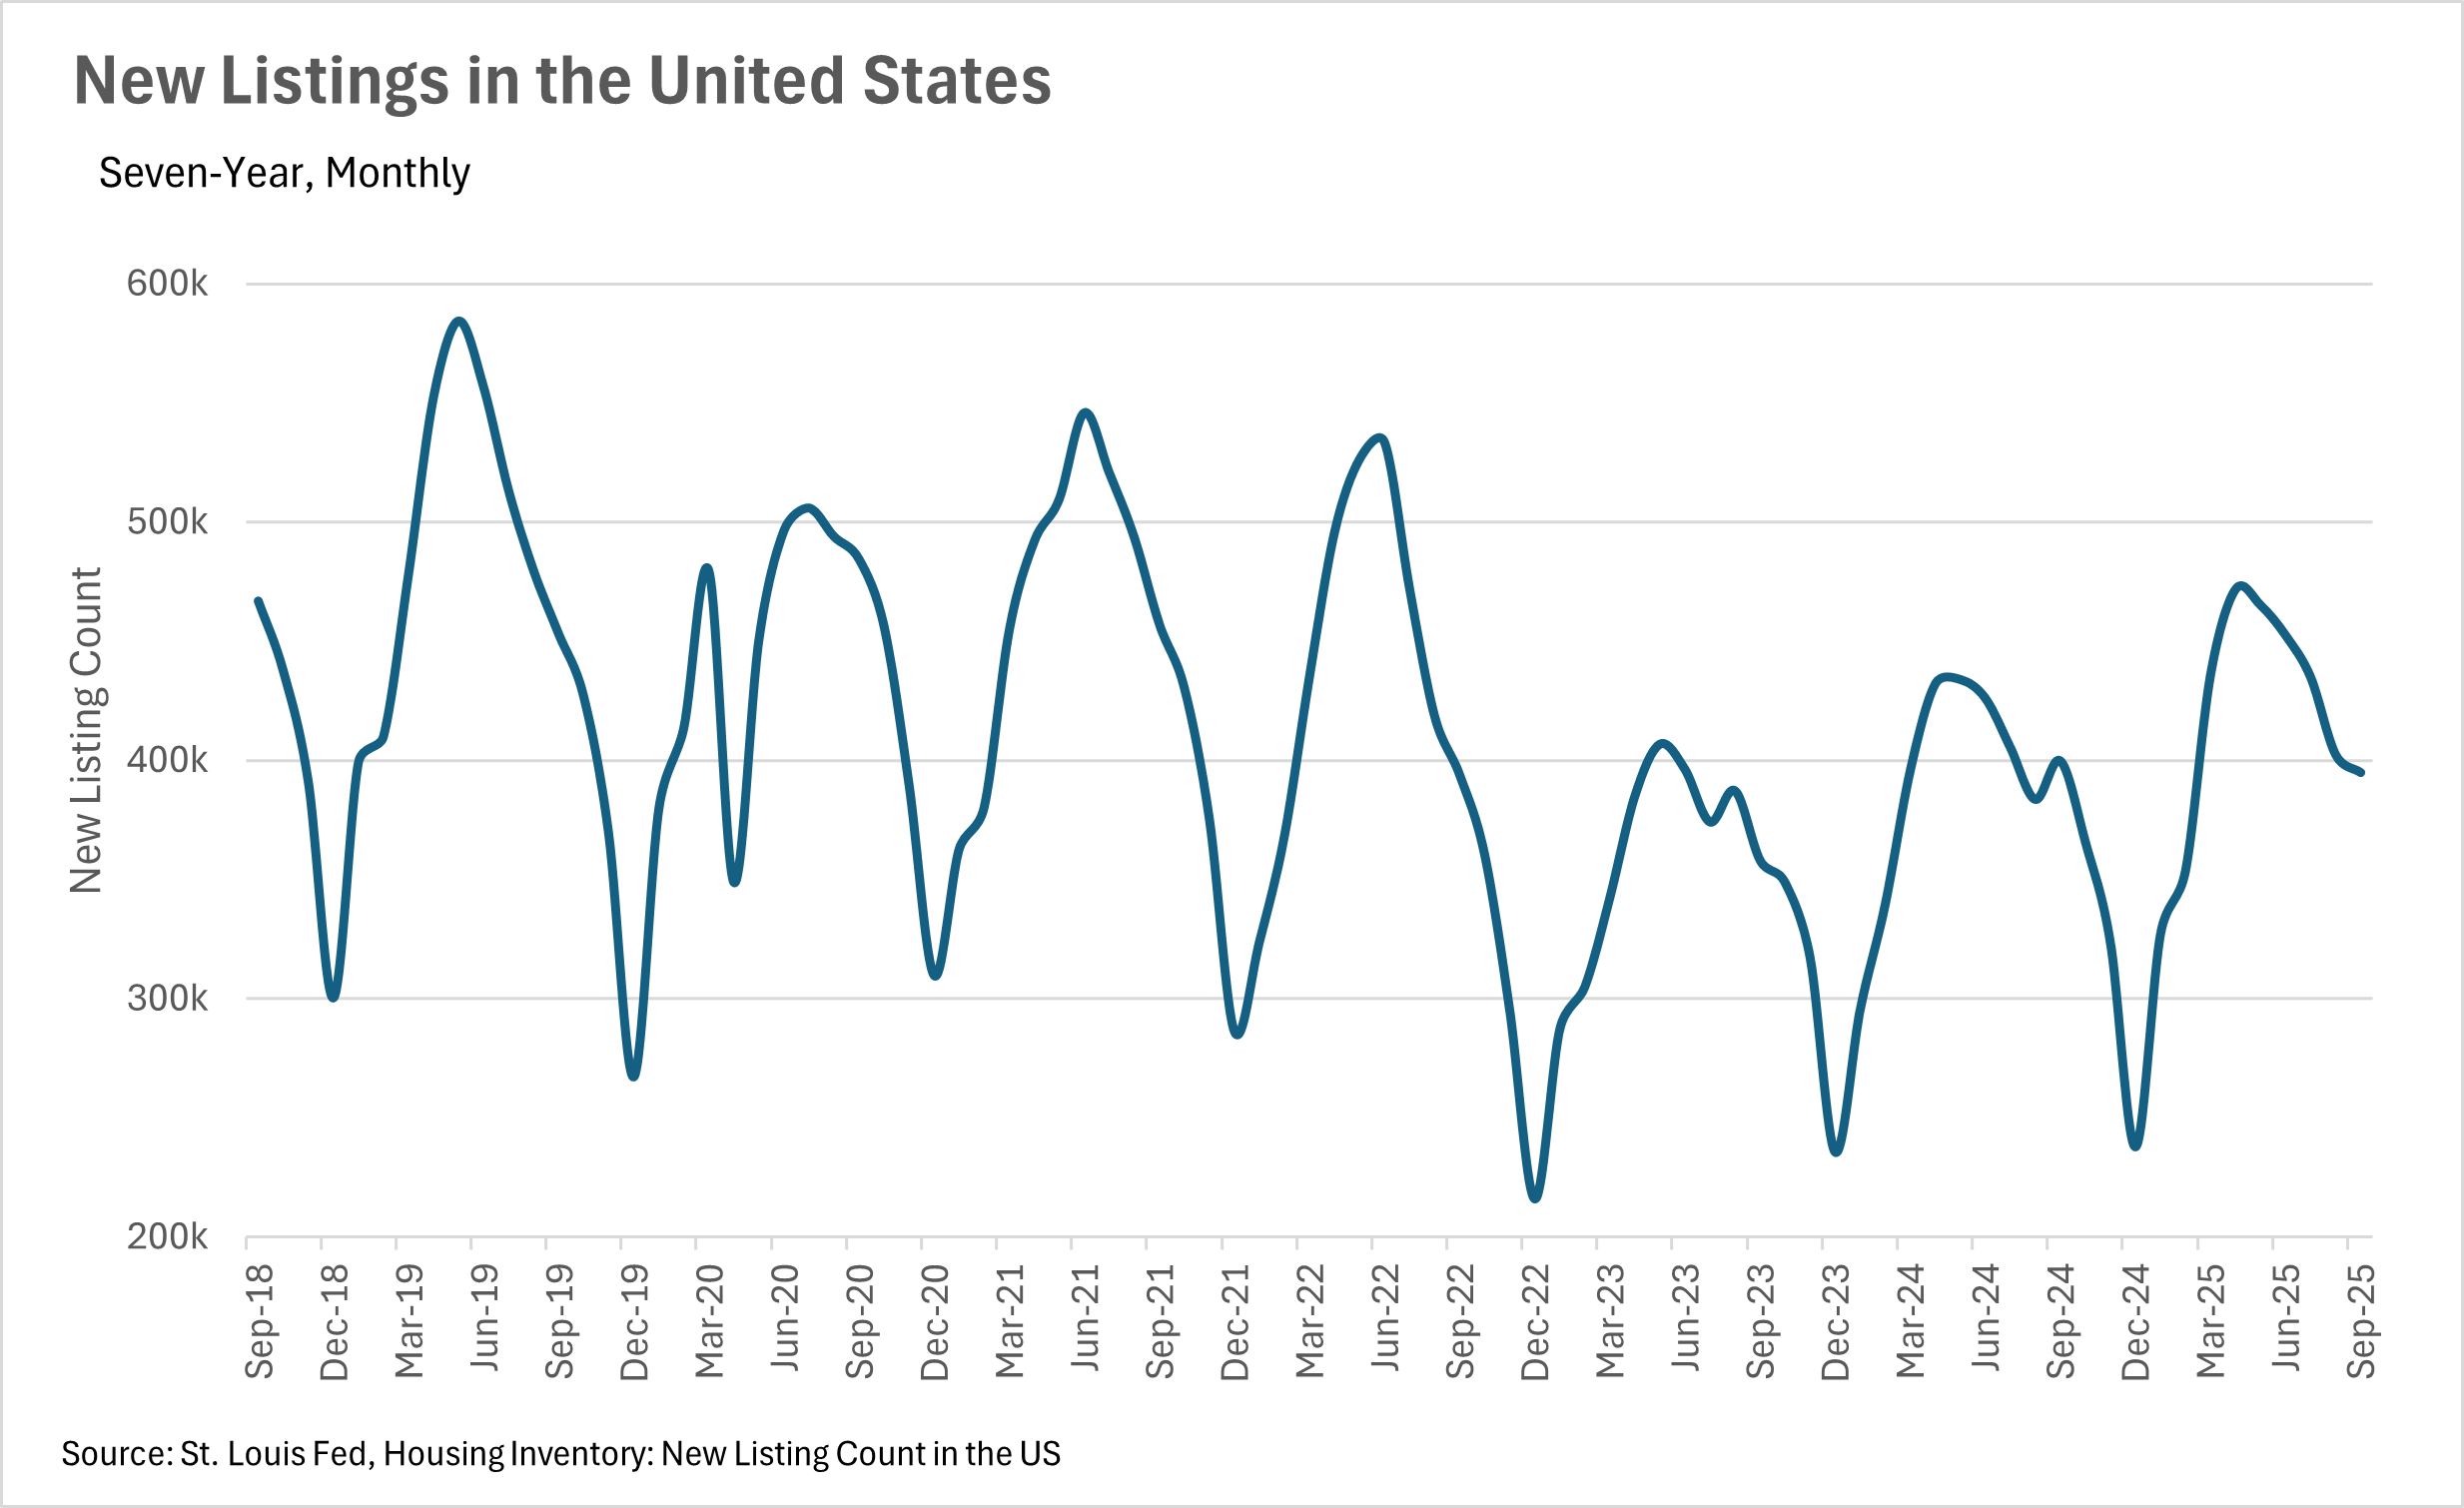
As we mentioned above, the national inventory is quite a bit higher than last year, with 11.68% more homes listed on the market. This really underscores the fact that buyers have decided mainly to throw in the towel and wait for a better chance to purchase a home. When you combine this with the fact that there were 4.88% more new homes hitting the market than this time last year, you have a recipe for growing inventory!
Current market dynamics have created an interesting setup for 2026
As we move into the seasonally slow months, the market environment that we’re in is setting up for what could be a very interesting 2026. Inventories are still growing (for now), and interest rates are falling, which could put us in a very interesting position when the spring frenzy begins next year. It’ll be important to keep a keen eye on both the market and broader macroeconomic conditions throughout the fall and winter, so that you and your clients are ready for whatever spring has to throw at you.
 
All of this is just what we’re seeing at a national level, though. To get a better idea of what’s going on in your local market, be sure to check out your local lowdown below:
Big Story Data
Chart of existing home sales and inventory from August 2024 to August 2025; sales dip as inventory rises.
Chart of Federal Reserve mortgage-backed securities holdings, peaking in 2022 before declining through 2025.
Bar chart of median monthly principal and interest payments, rising to $2,311 in June 2025 before falling to $2,202 in August.
Chart comparing monthly U.S. median home sale prices and 30-year mortgage rates from August 2024 to August 2025.
Chart of monthly U.S. new listings, September 2018 to September 2025, with recurring seasonal peaks and troughs.
The Local Lowdown
Quick Take:
  • September marked a significant shift in Bay Area inventory dynamics, with most regions experiencing year-over-year declines for the first time in months, driven by increased sales velocity rather than new listing growth.
  • San Francisco stands out with dramatic inventory declines of over 30% and surging single-family home prices, while other regions show more modest price movements within historical bands.
  • Market velocity continues to accelerate across most Bay Areas regions, with listings selling faster despite percentage increases in days on market, as absolute numbers remain remarkably low.
  • The region-wide trend toward seller's markets intensifies as inventory normalization continues, with San Francisco's condo market approaching seller's territory and other regions showing steady movement in that direction.
 
Note: You can find the charts/graphs for the Local Lowdown at the end of this section.
Price stability dominates most regions while San Francisco surges
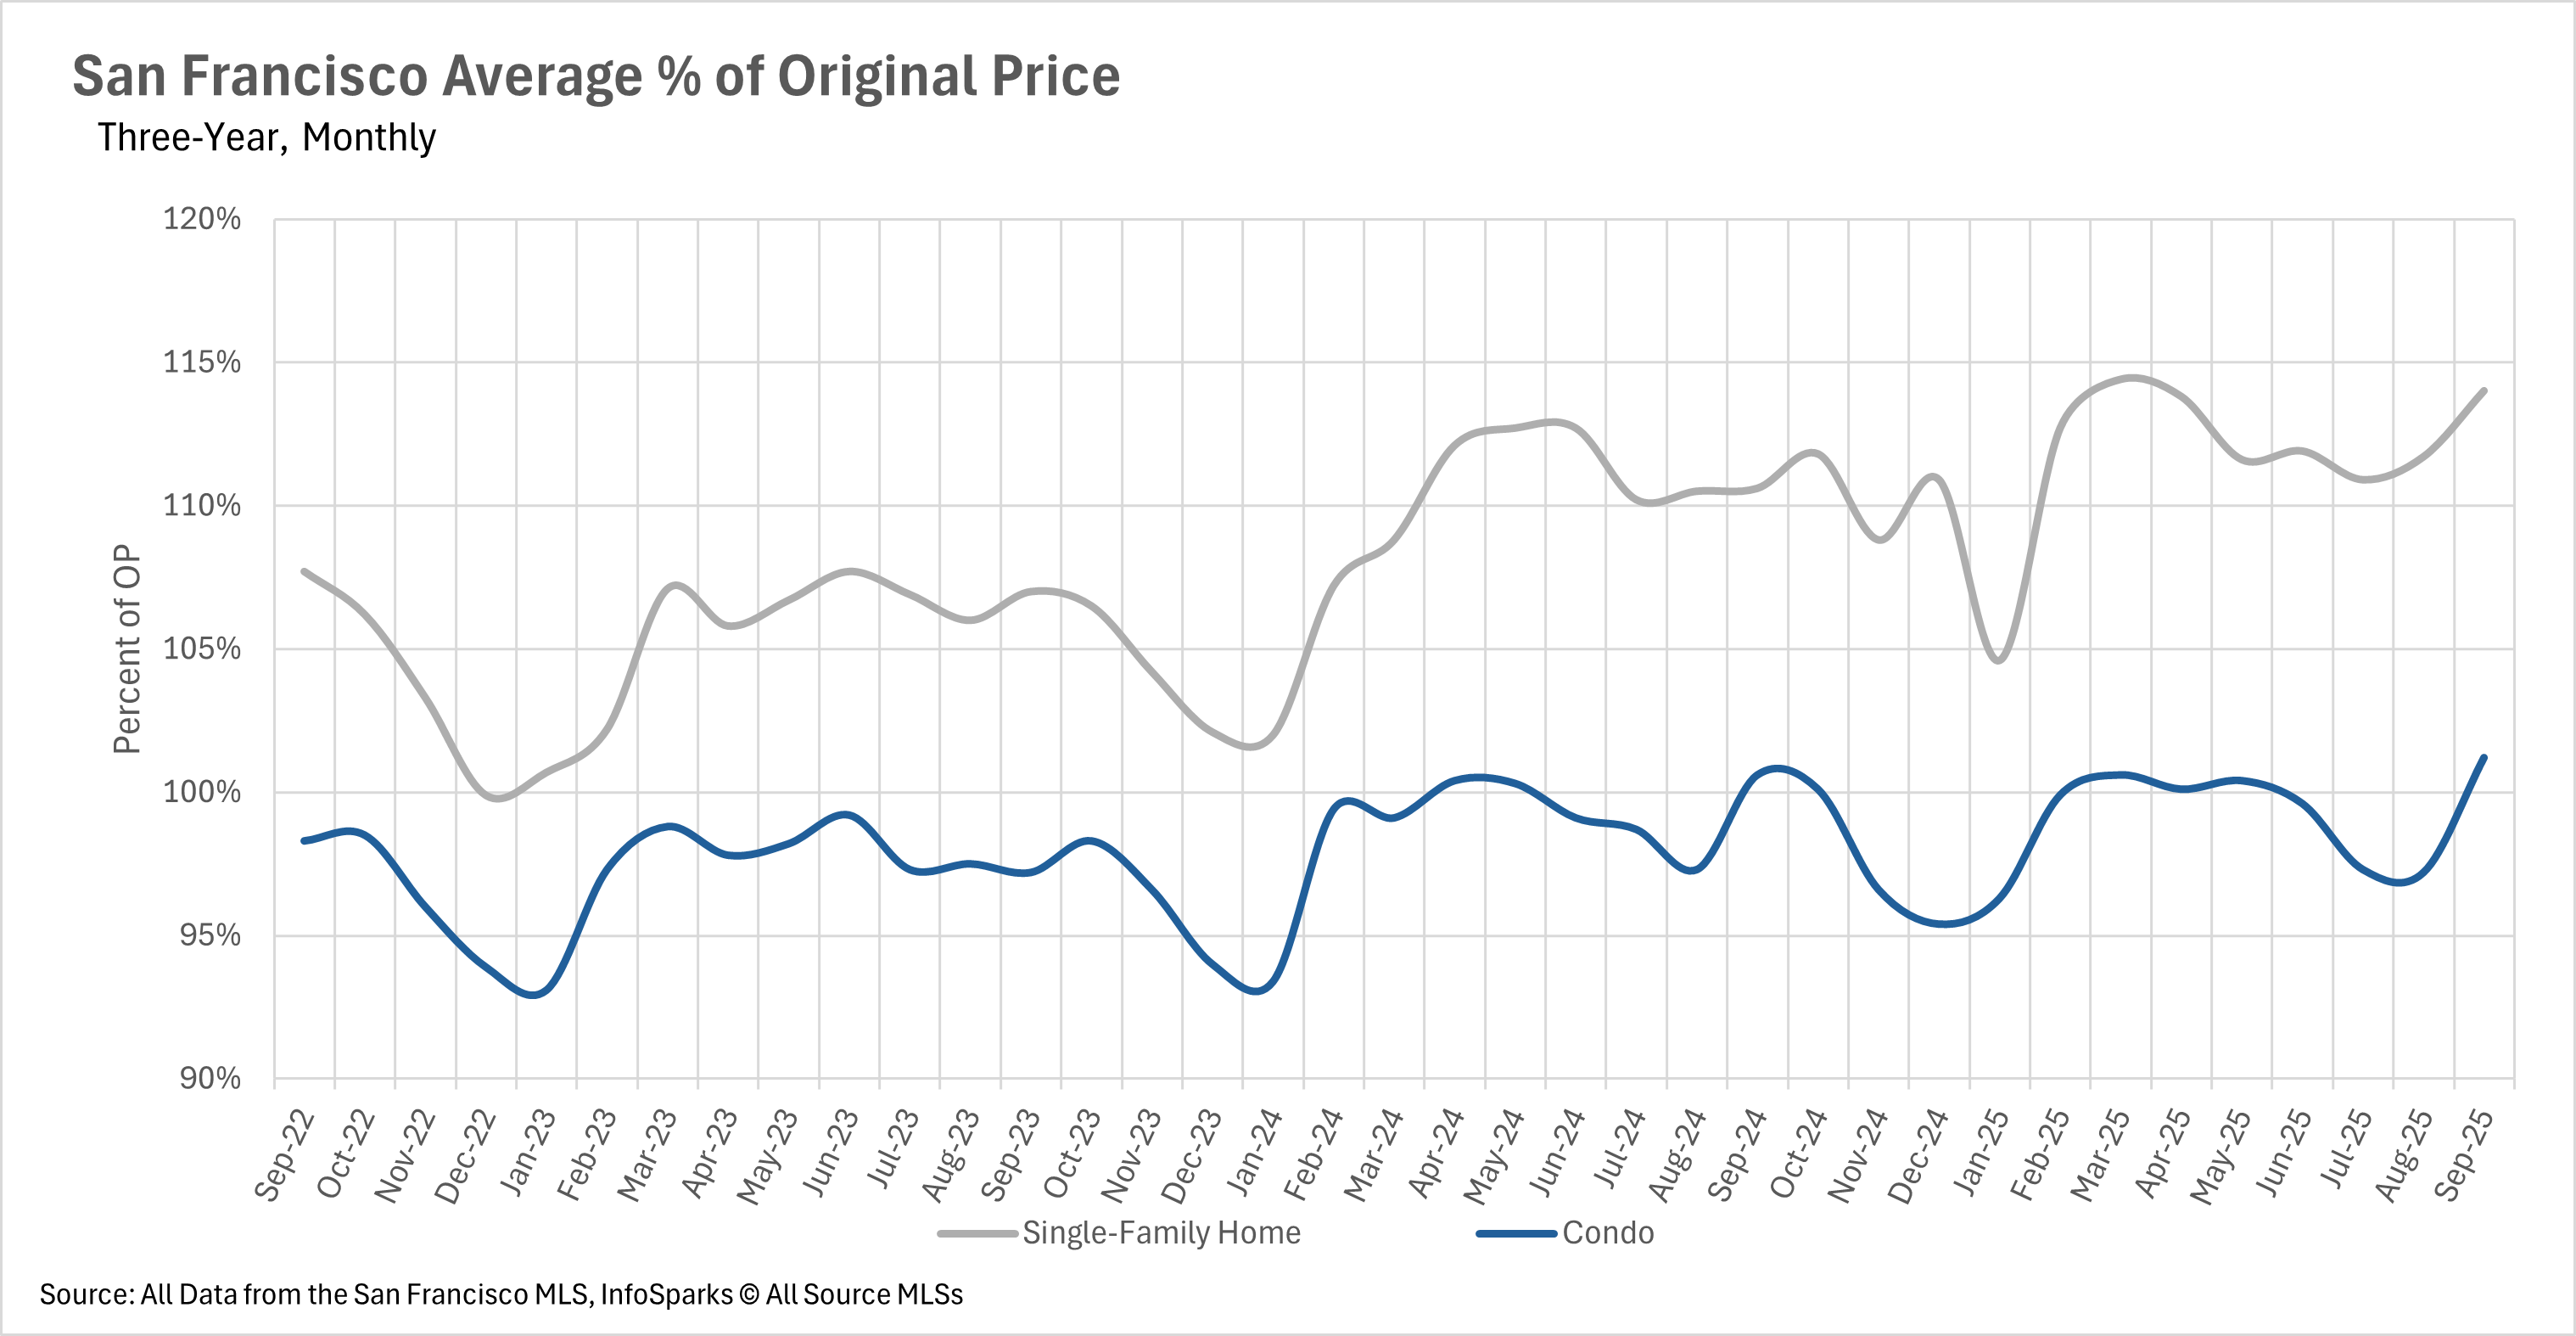
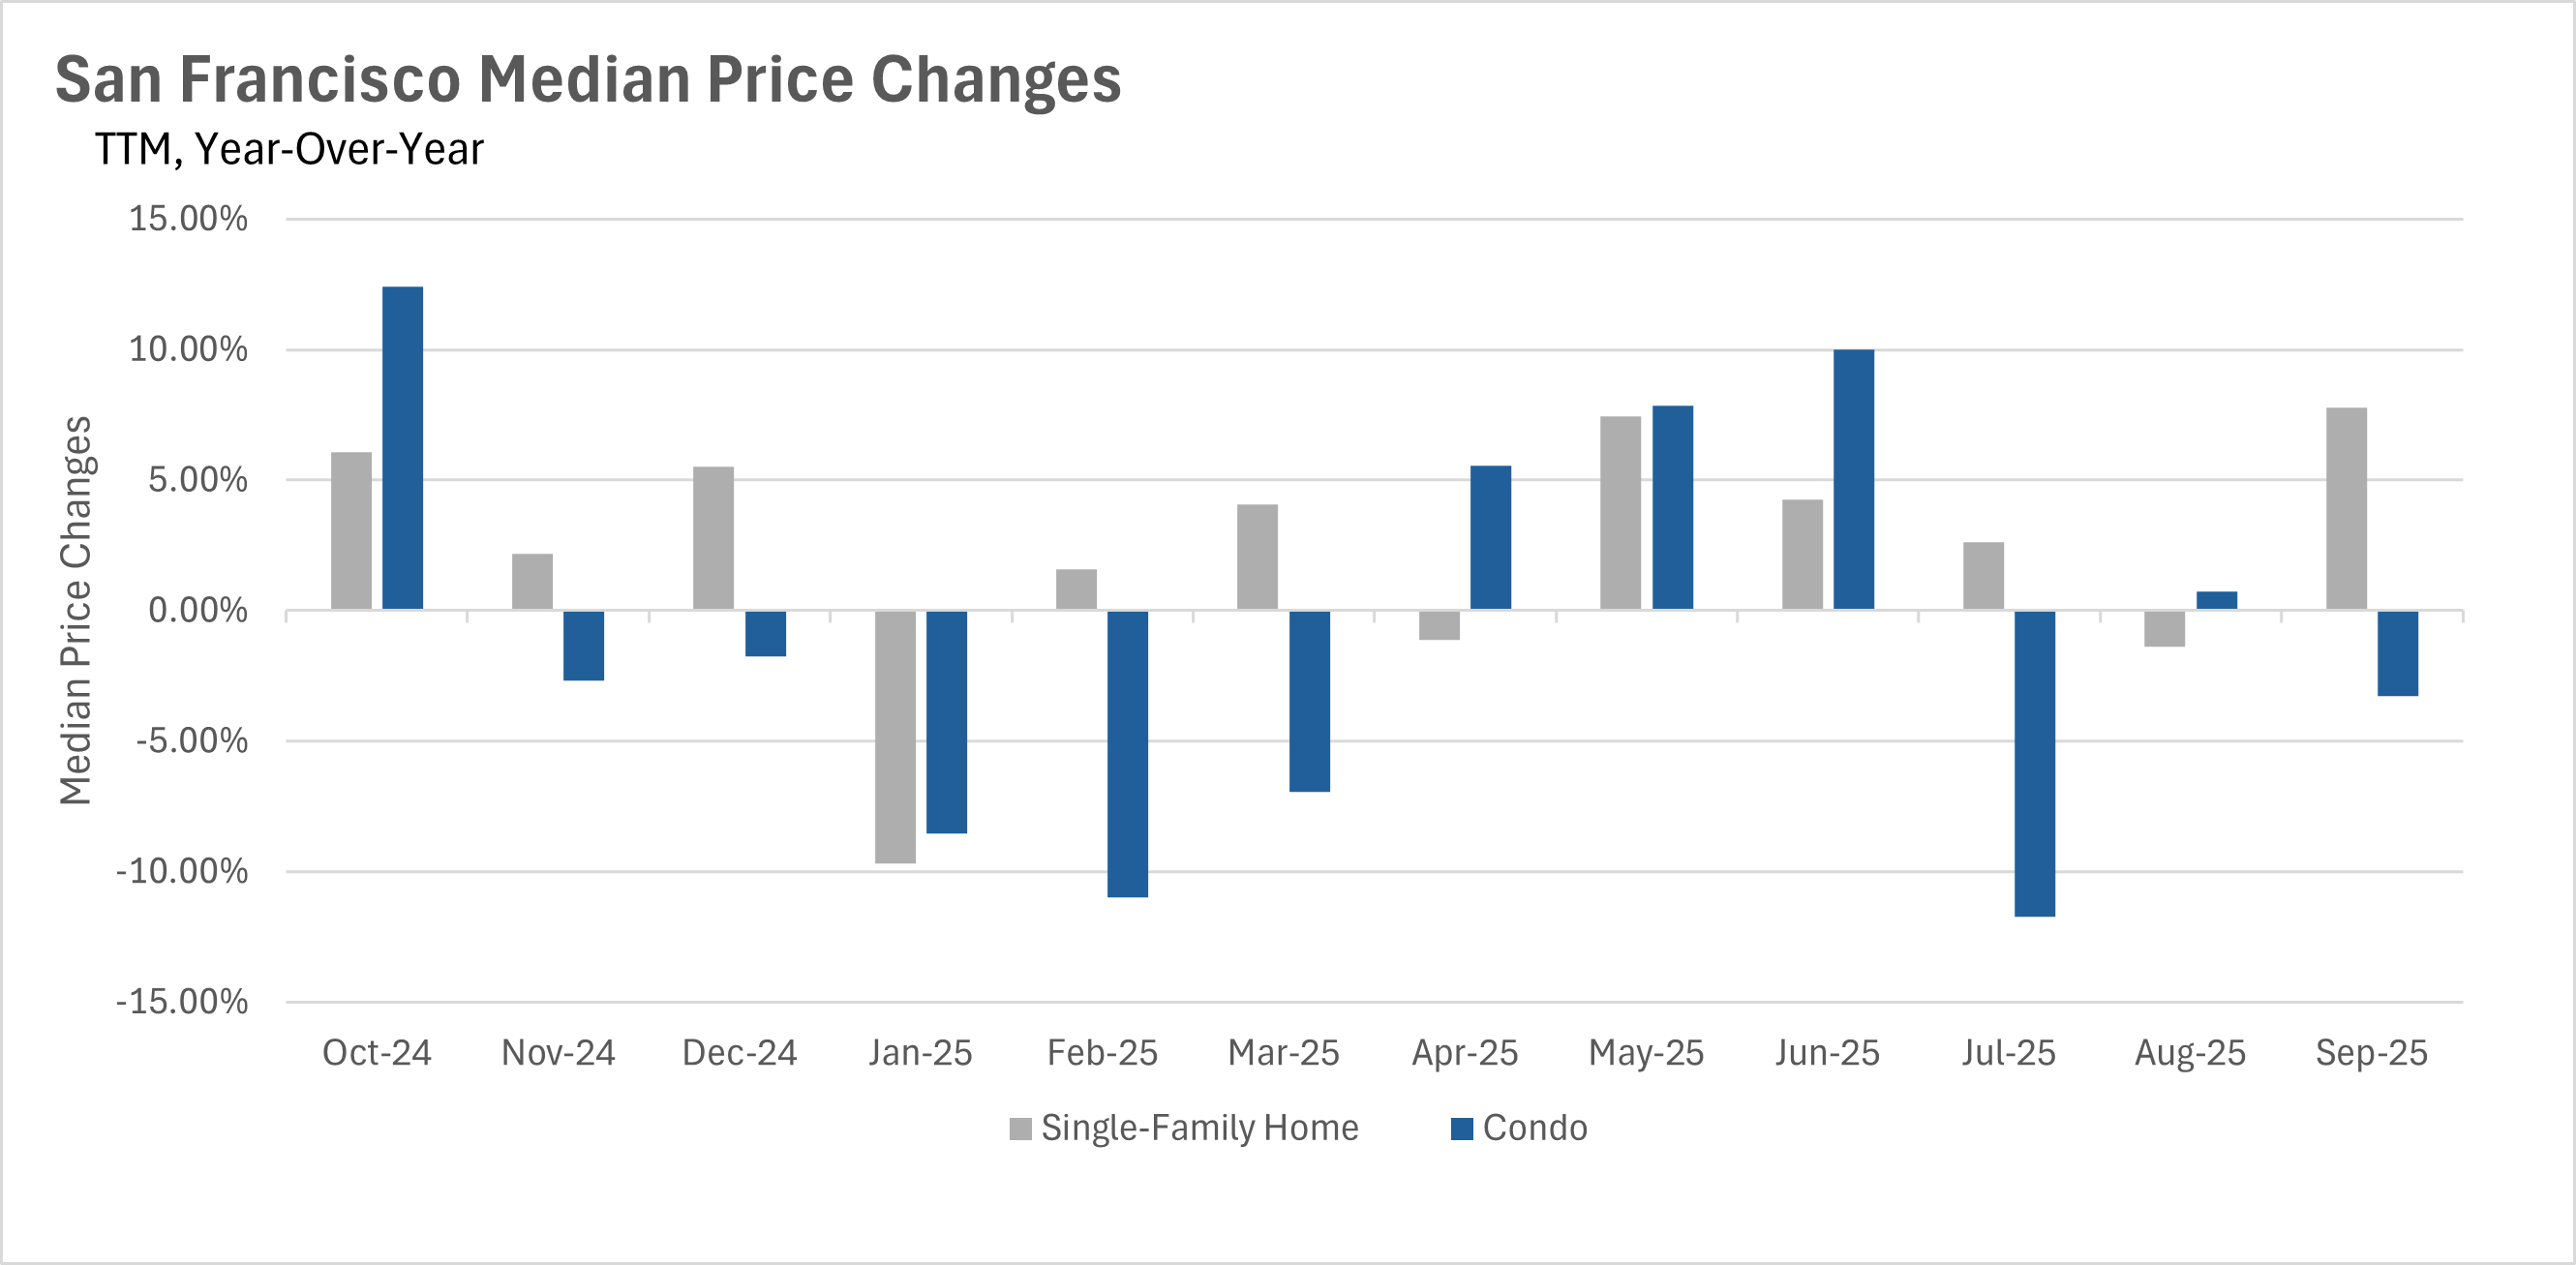
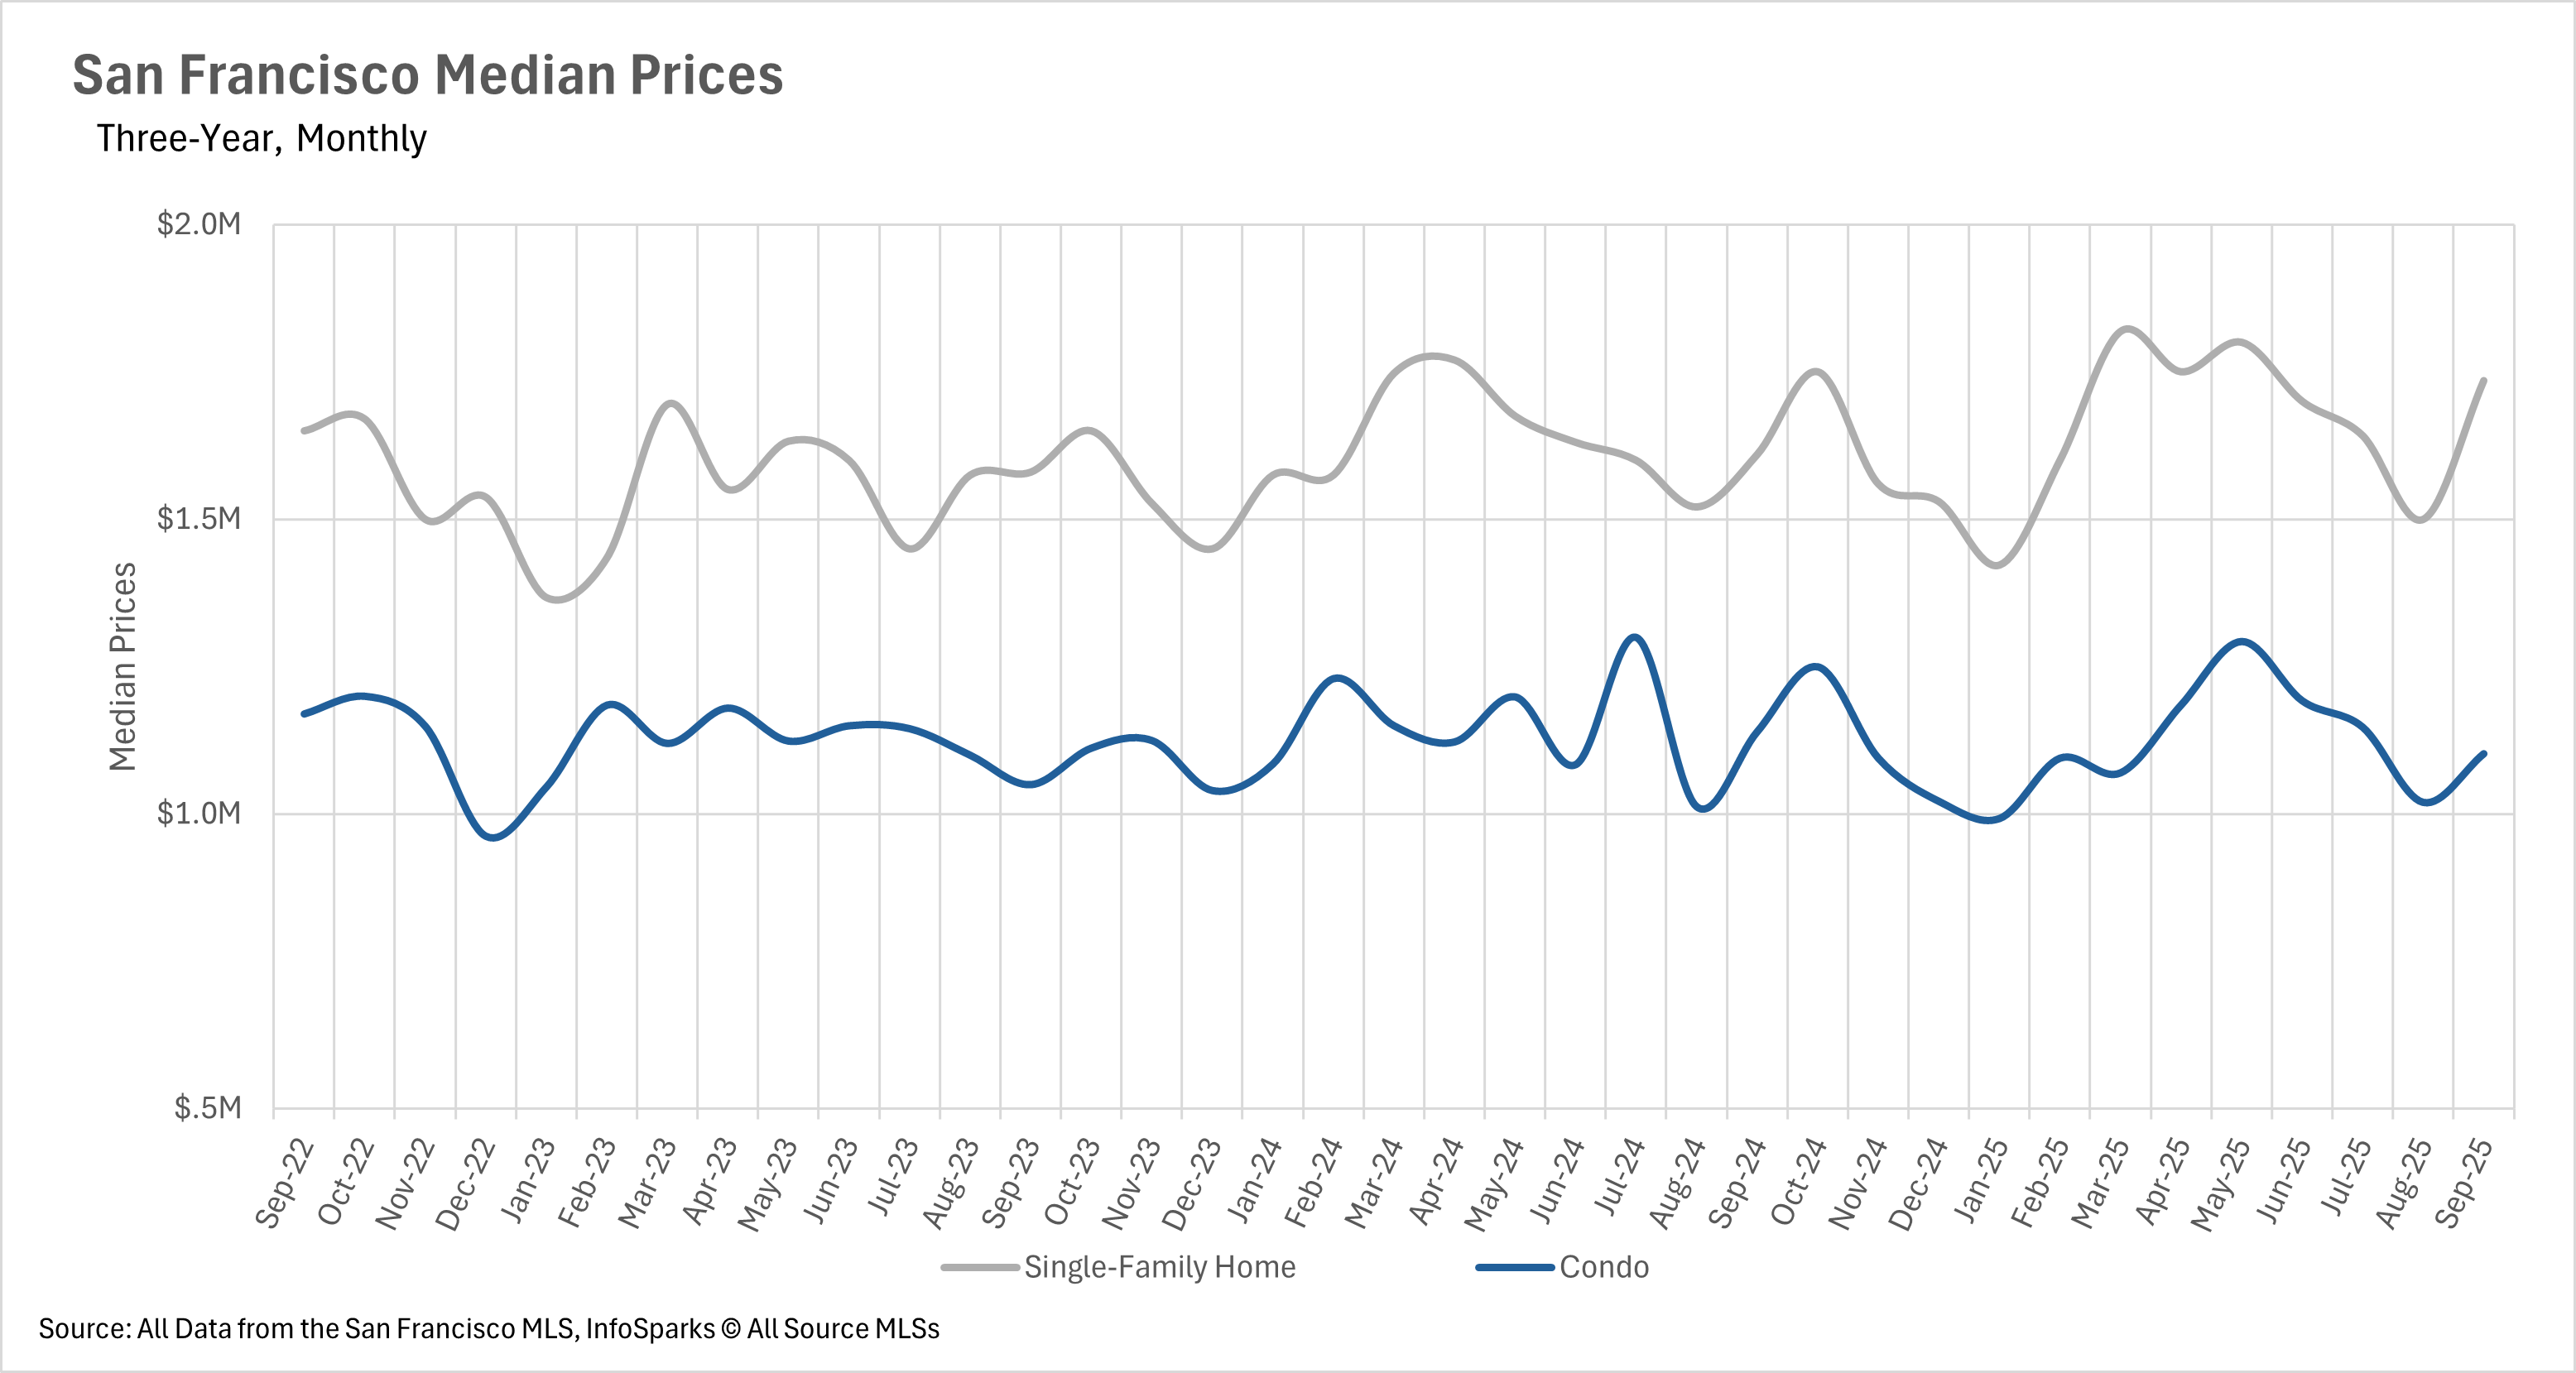
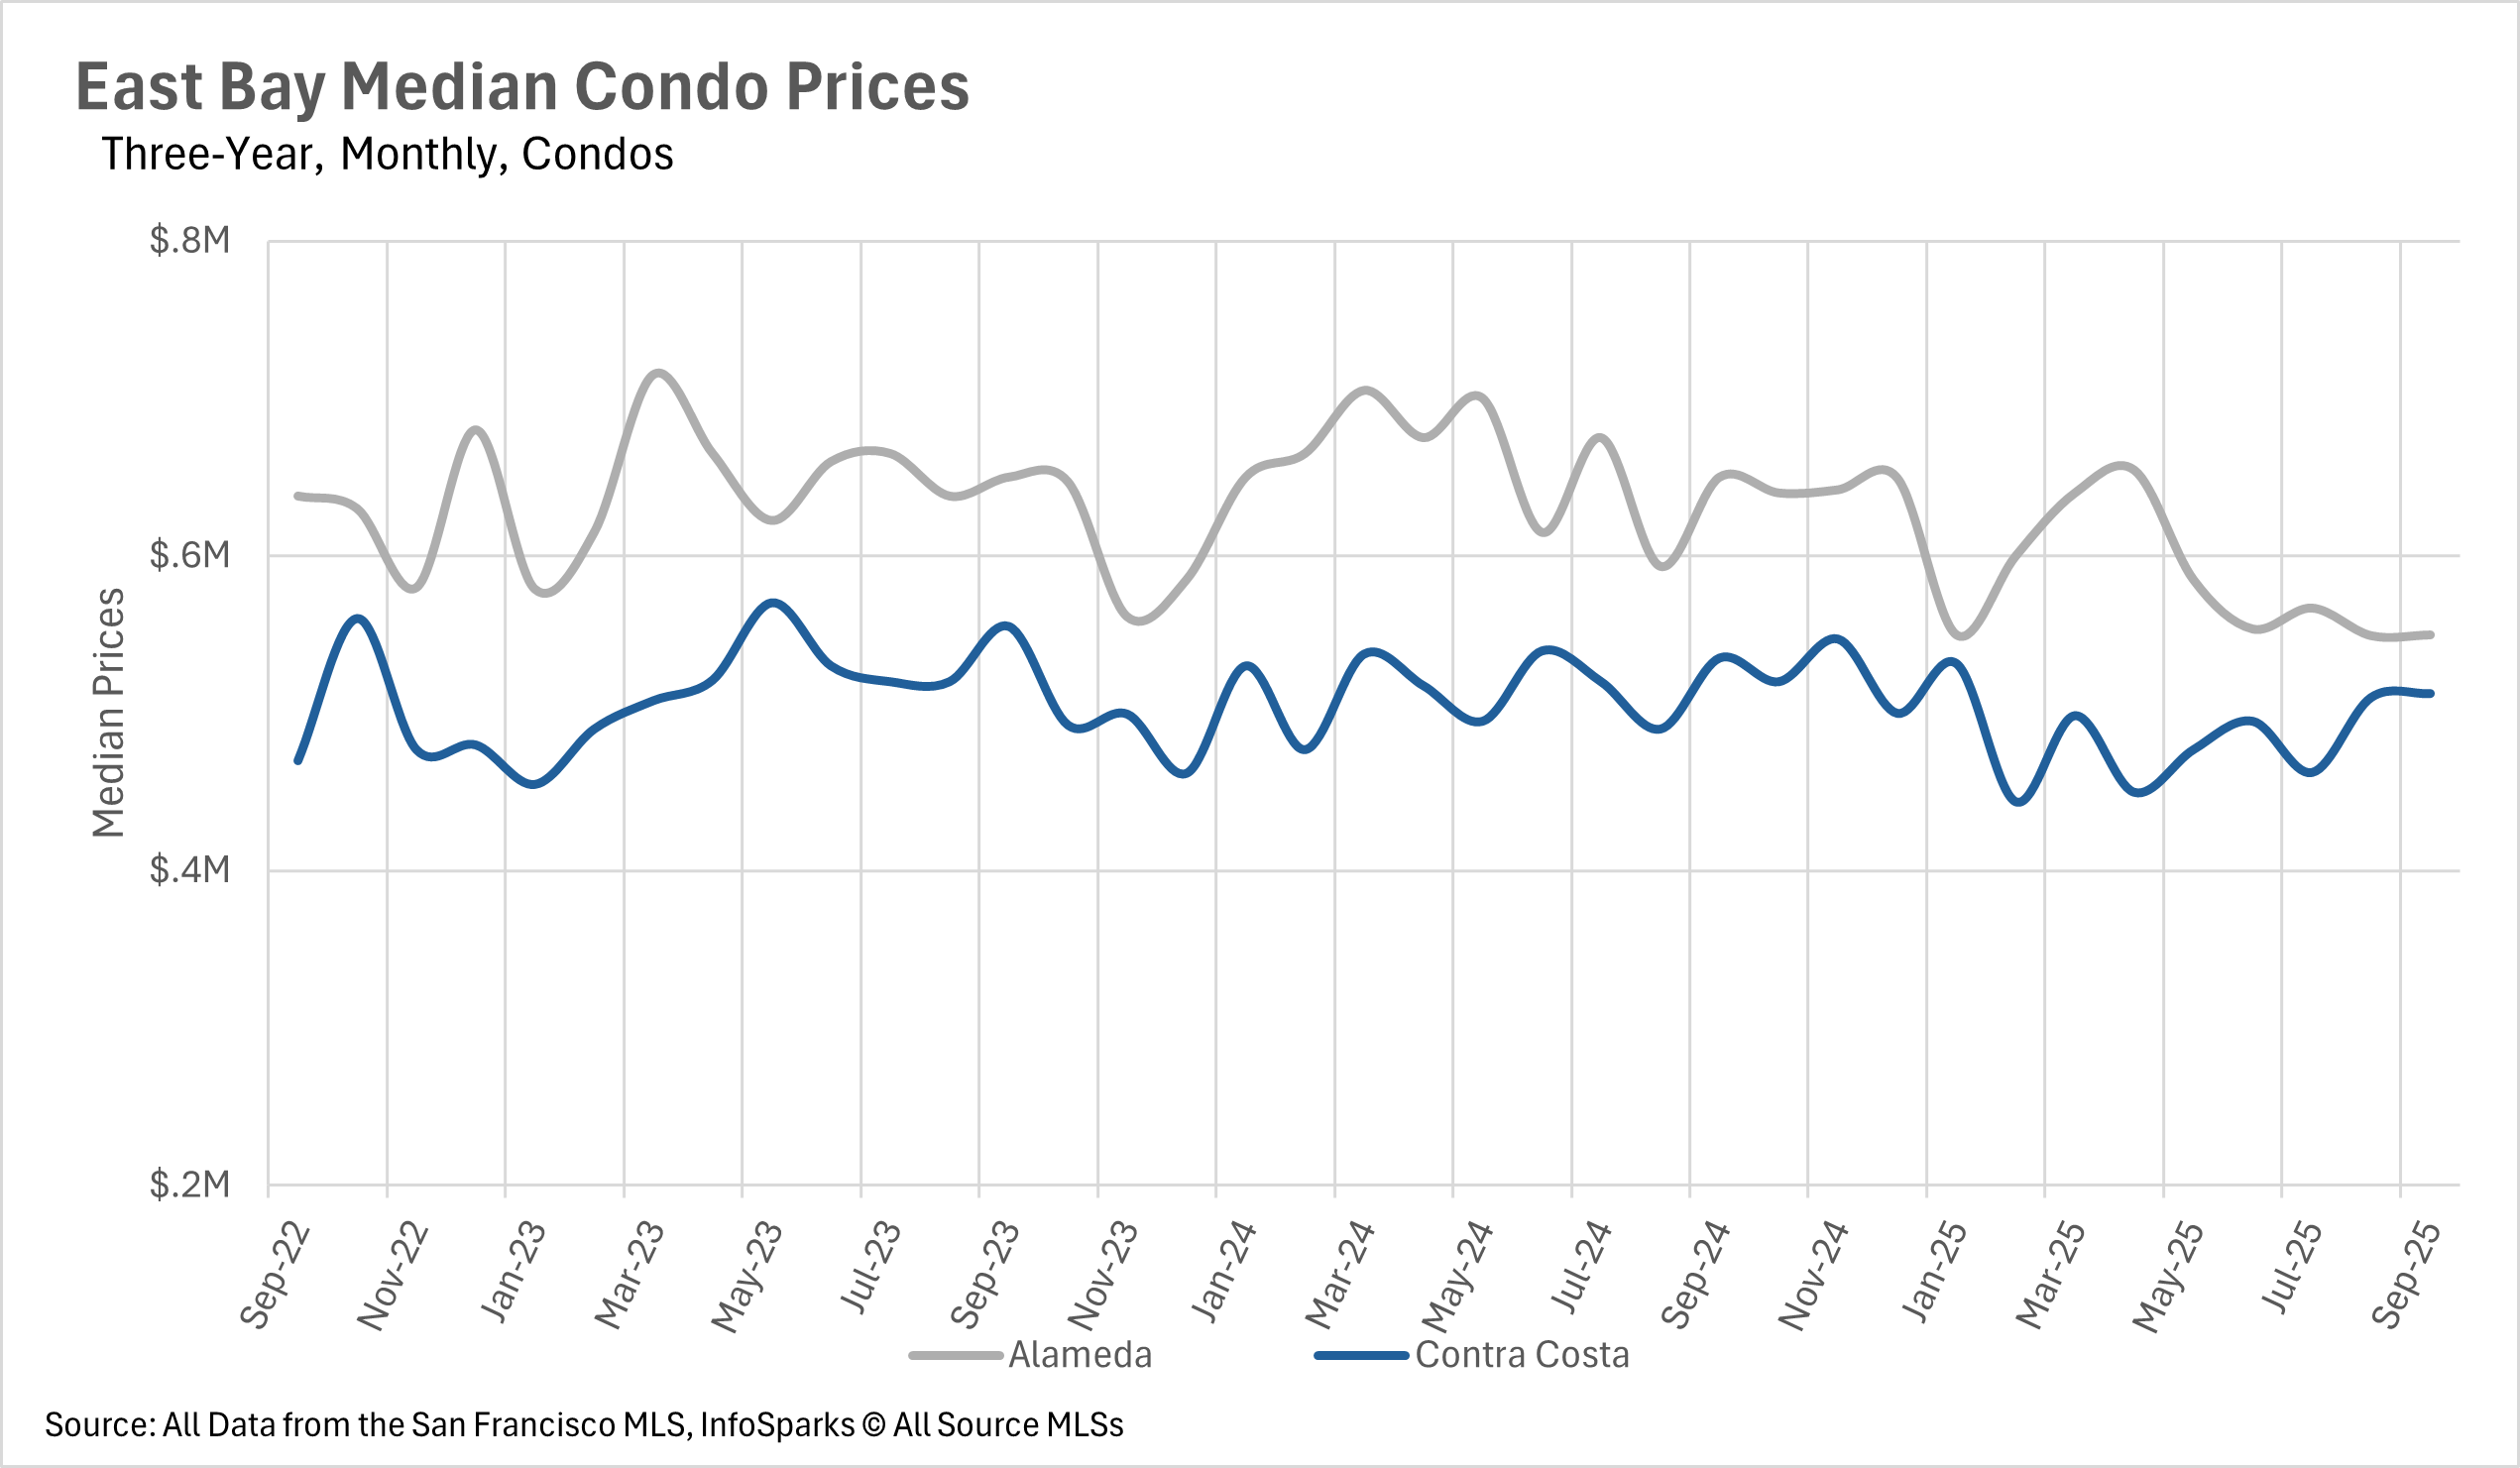
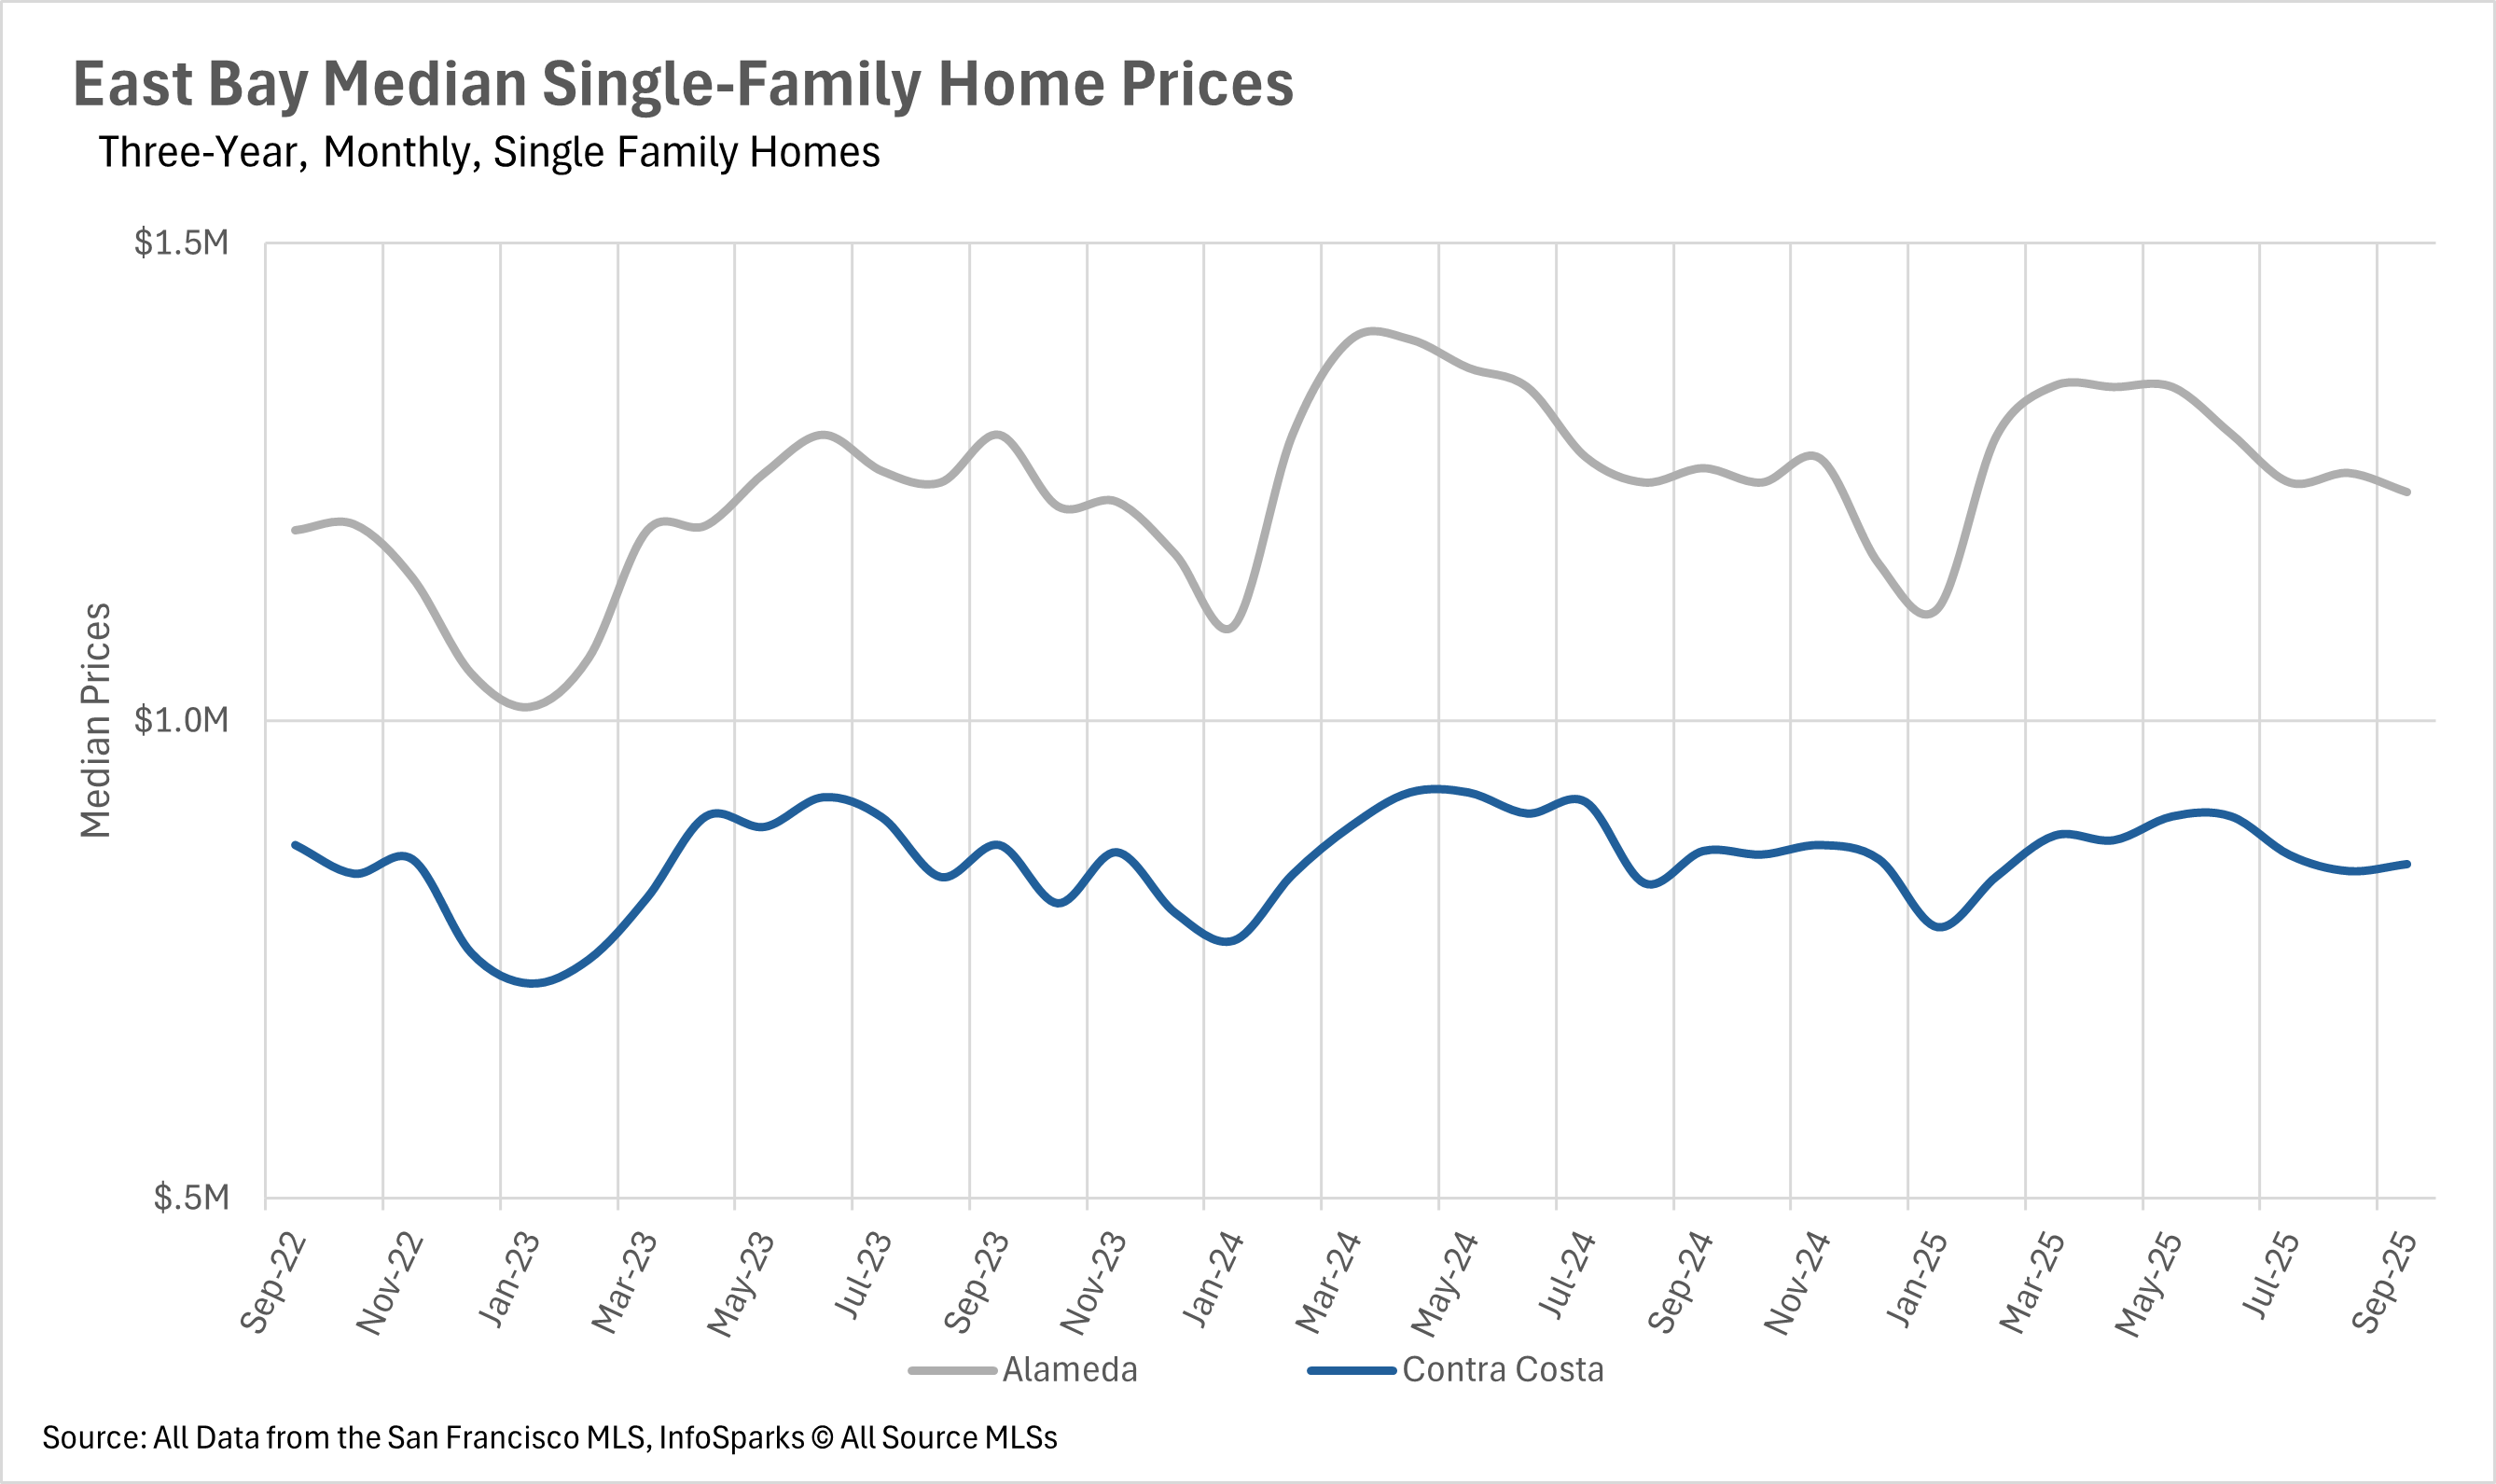
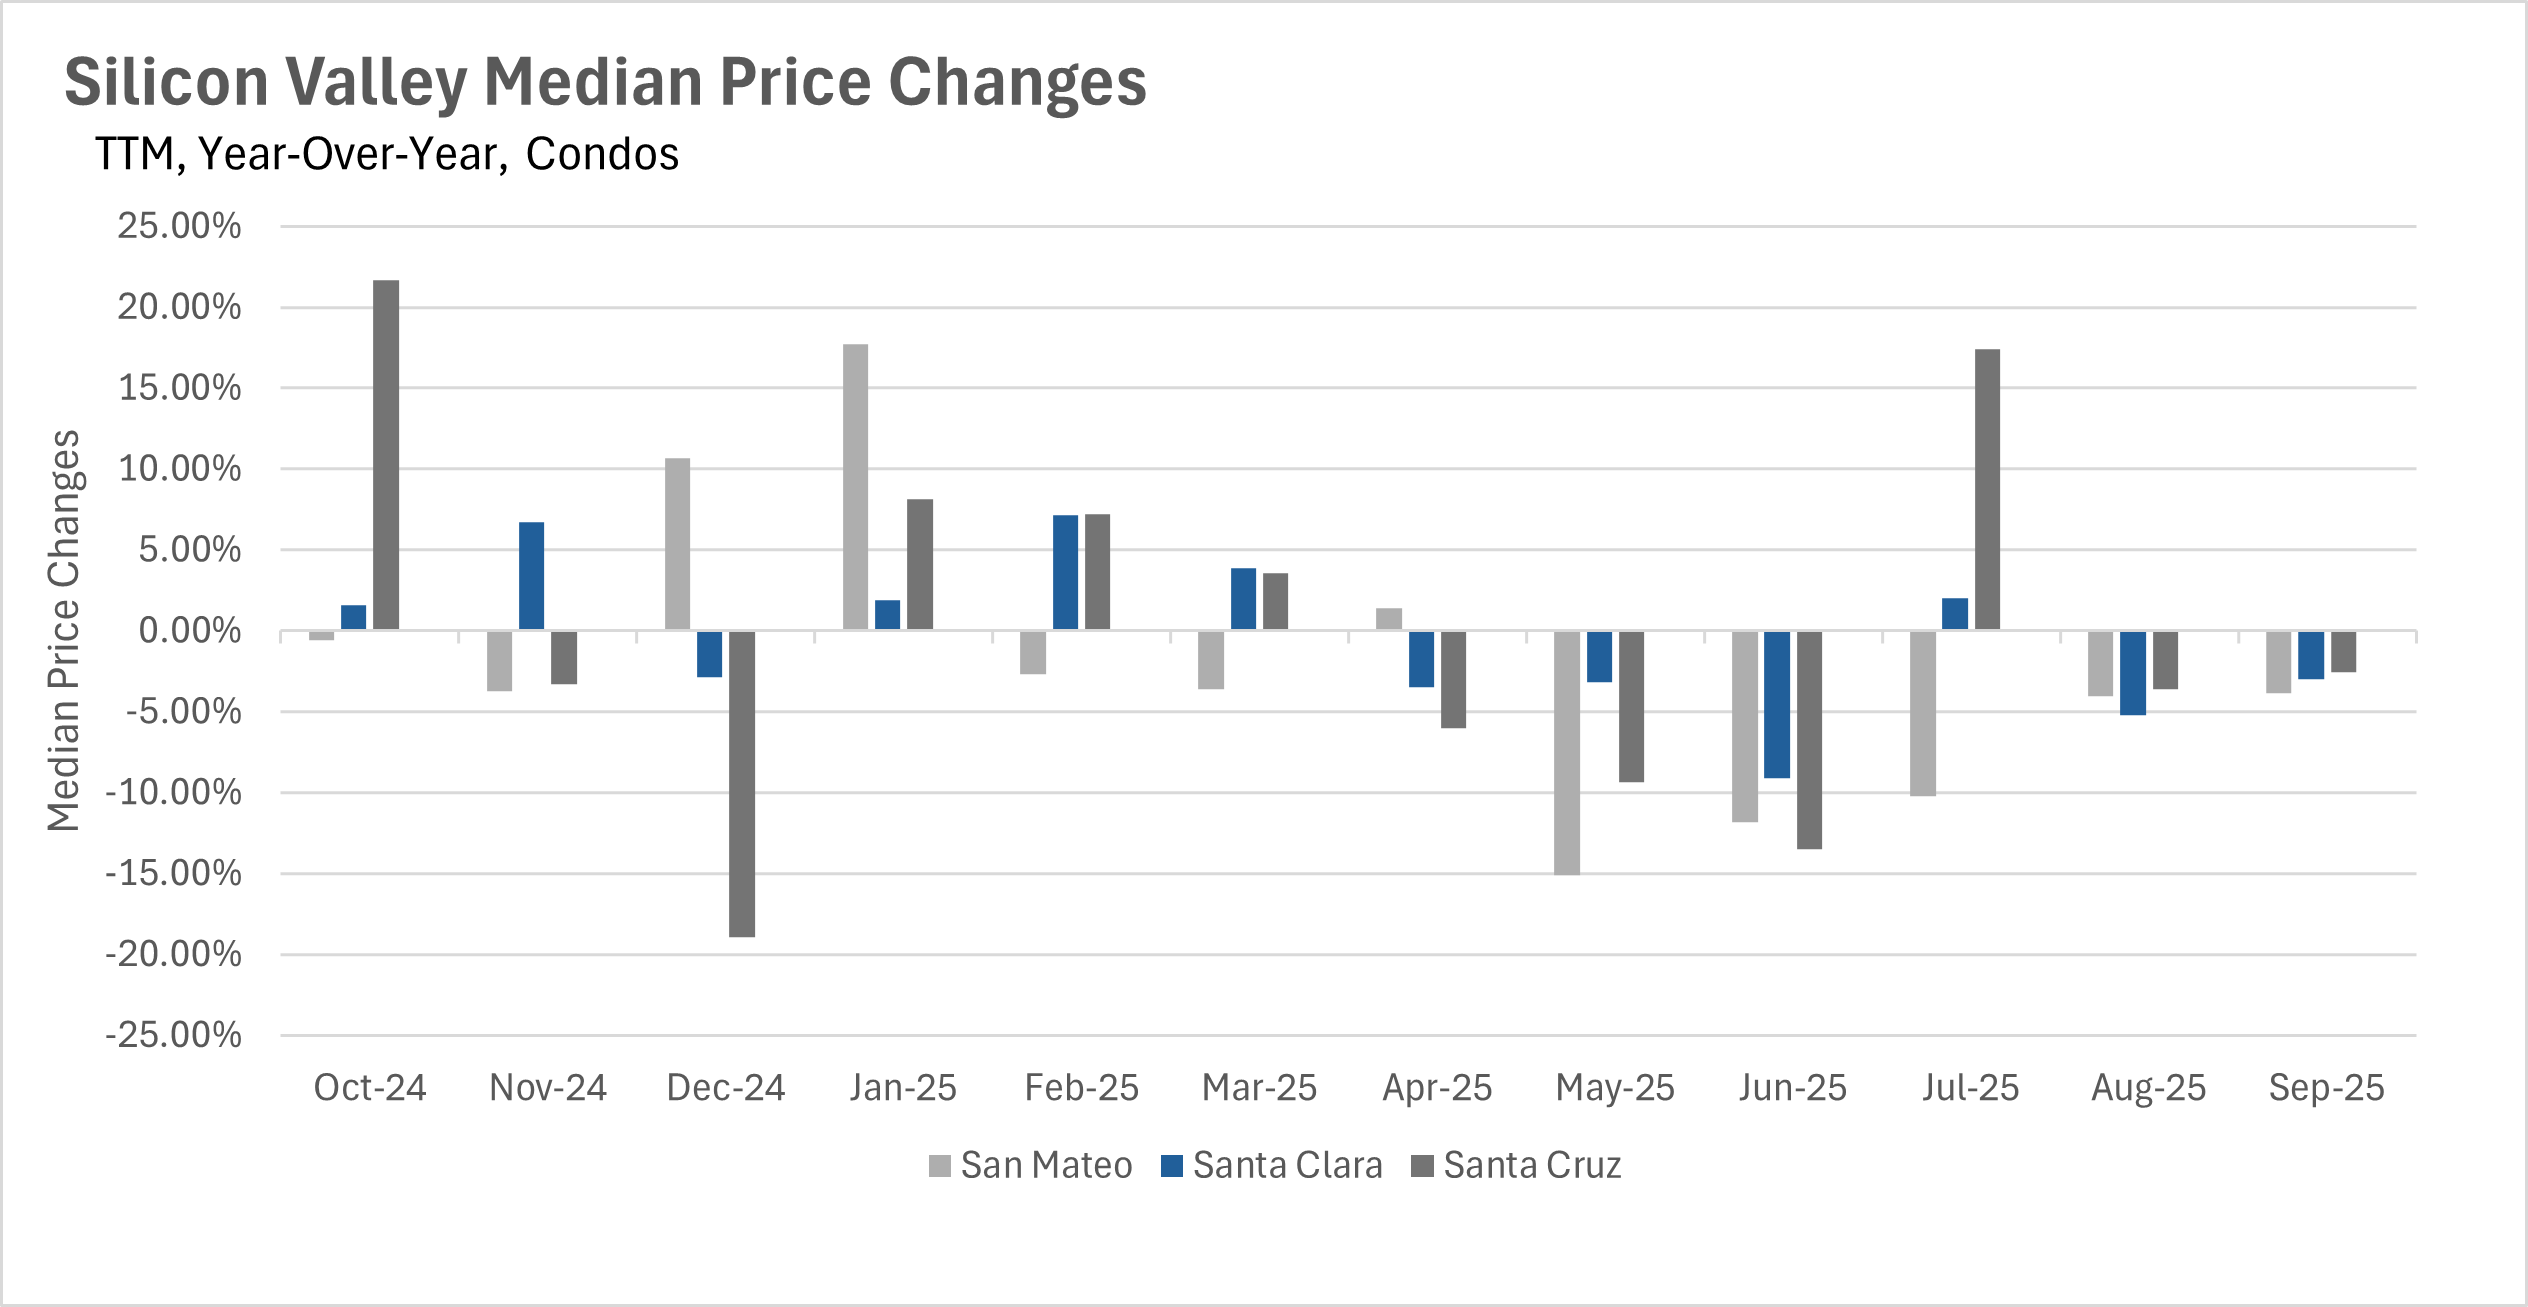
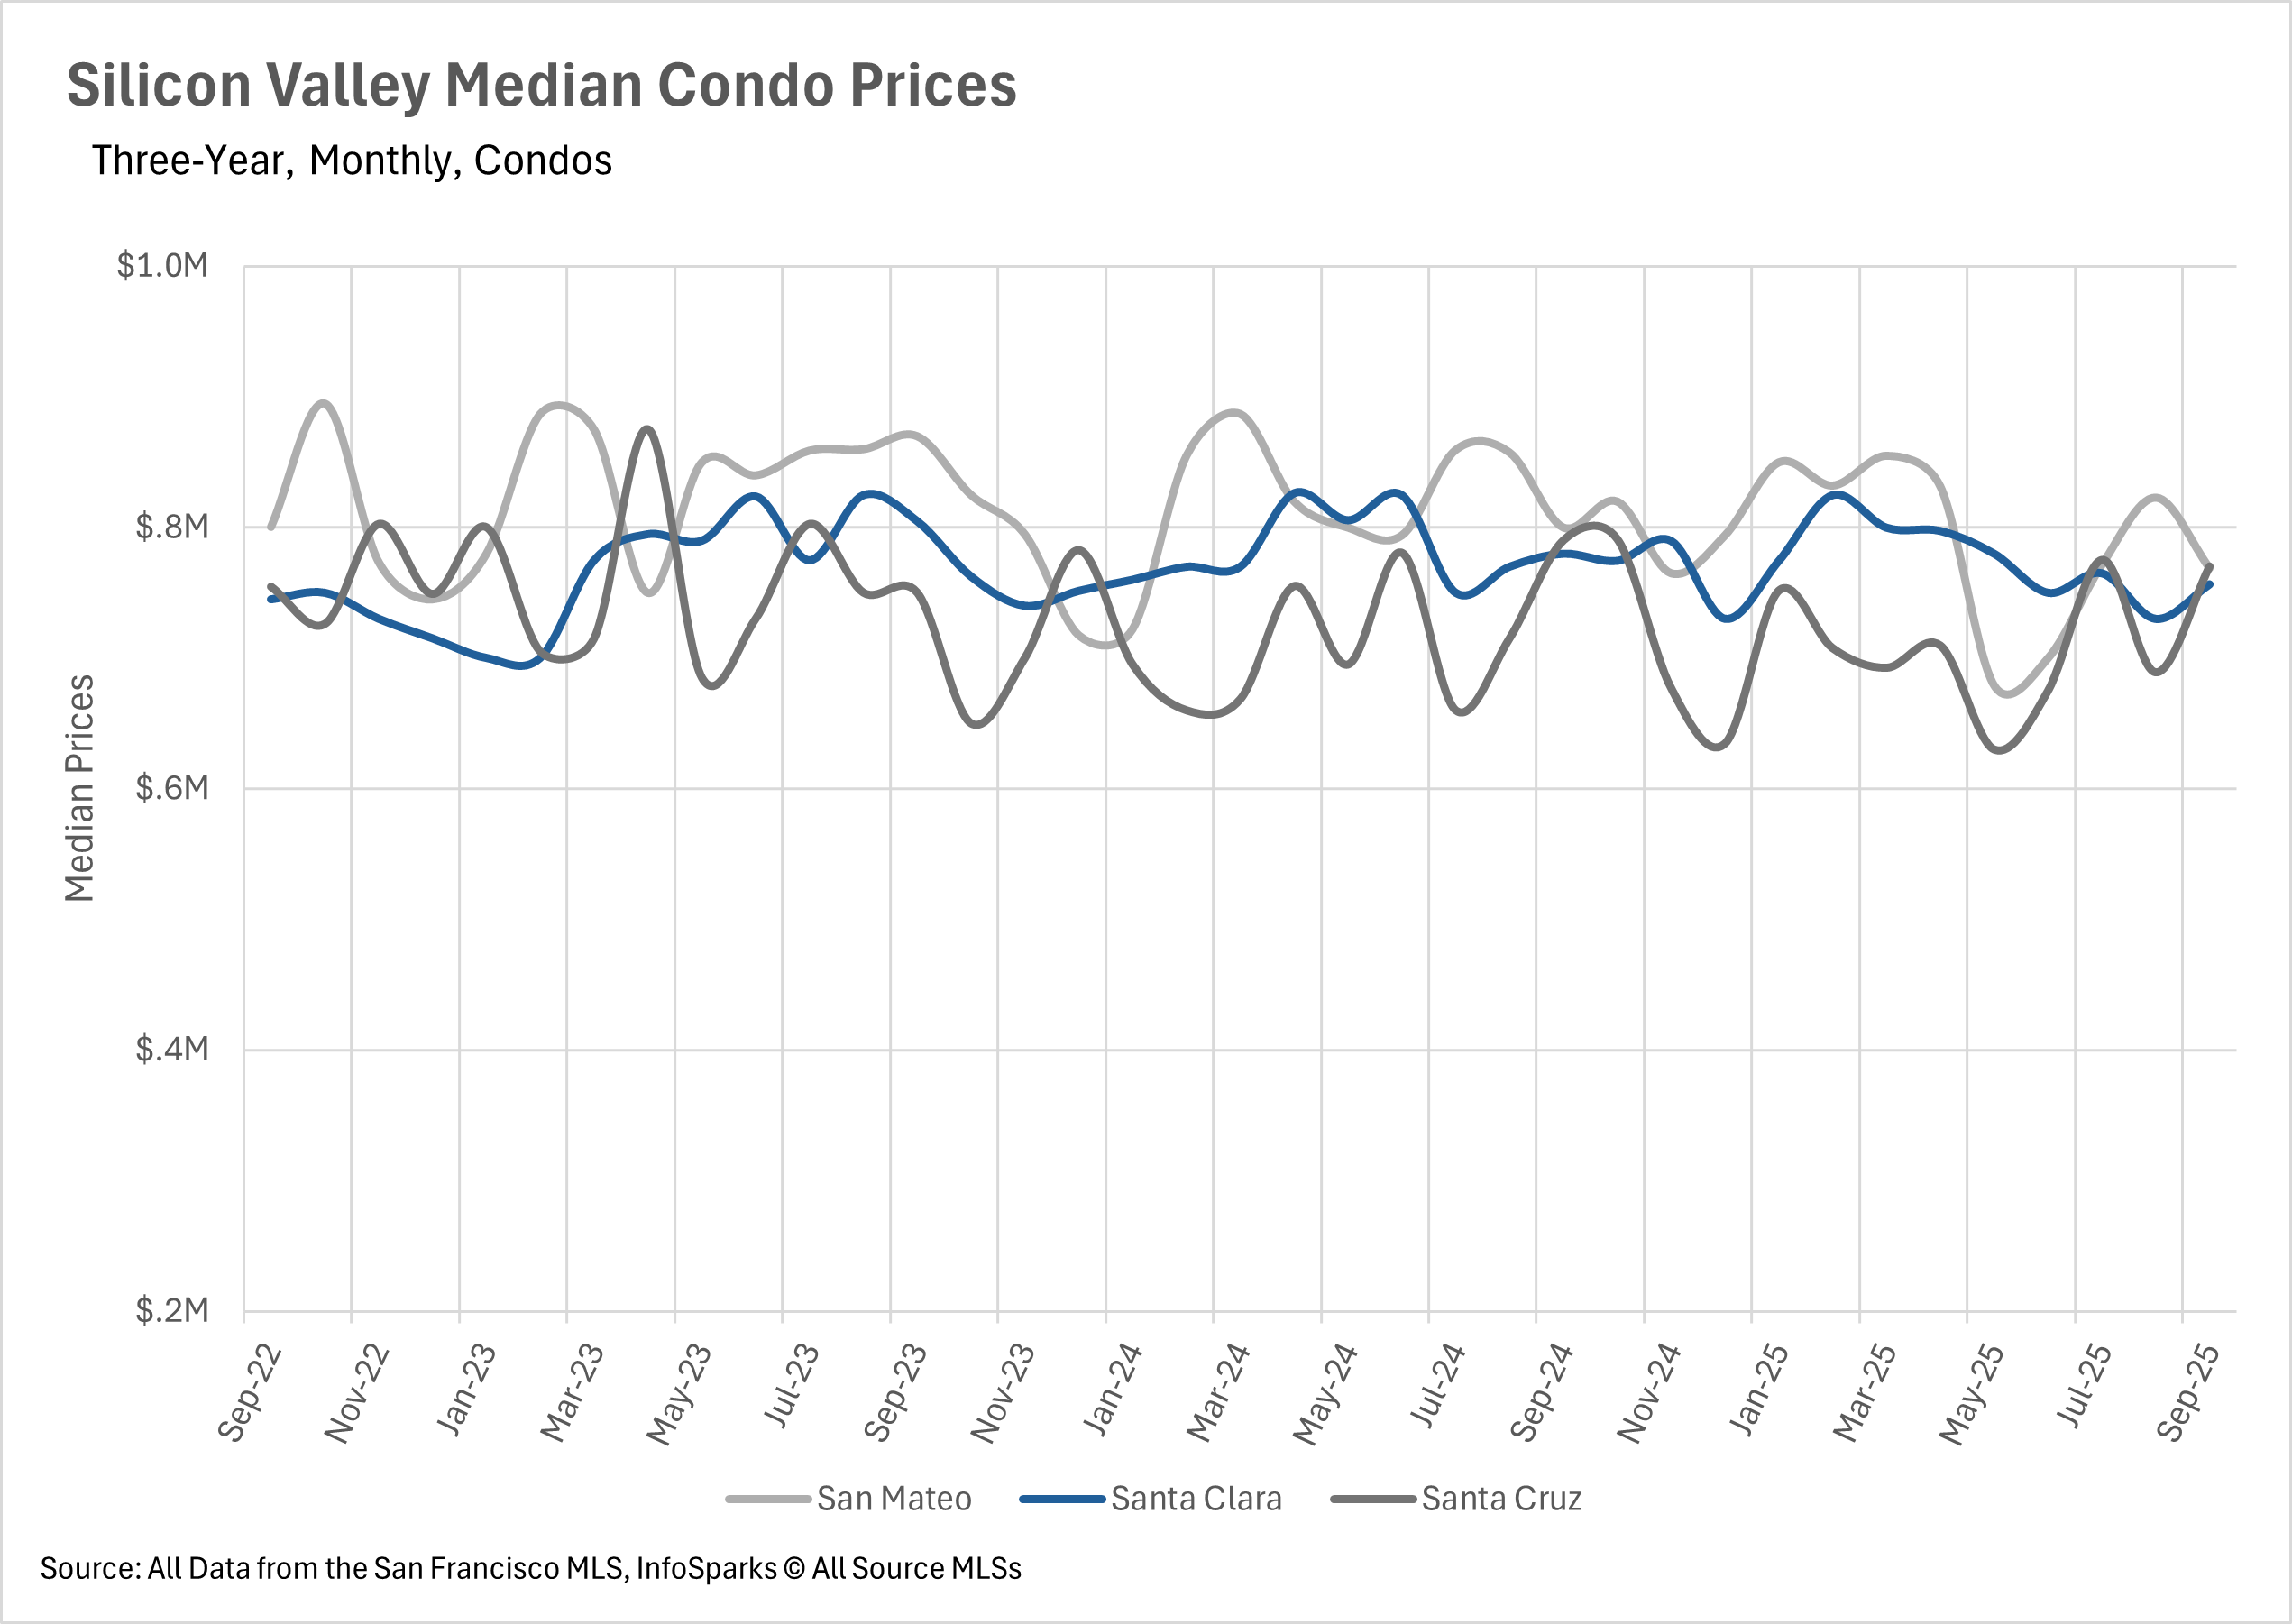
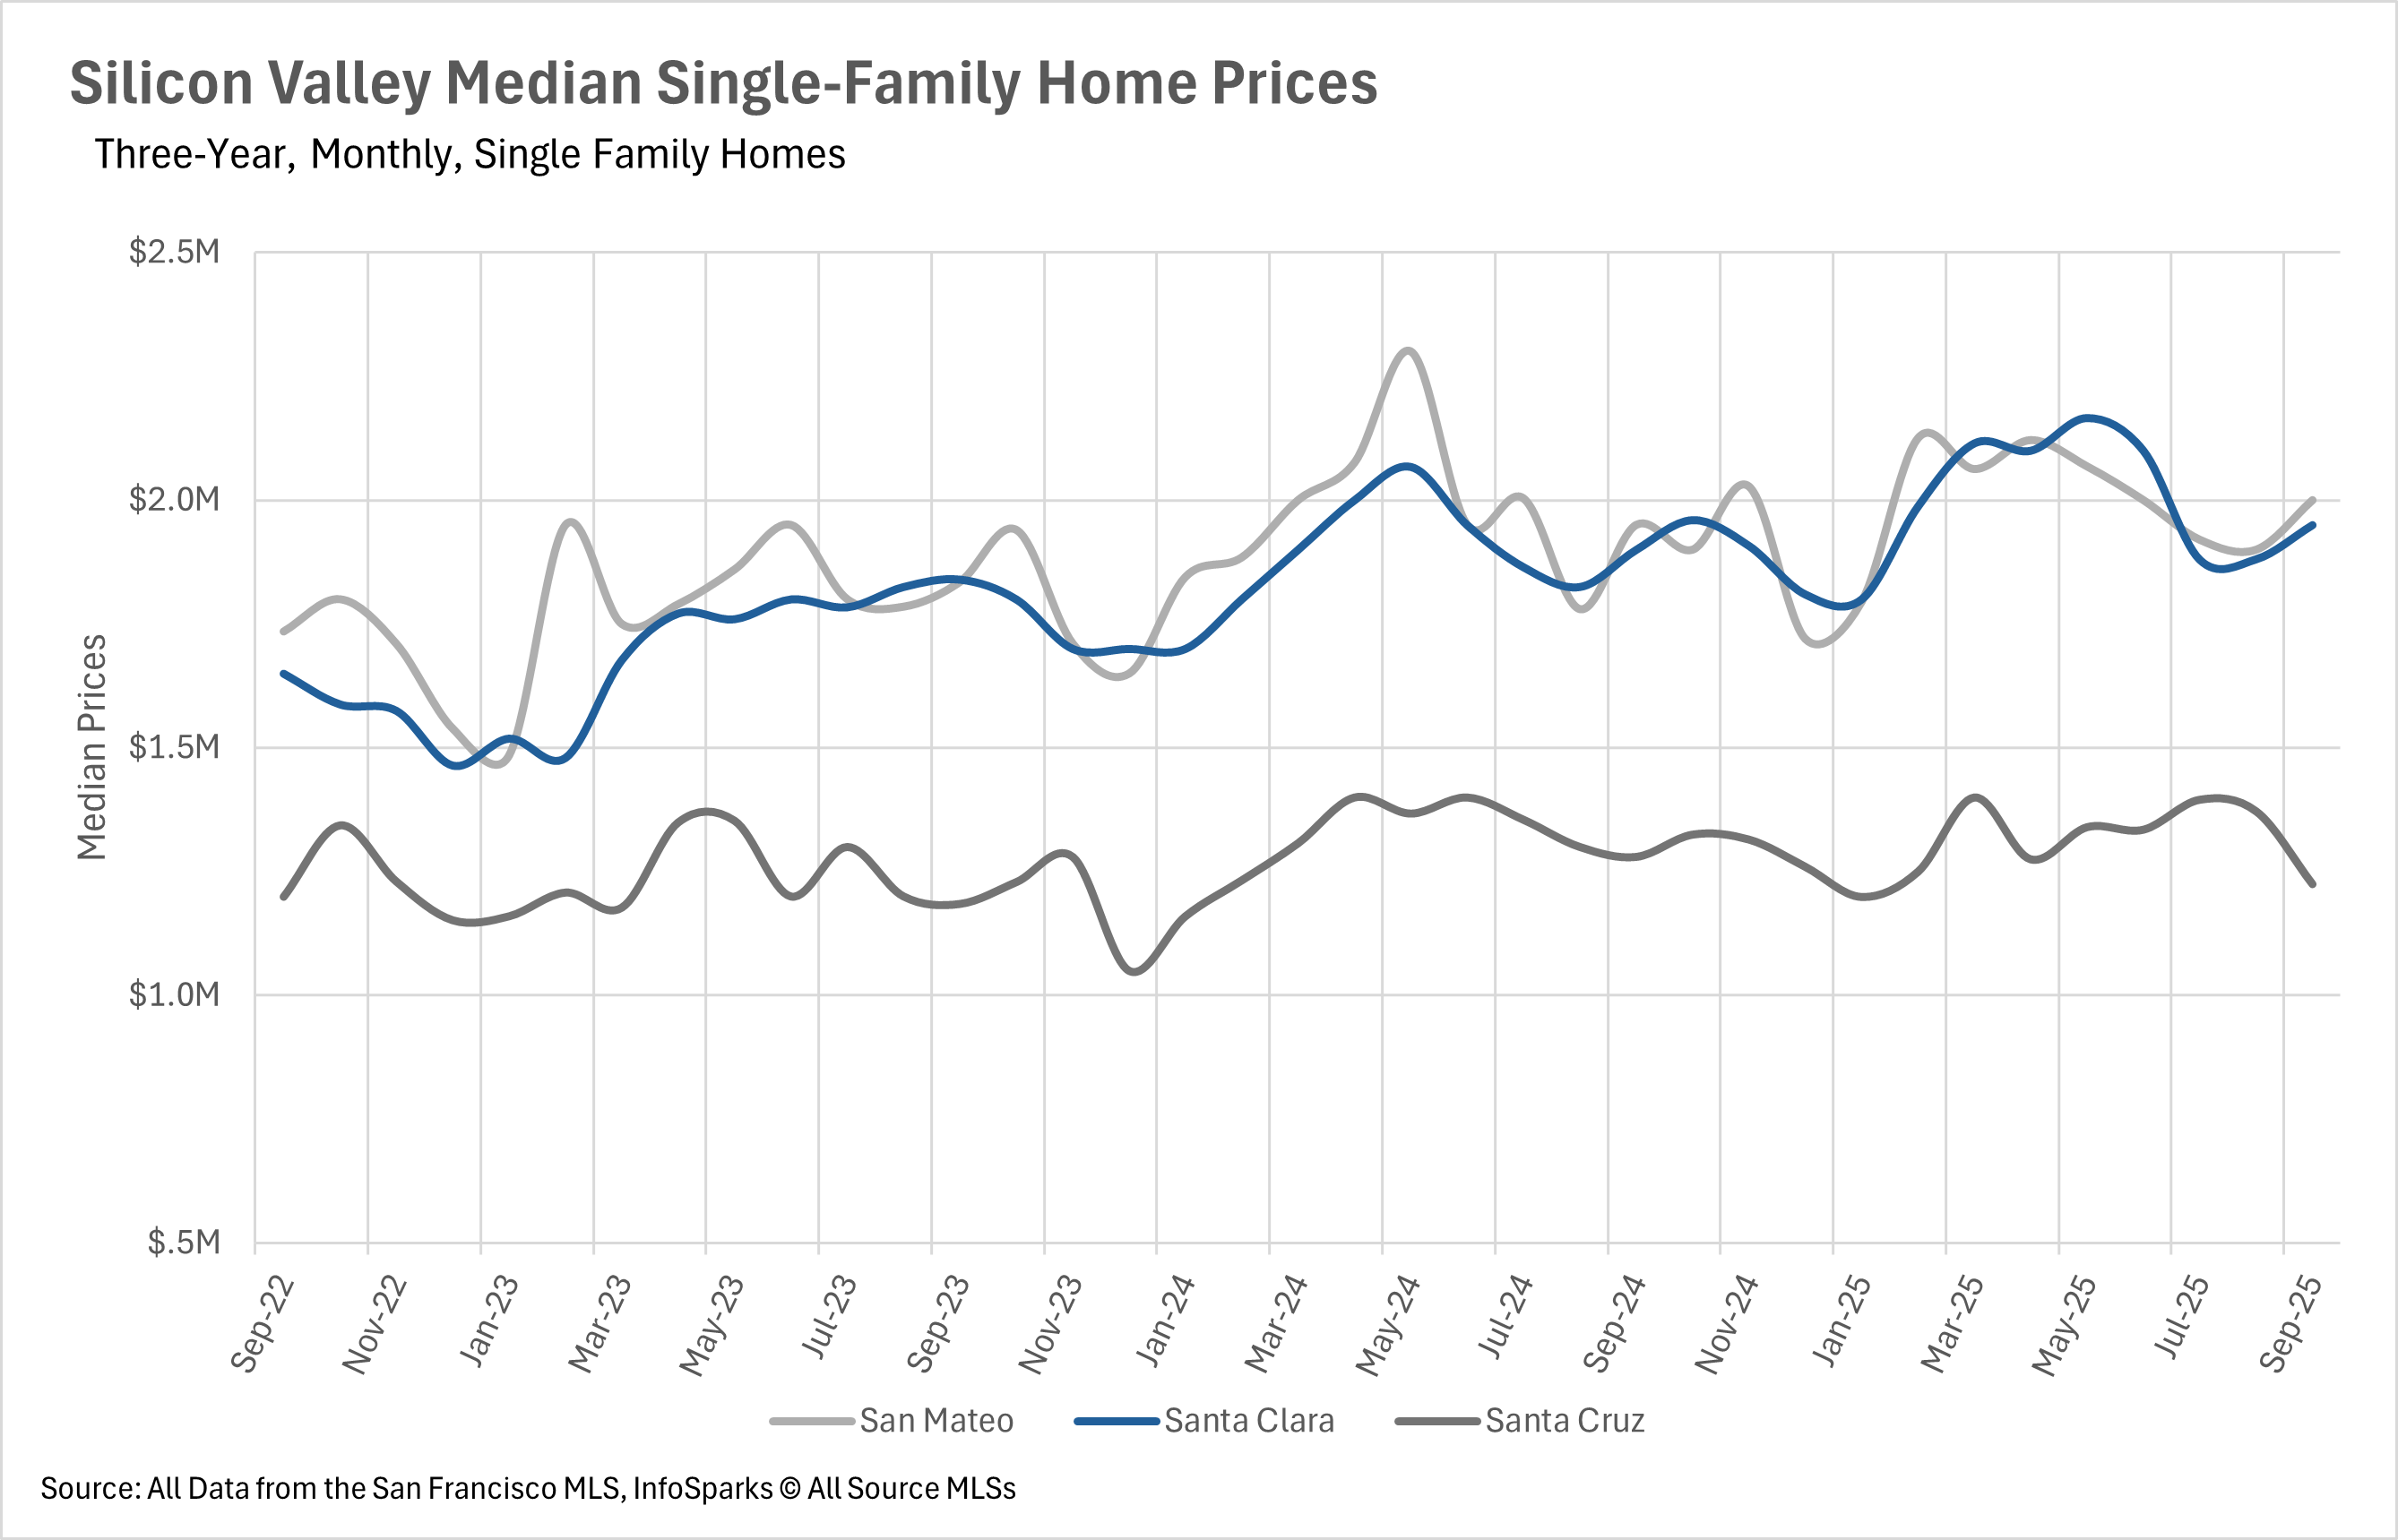
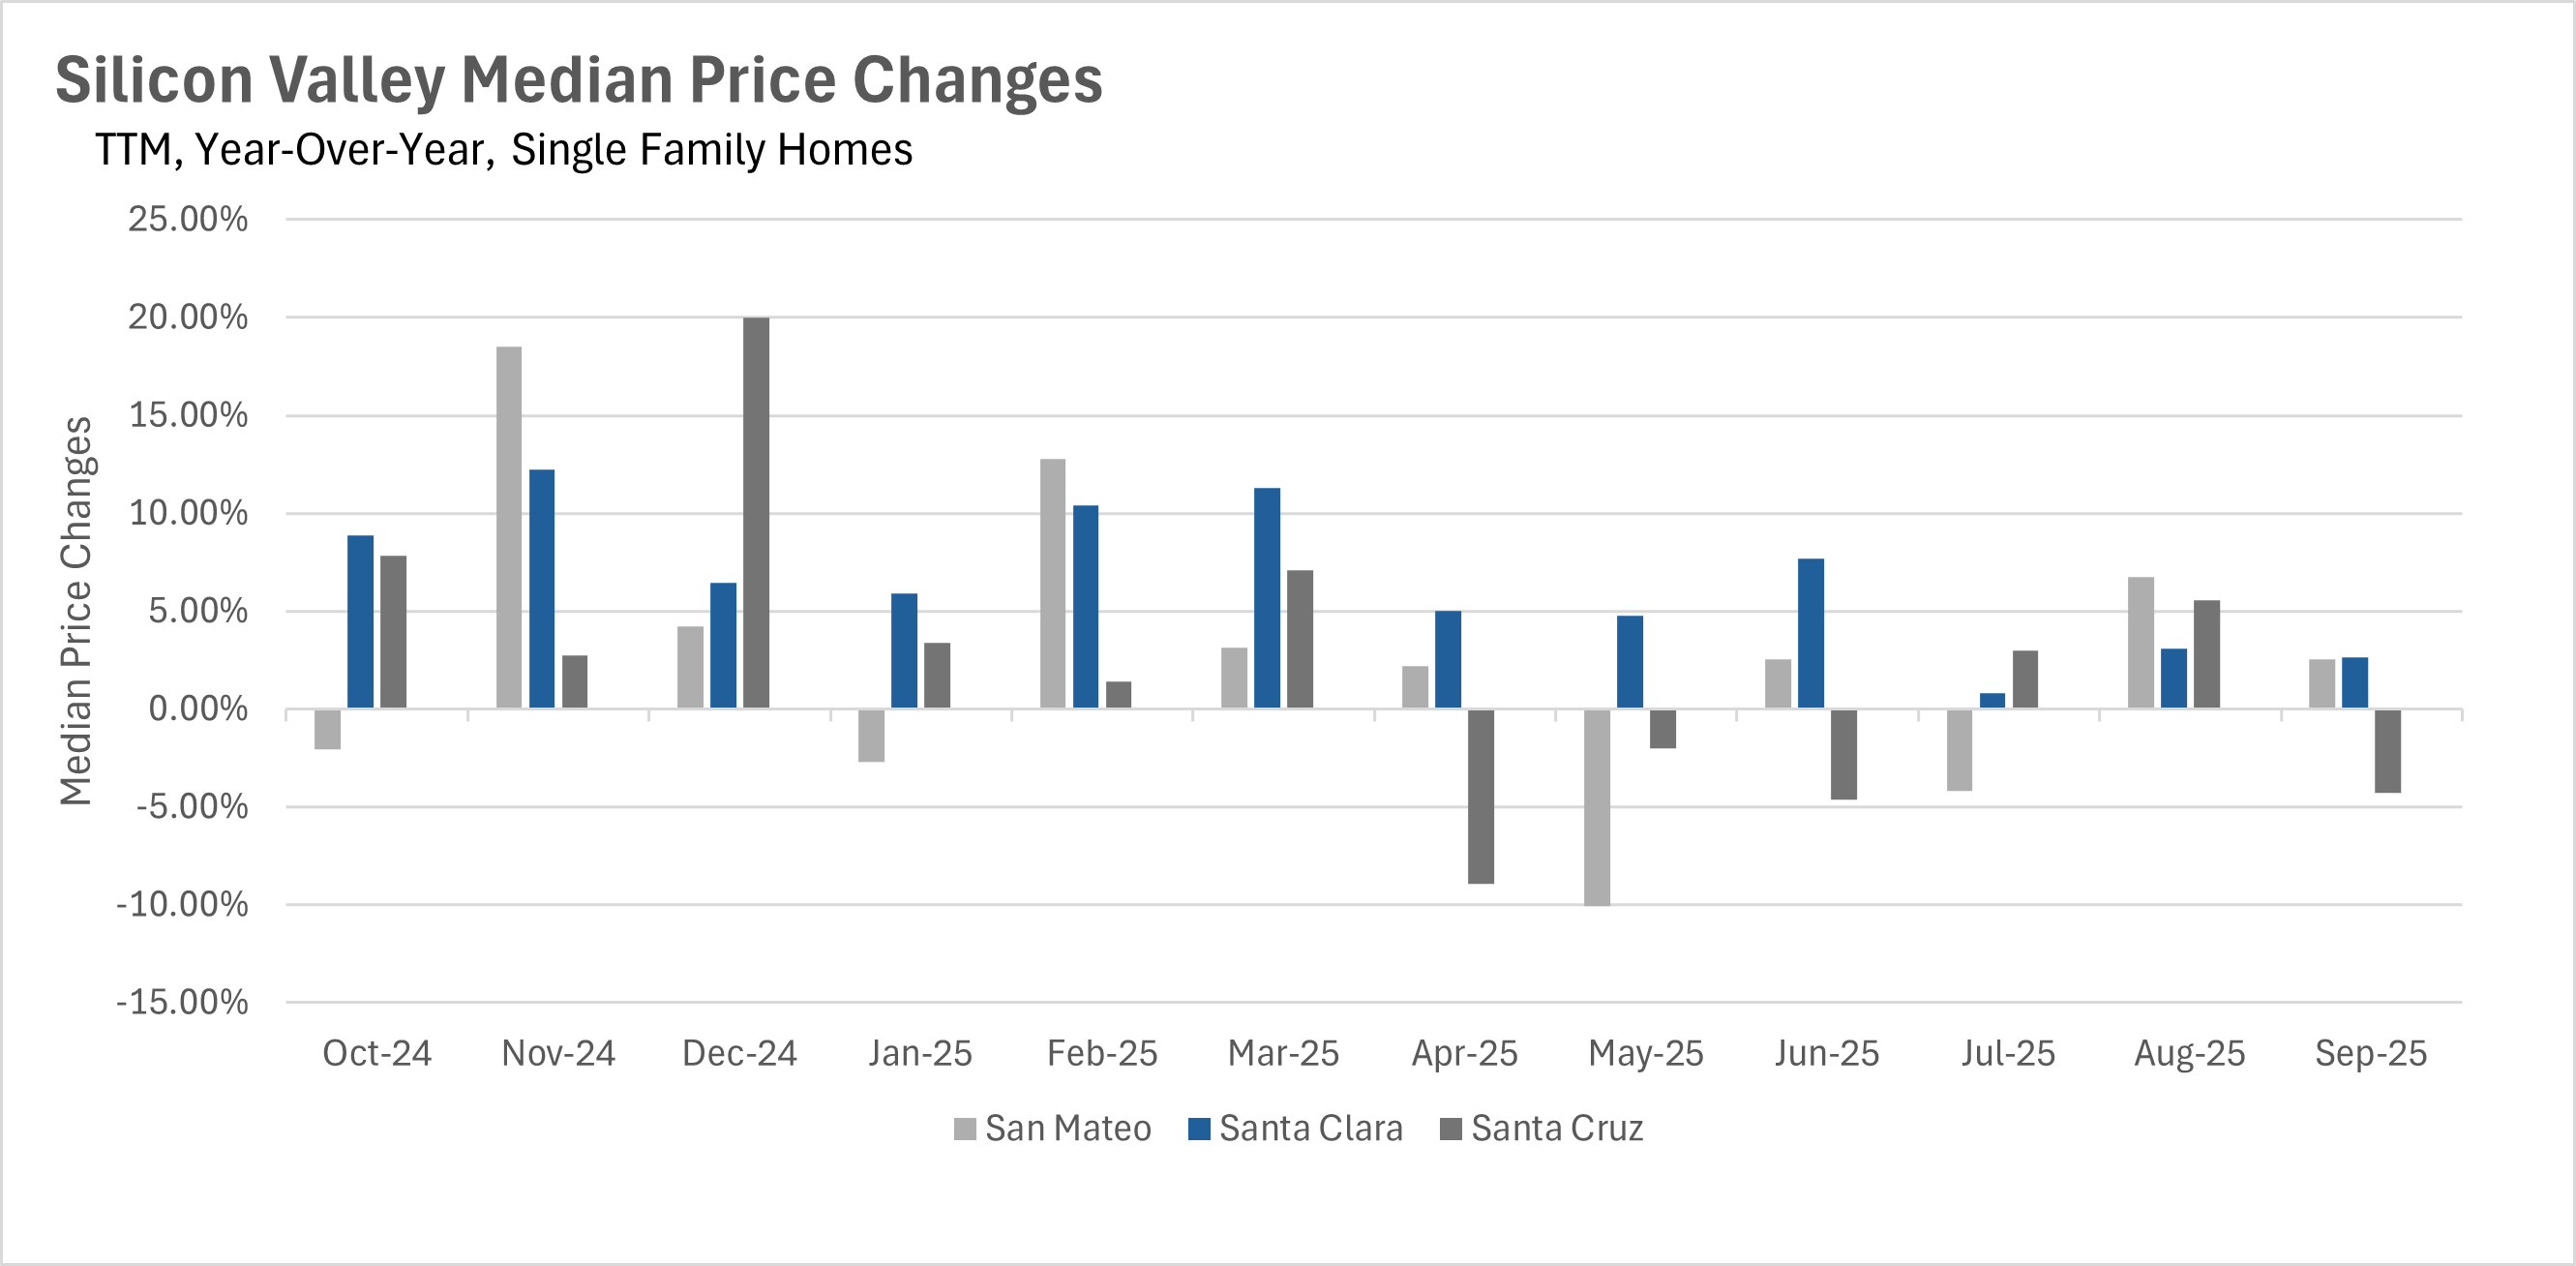
September showcased divergent price trends across the Bay Area, with San Francisco experiencing a dramatic surge while other regions maintained relative stability. San Francisco's single-family home market jumped 7.76% year-over-year, marking the largest increase the market has seen all year, though condos declined 3.29%. Notably, the average San Francisco condo is now selling at a slight premium to listing price for the first time since May. Silicon Valley demonstrated remarkable stability with single-family homes remaining within their historical pricing bands - San Mateo and Santa Clara Counties posted modest gains of 2.56% and 2.63% respectively, while Santa Cruz County declined 4.30%.
 
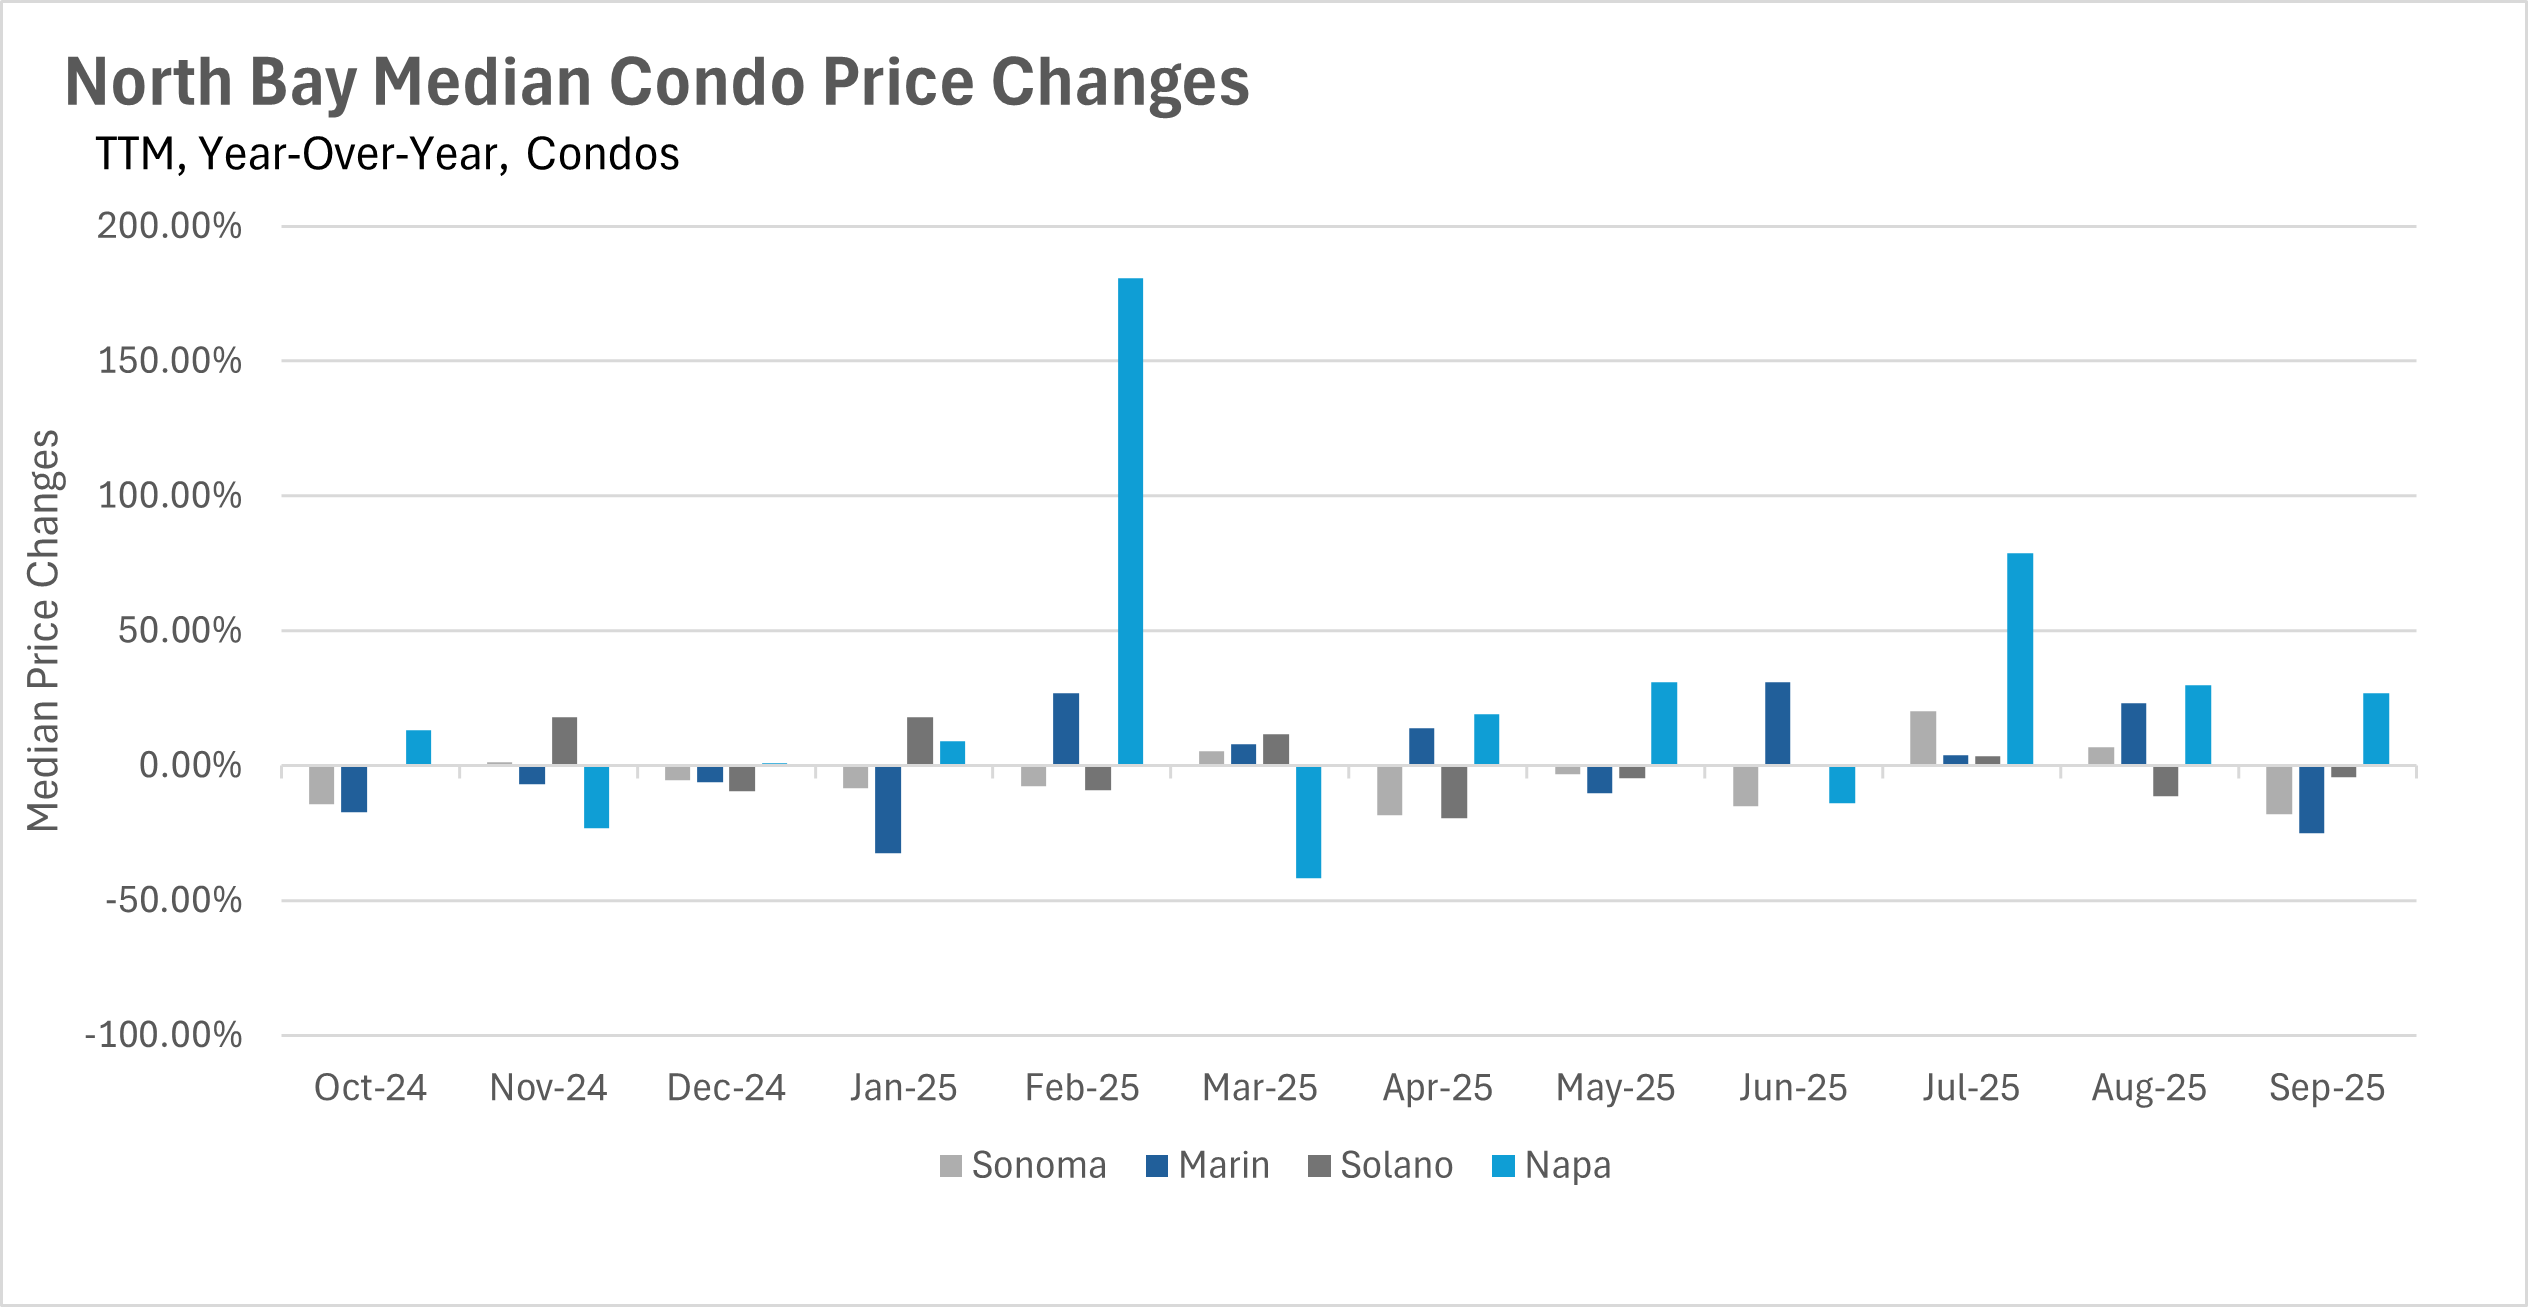
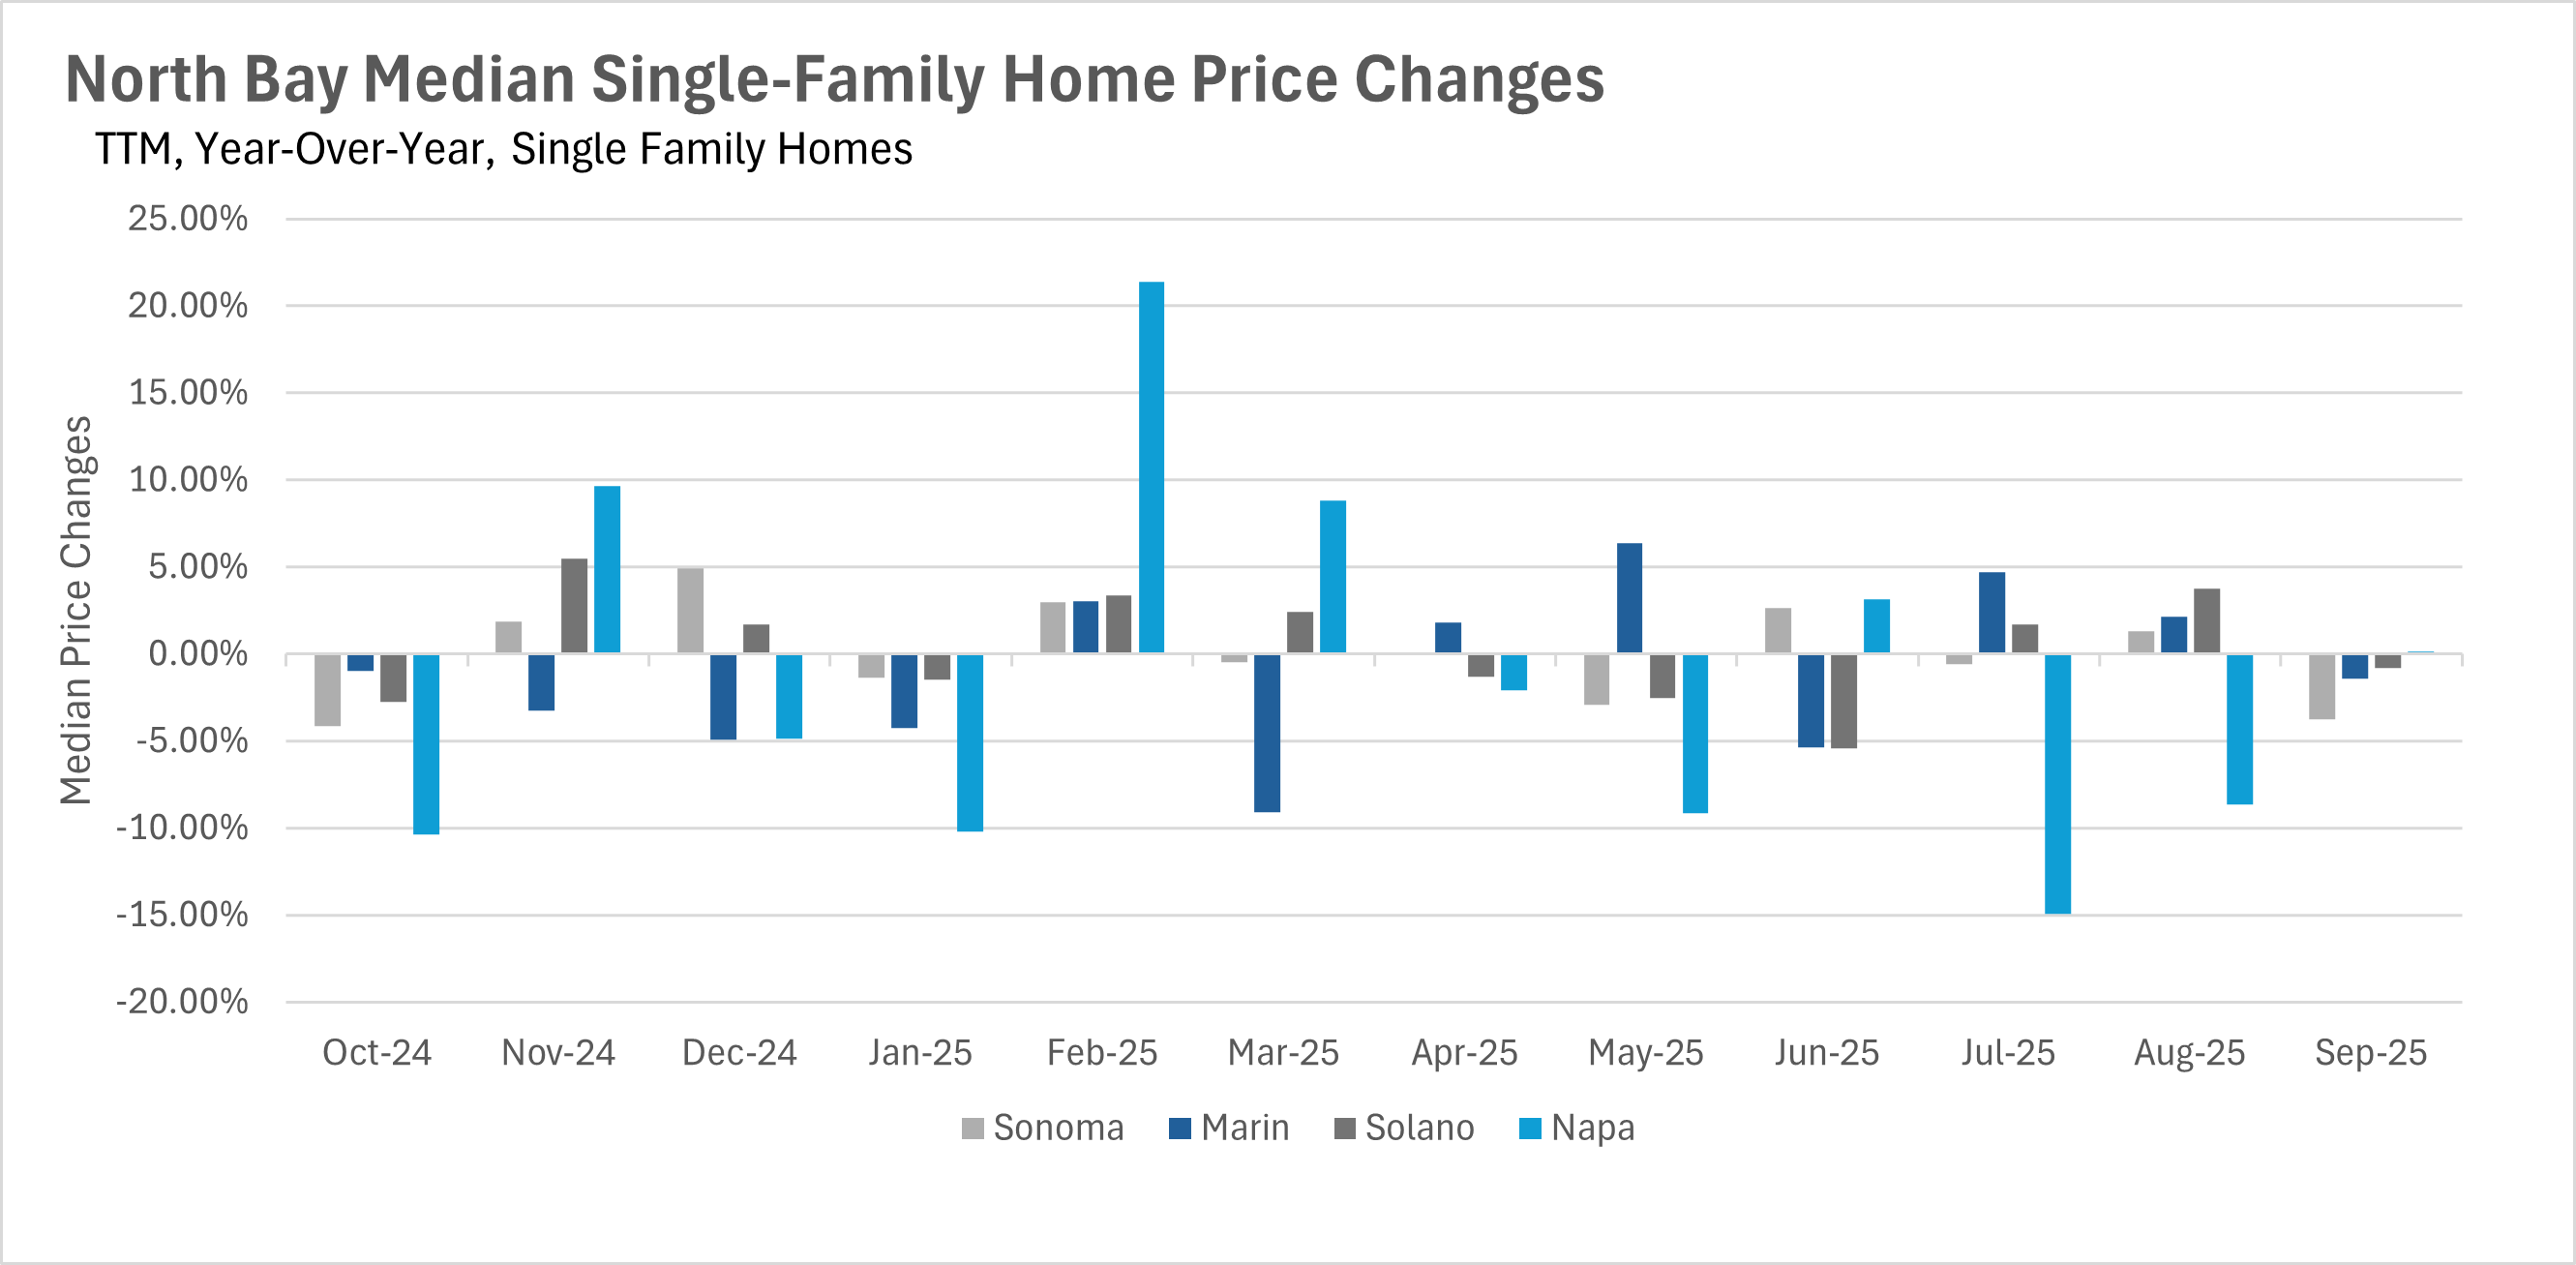
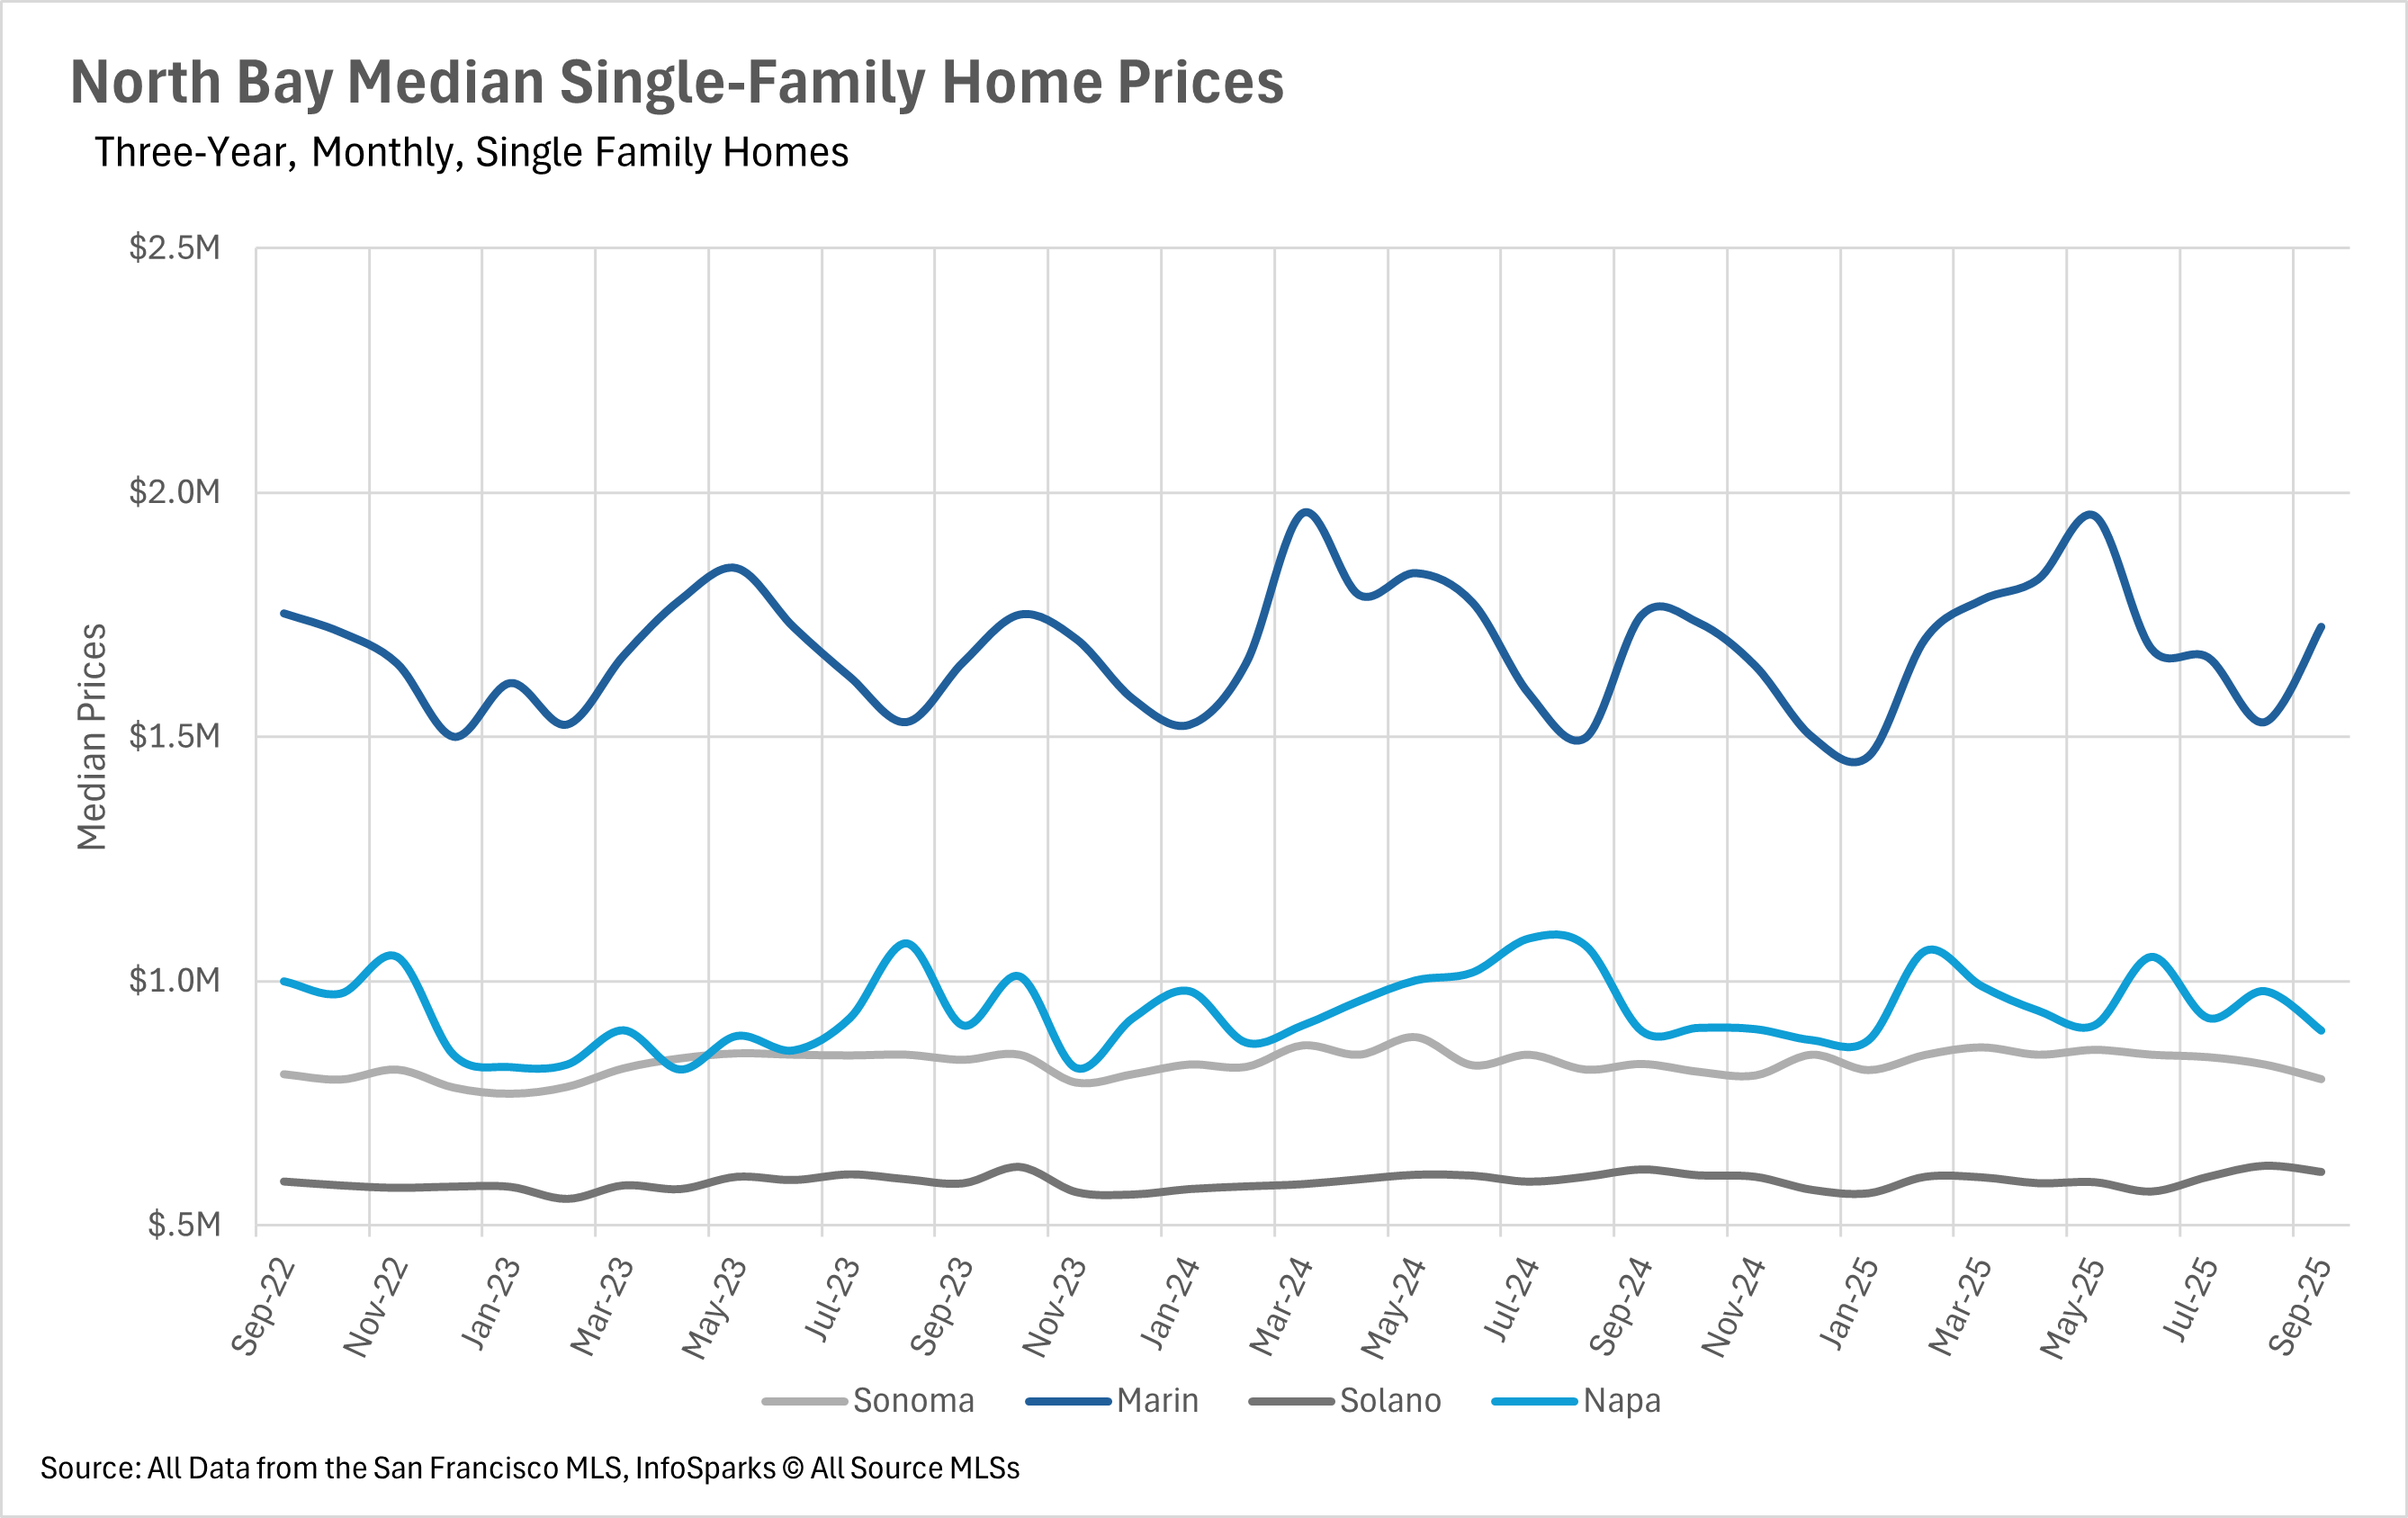
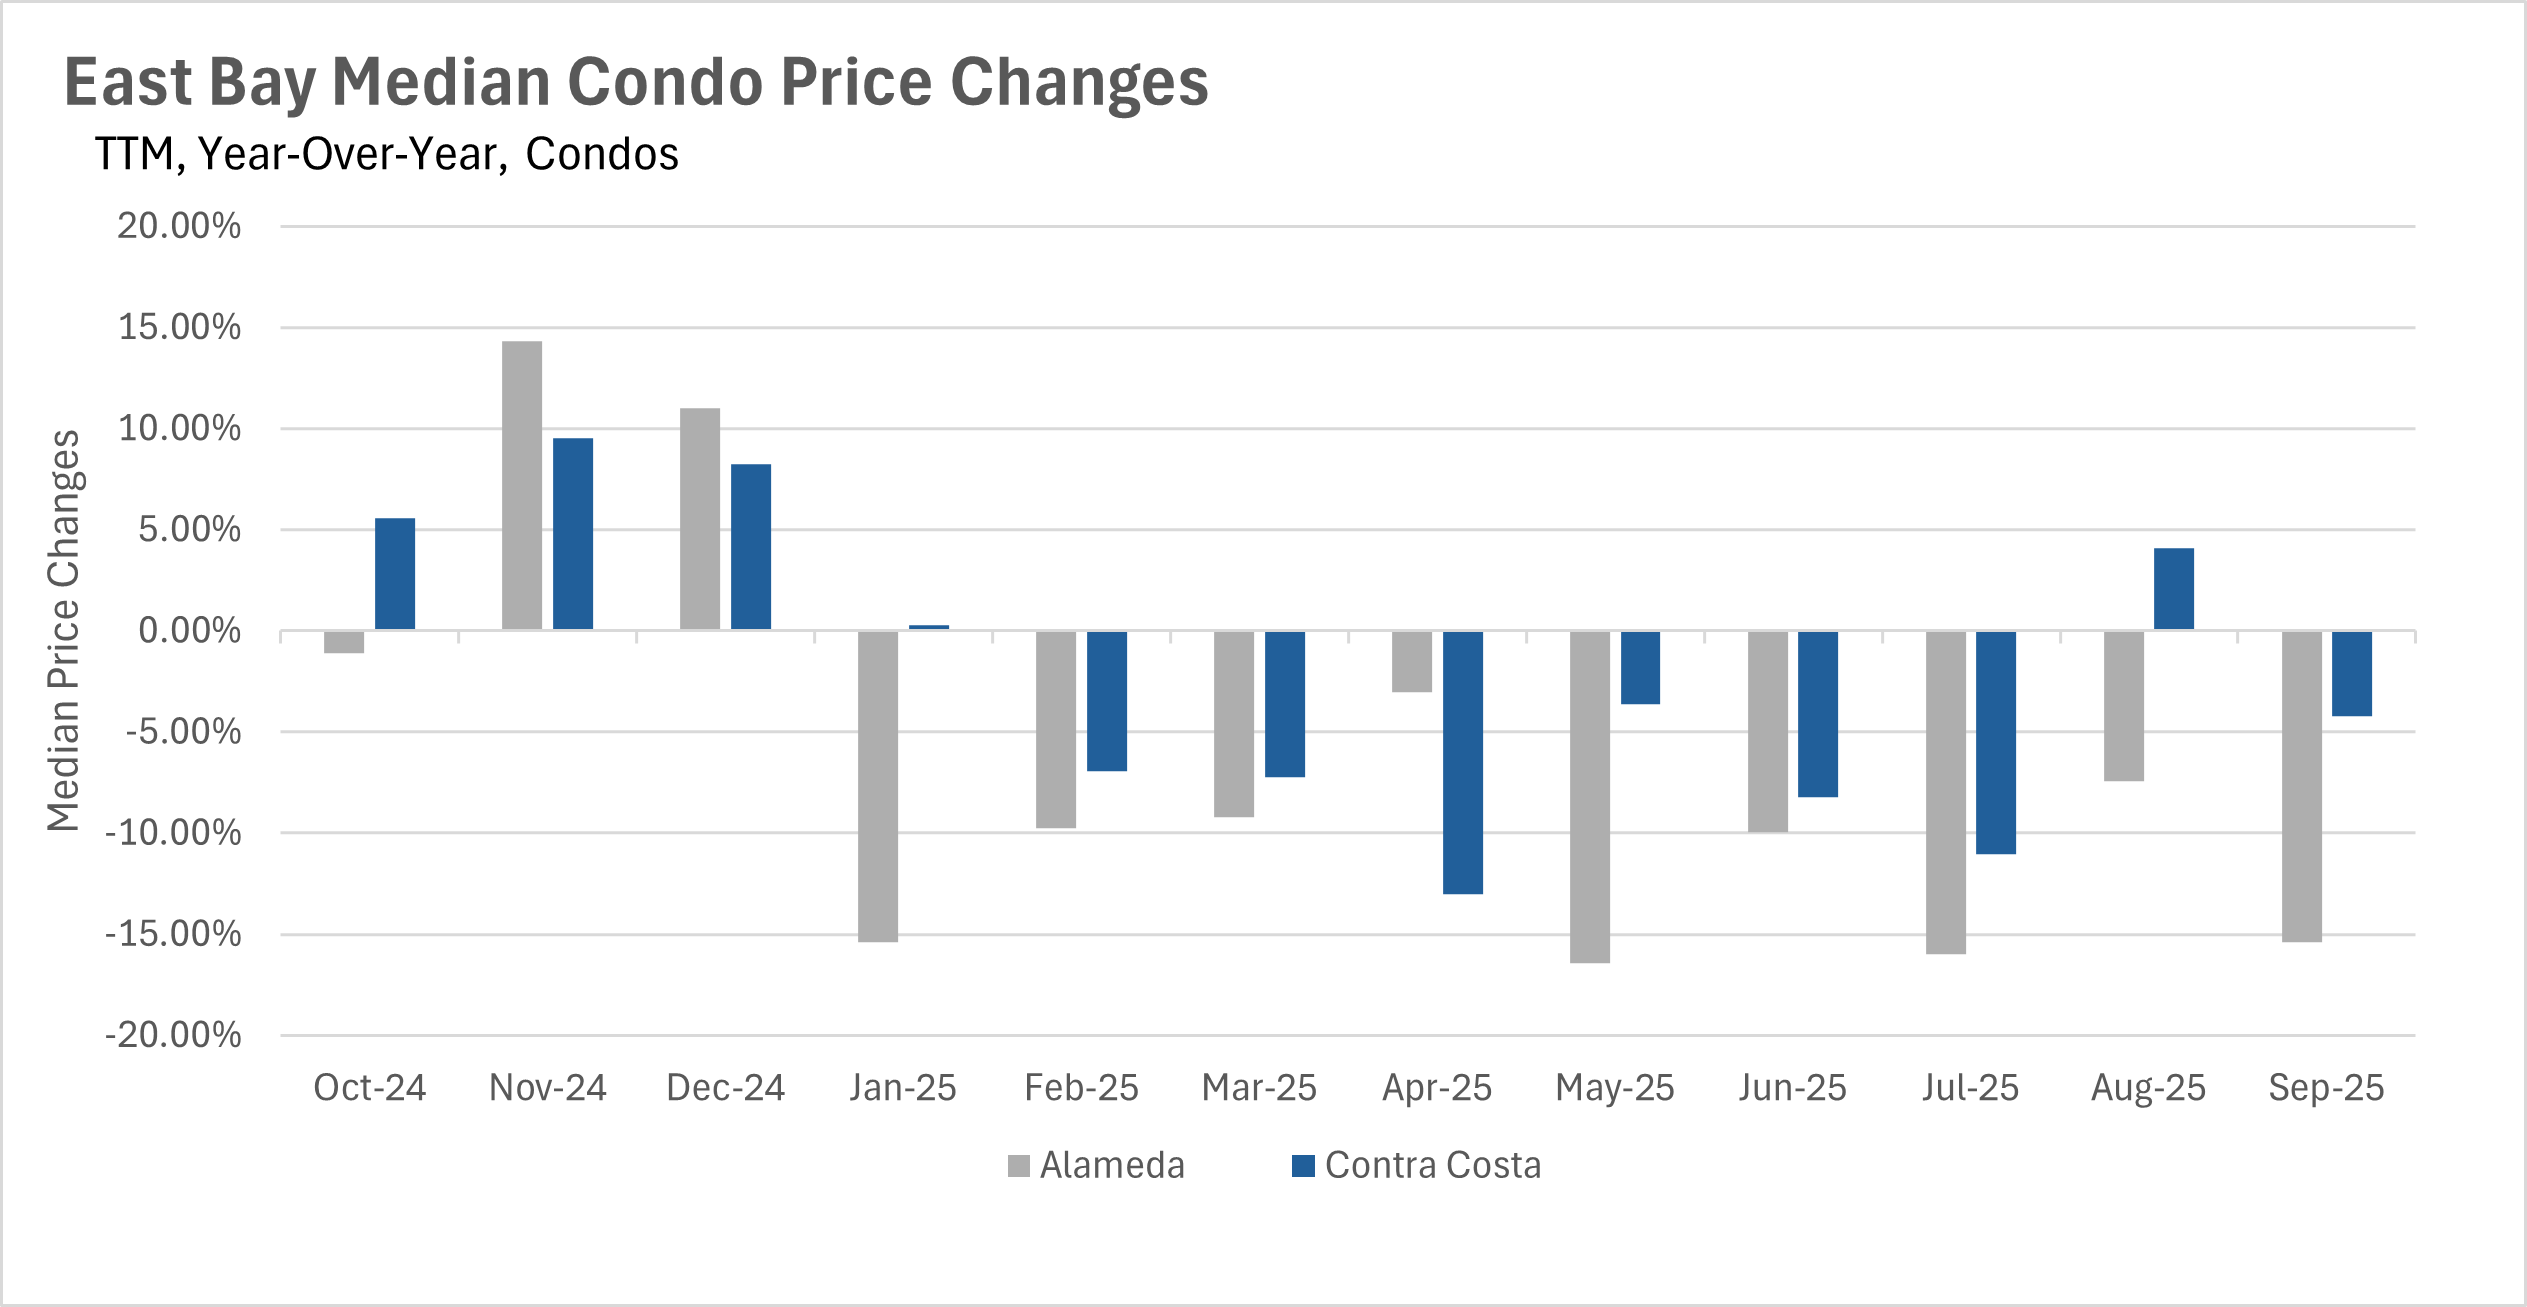
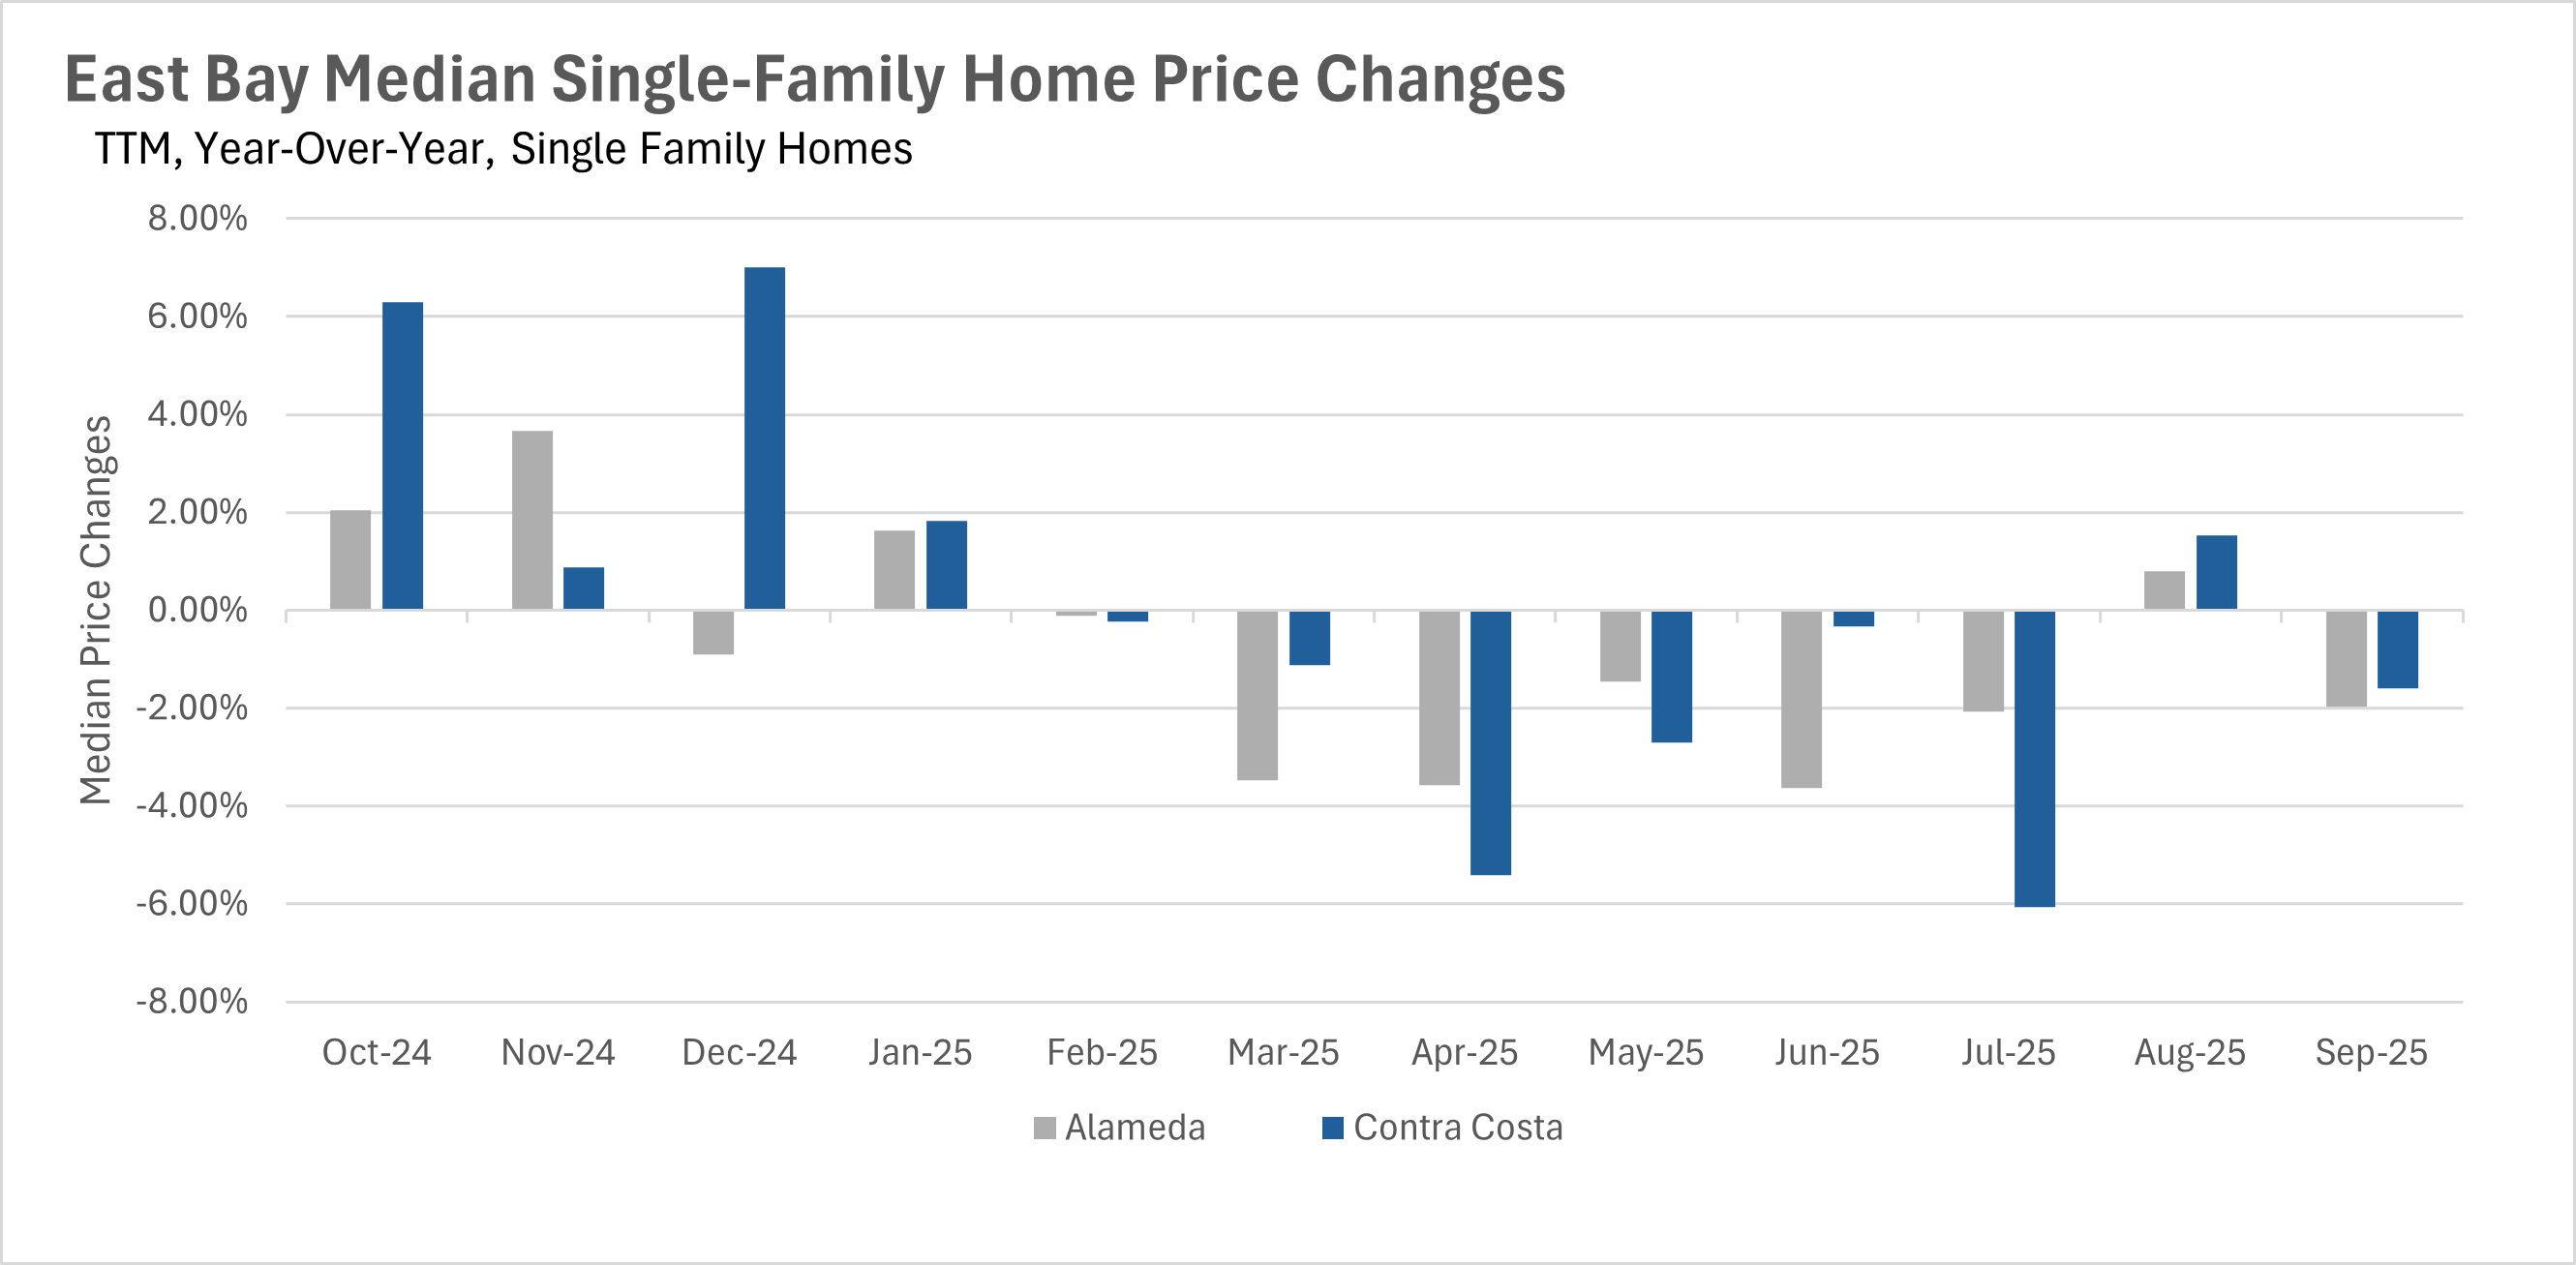
The condo market continued its downward trend for the second consecutive month with declines of 3.88% in San Mateo, 3.01% in Santa Clara, and 2.53% in Santa Cruz. The East Bay returned to year-over-year declines after August's brief respite, with single-family homes down 1.98% in Alameda County and 1.59% in Contra Costa, though prices remain well within their historical bands. Condos in Contra Costa County declined 4.21% year-over-year. The North Bay showed the most uniform pattern with near-stagnant pricing across the board - Sonoma, Marin, and Solano Counties all posted small declines of 3.47%, 1.43%, and 0.81% respectively, while Napa County managed a tiny 0.17% premium to last year's prices.
Inventory normalization accelerates with dramatic year-over-year declines
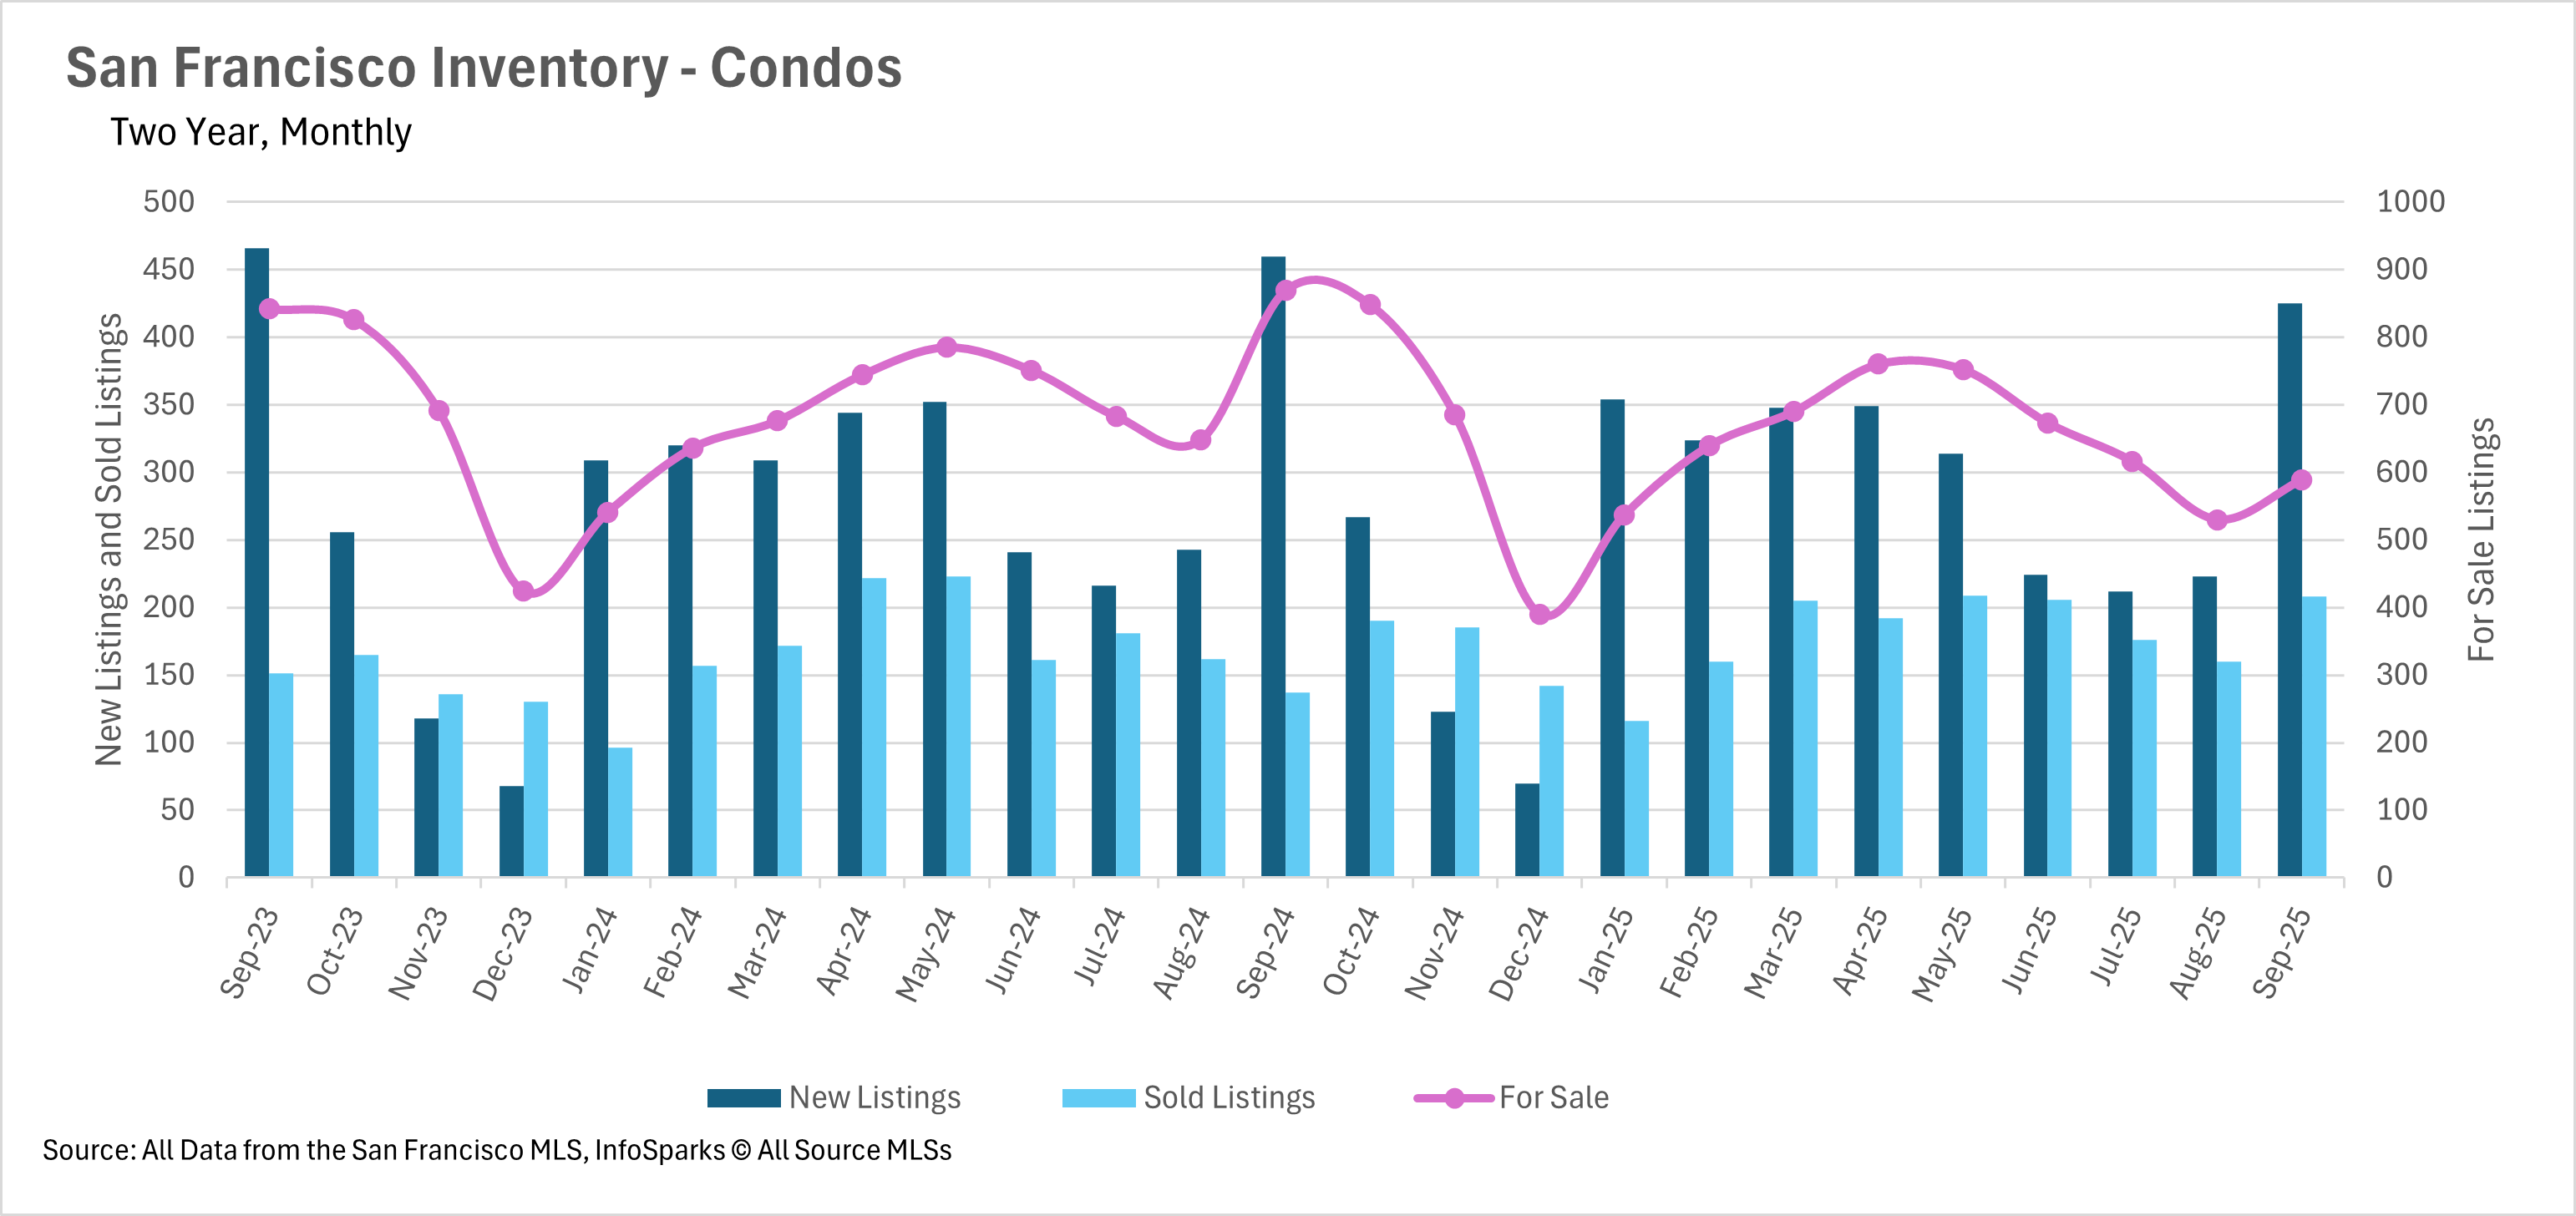
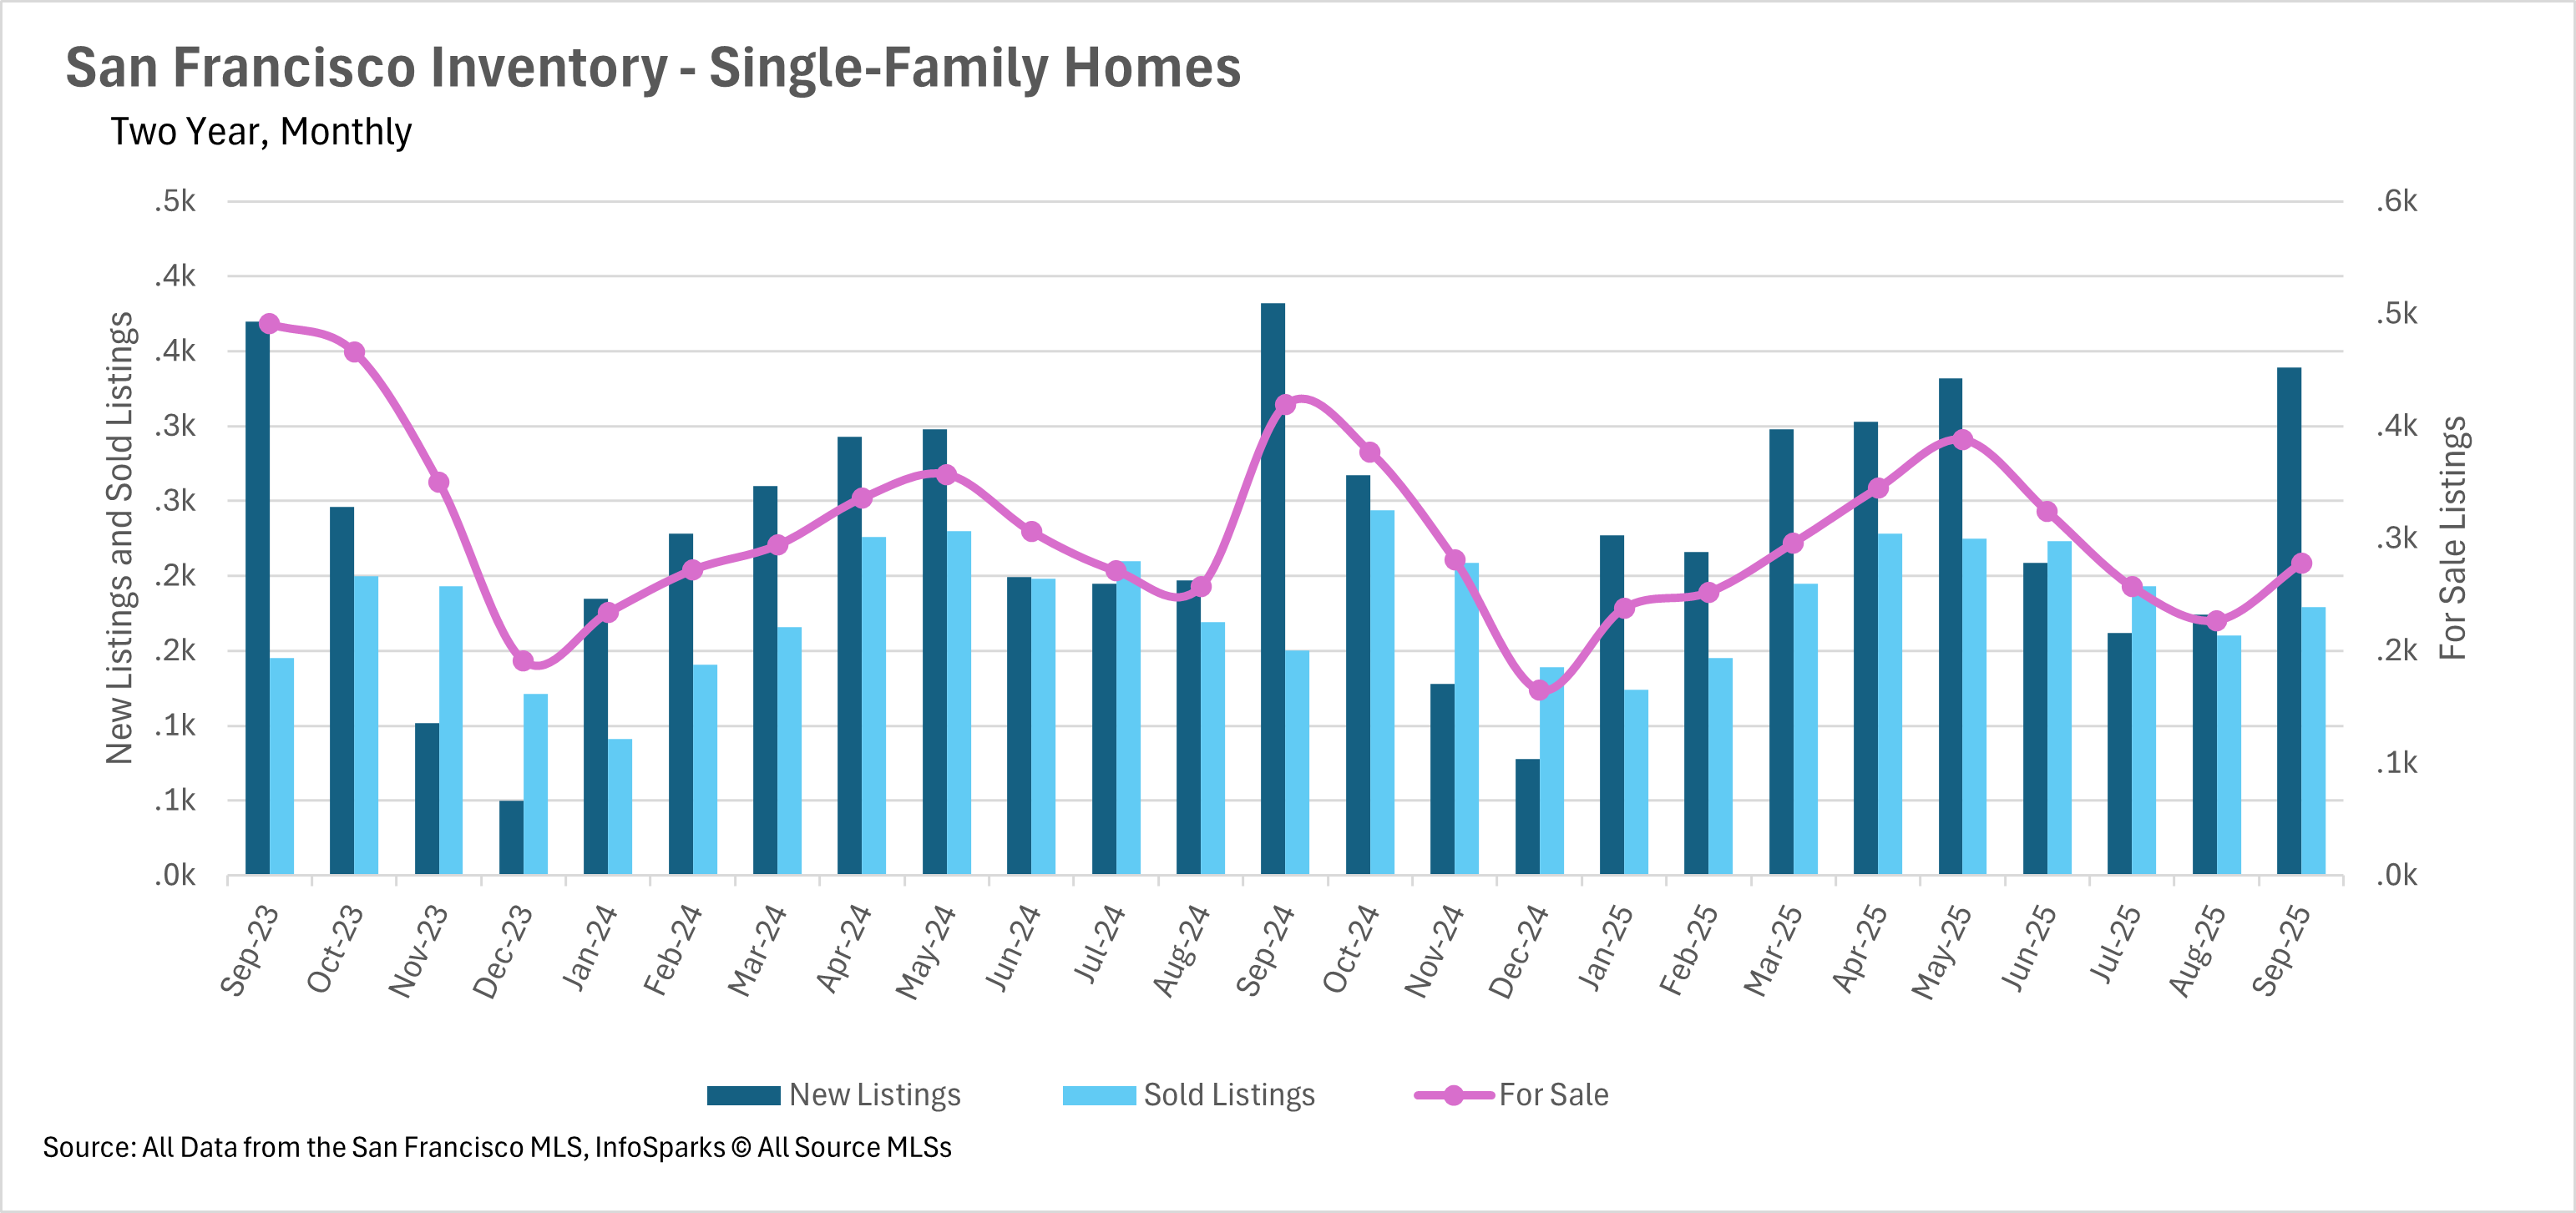
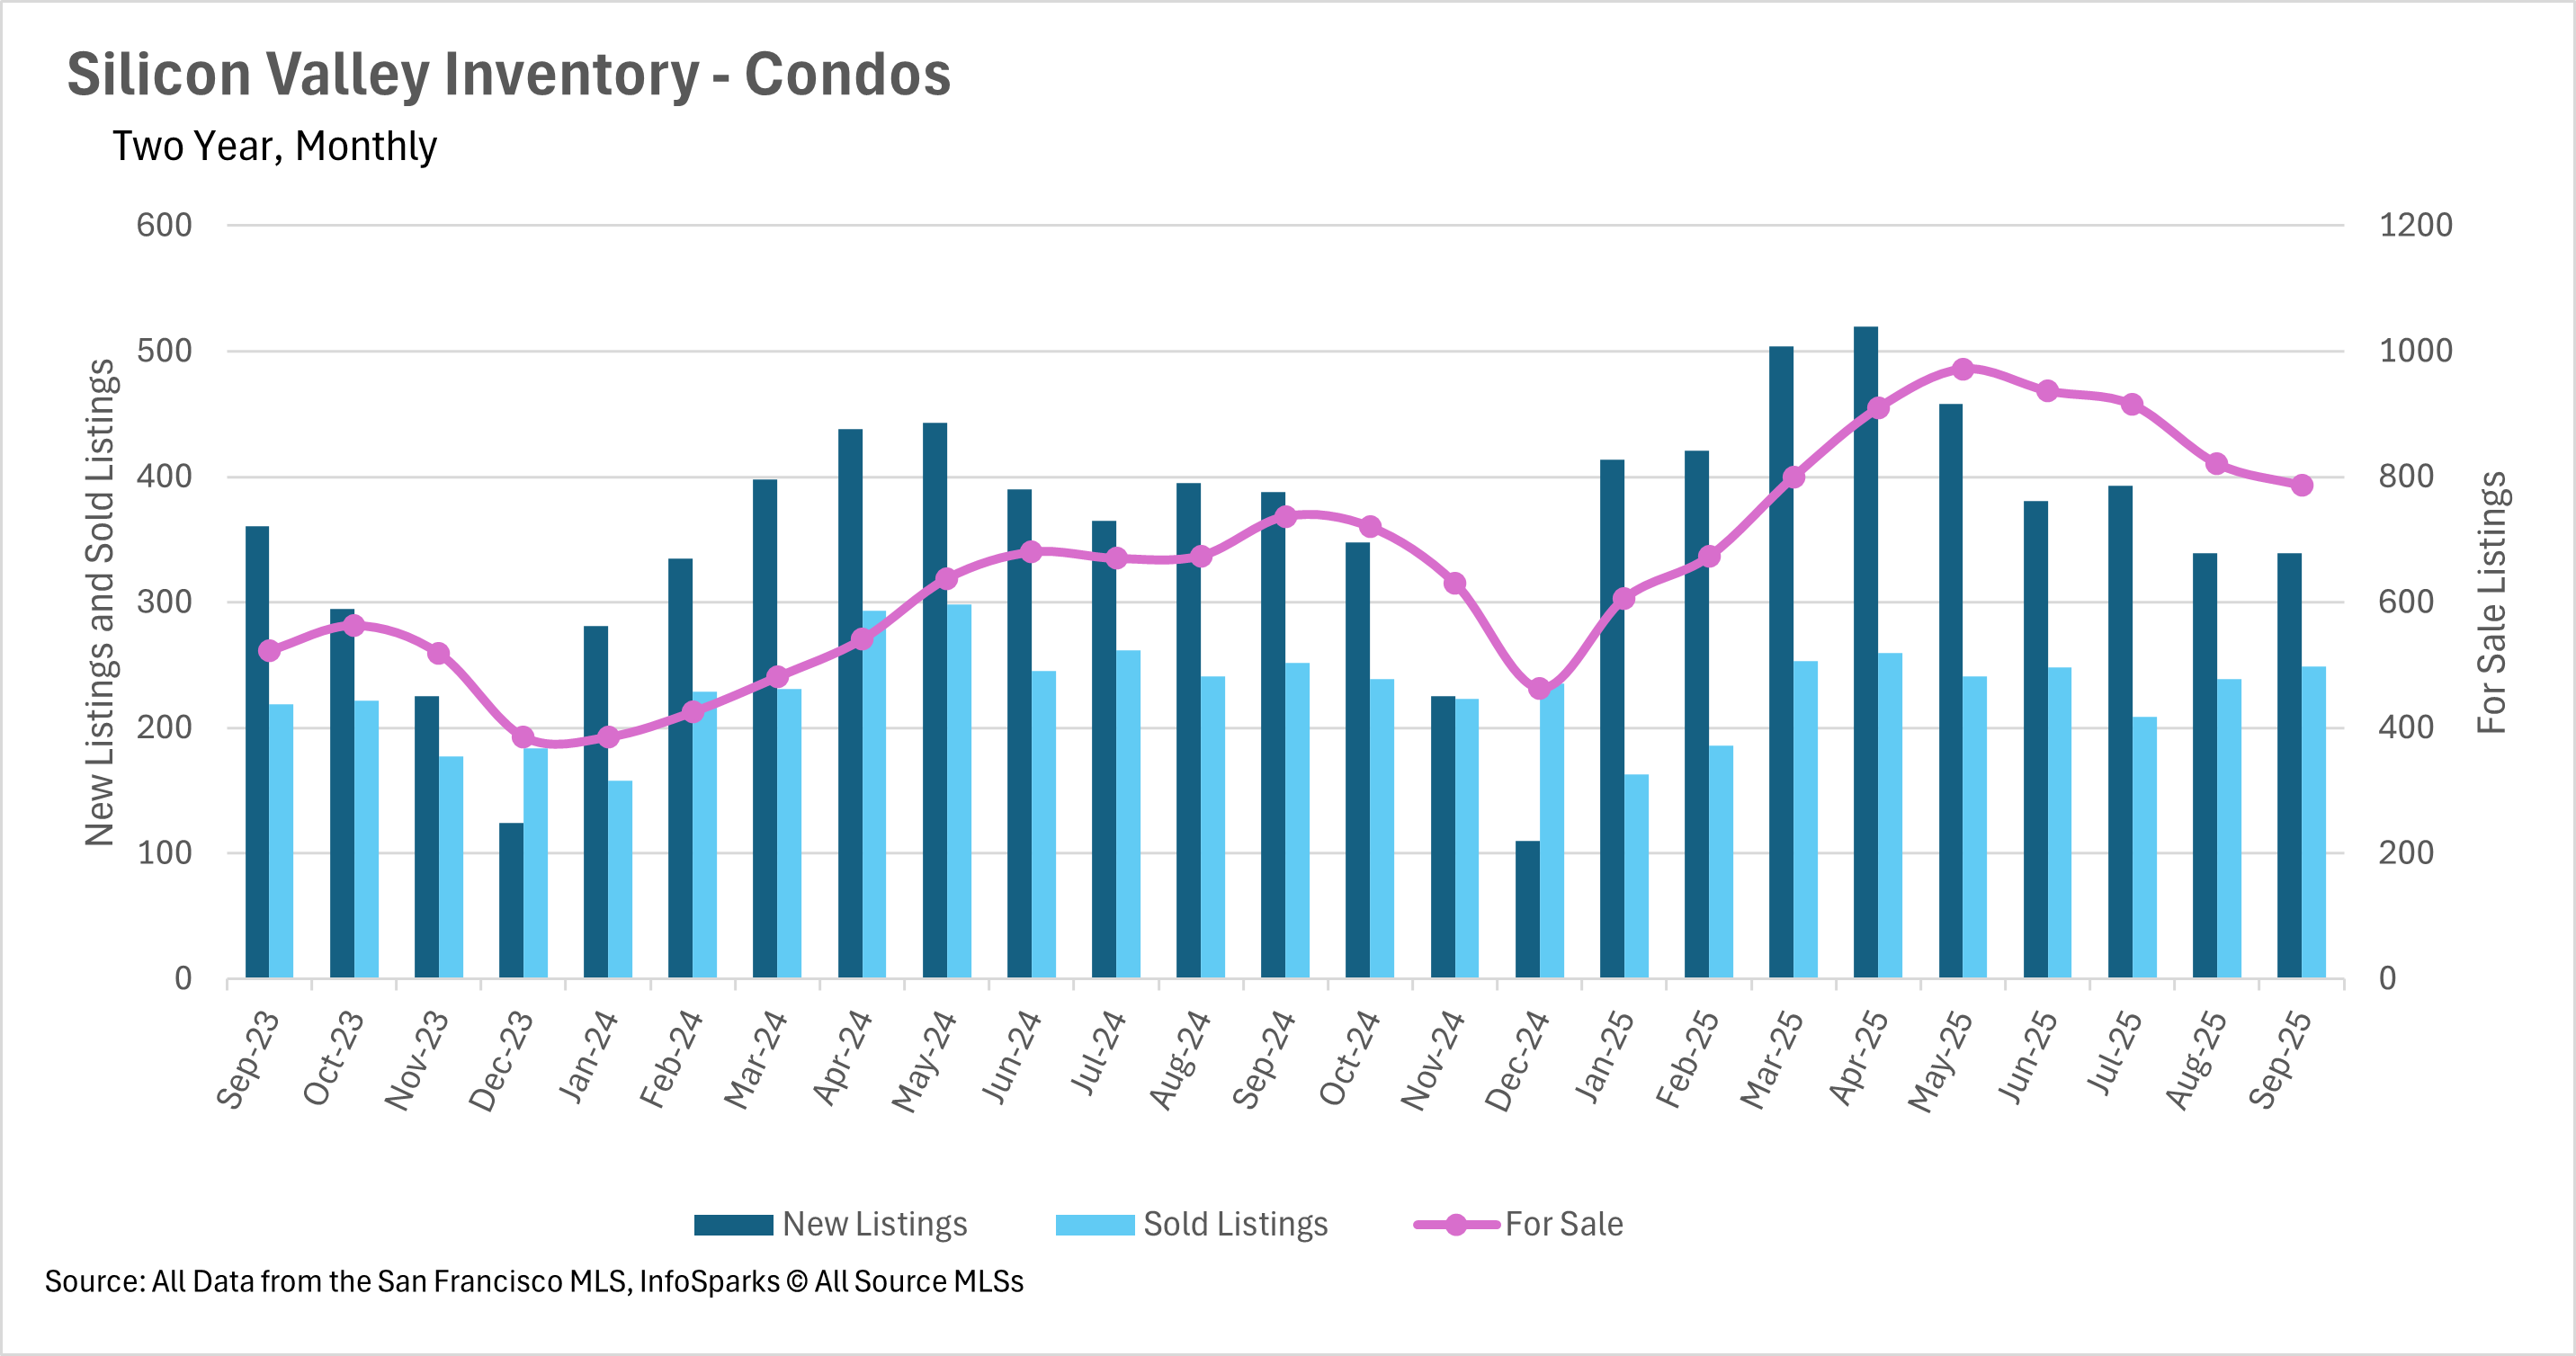
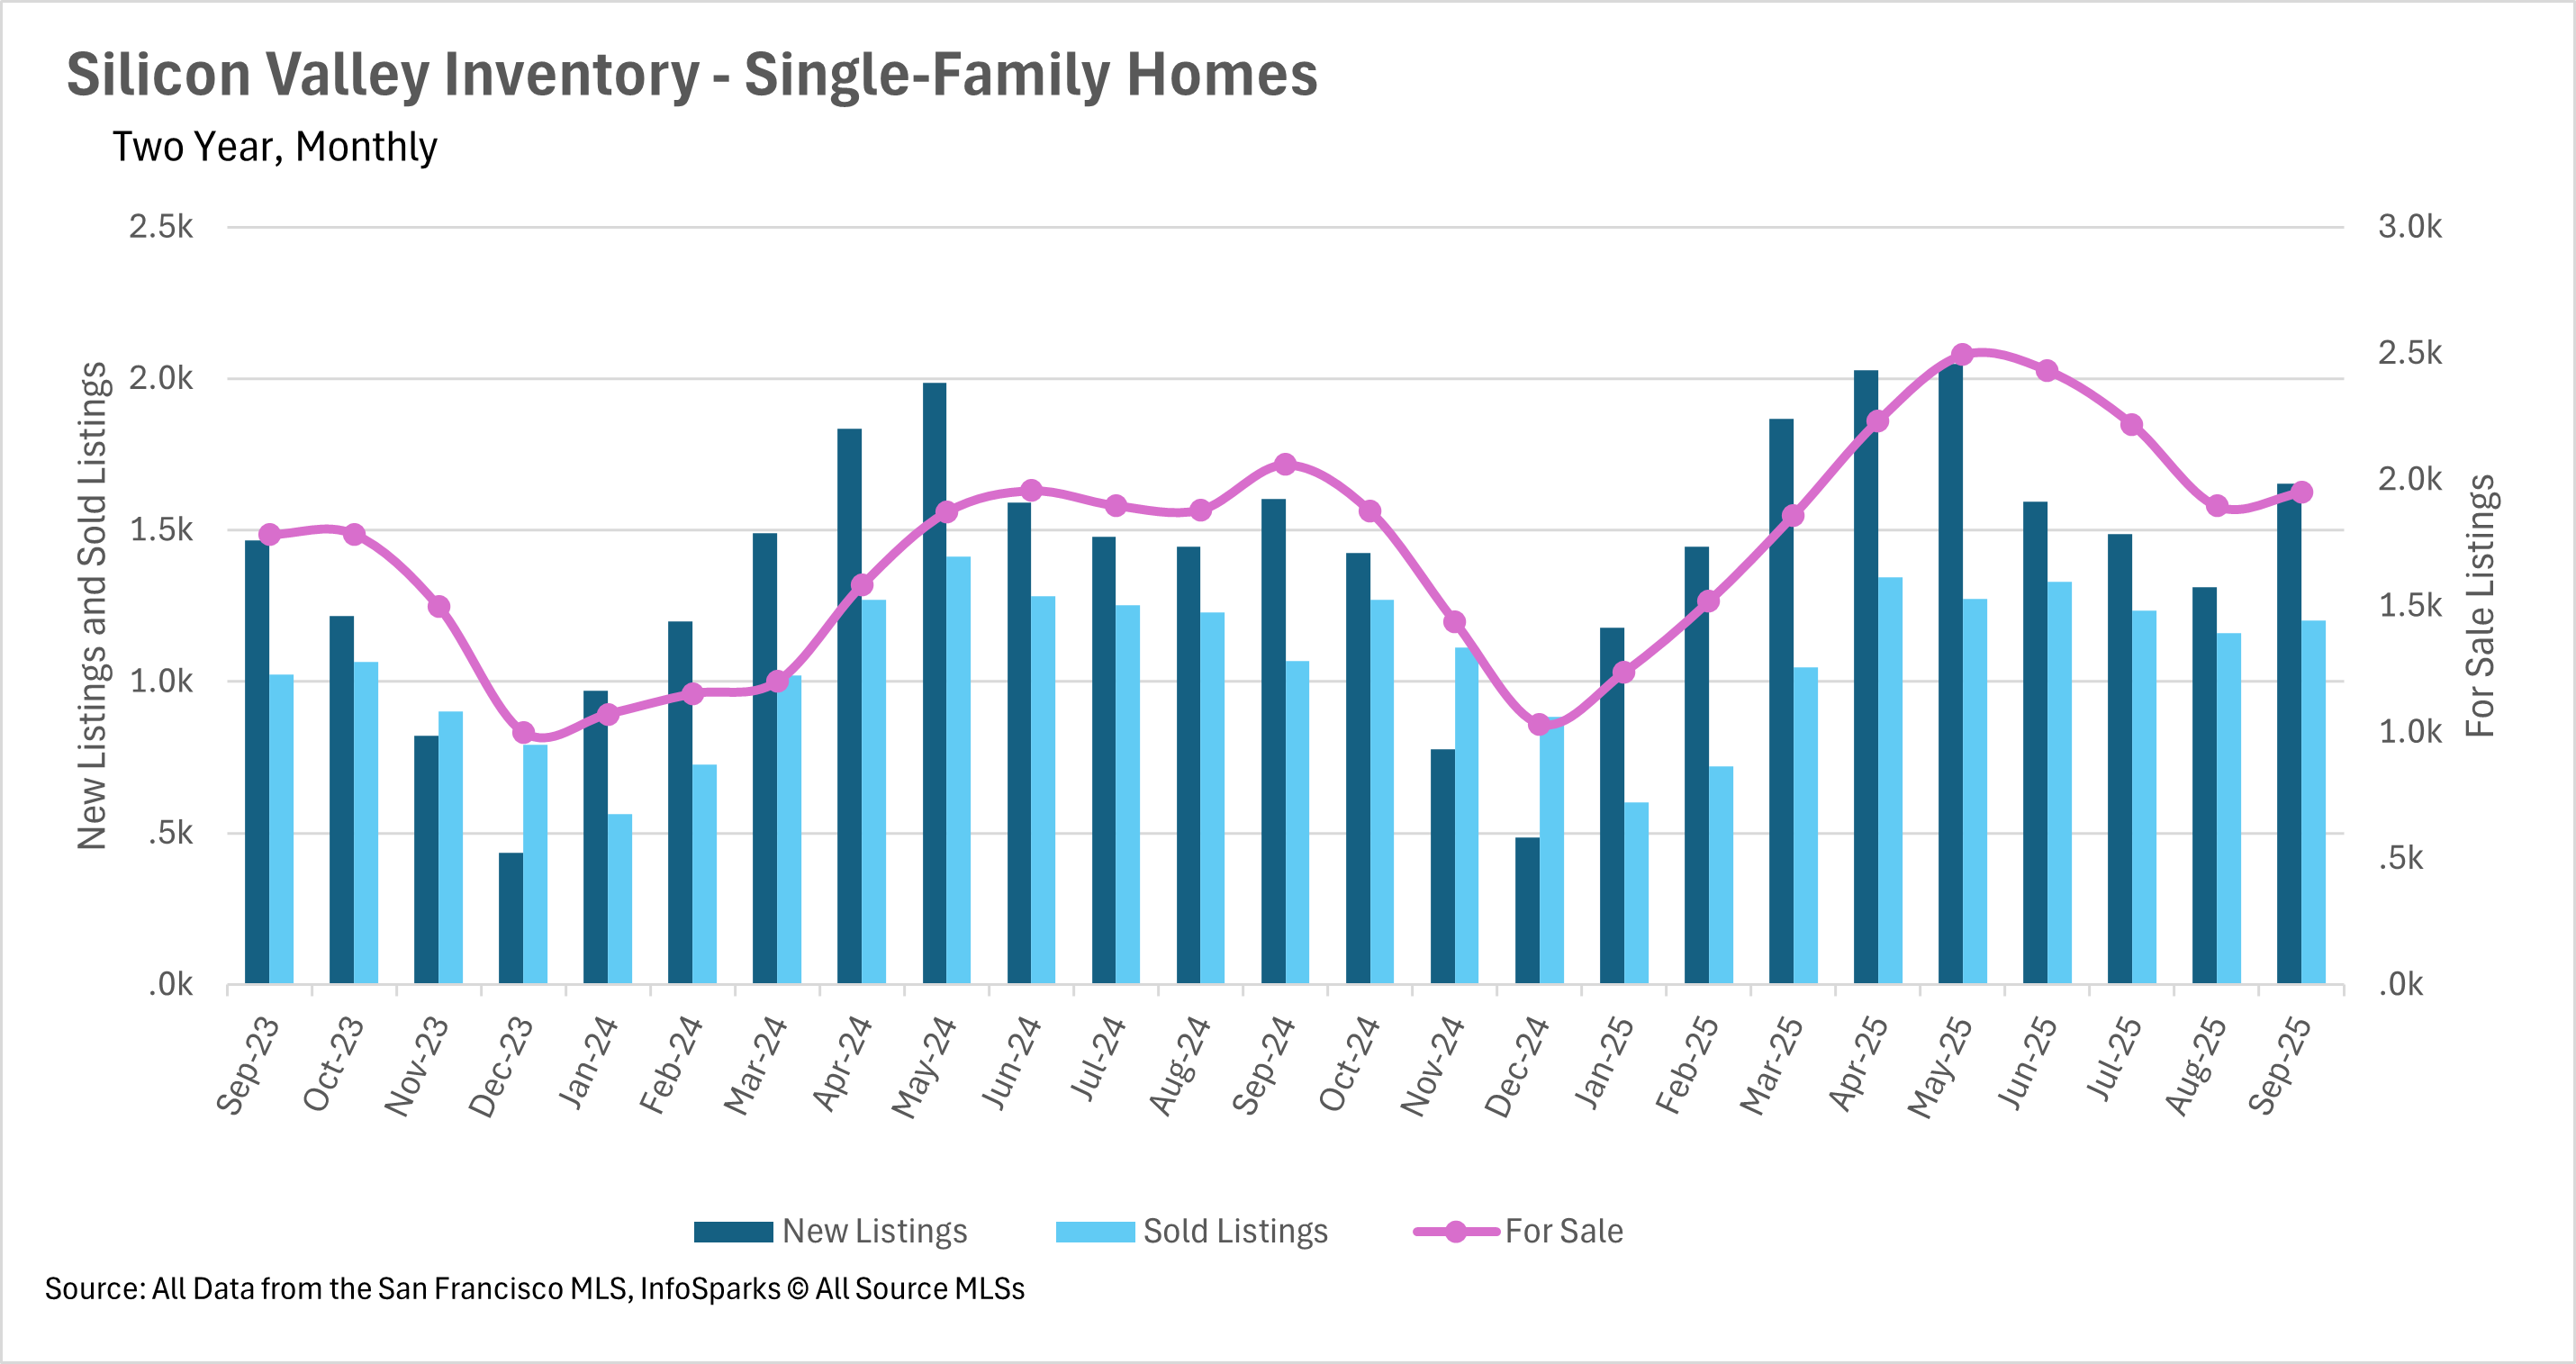
September marked a watershed moment for Bay Area inventory levels, with most regions recording their first year-over-year declines in months. San Francisco led with the most dramatic inventory contraction, as single-family home listings plummeted 33.65% and condo inventory fell 32.22% year-over-year. This was driven by a combination of 11.26% fewer new single-family listings, 7.61% fewer new condo listings, and surging sales with 19.33% more single-family homes and an extraordinary 51.82% more condos sold. Silicon Valley's single-family market achieved a remarkable reversal, recording 5.34% fewer active listings than last year, largely due to 12.56% more homes sold. However, the condo market remained slightly elevated at 6.65% above last year's levels.
 
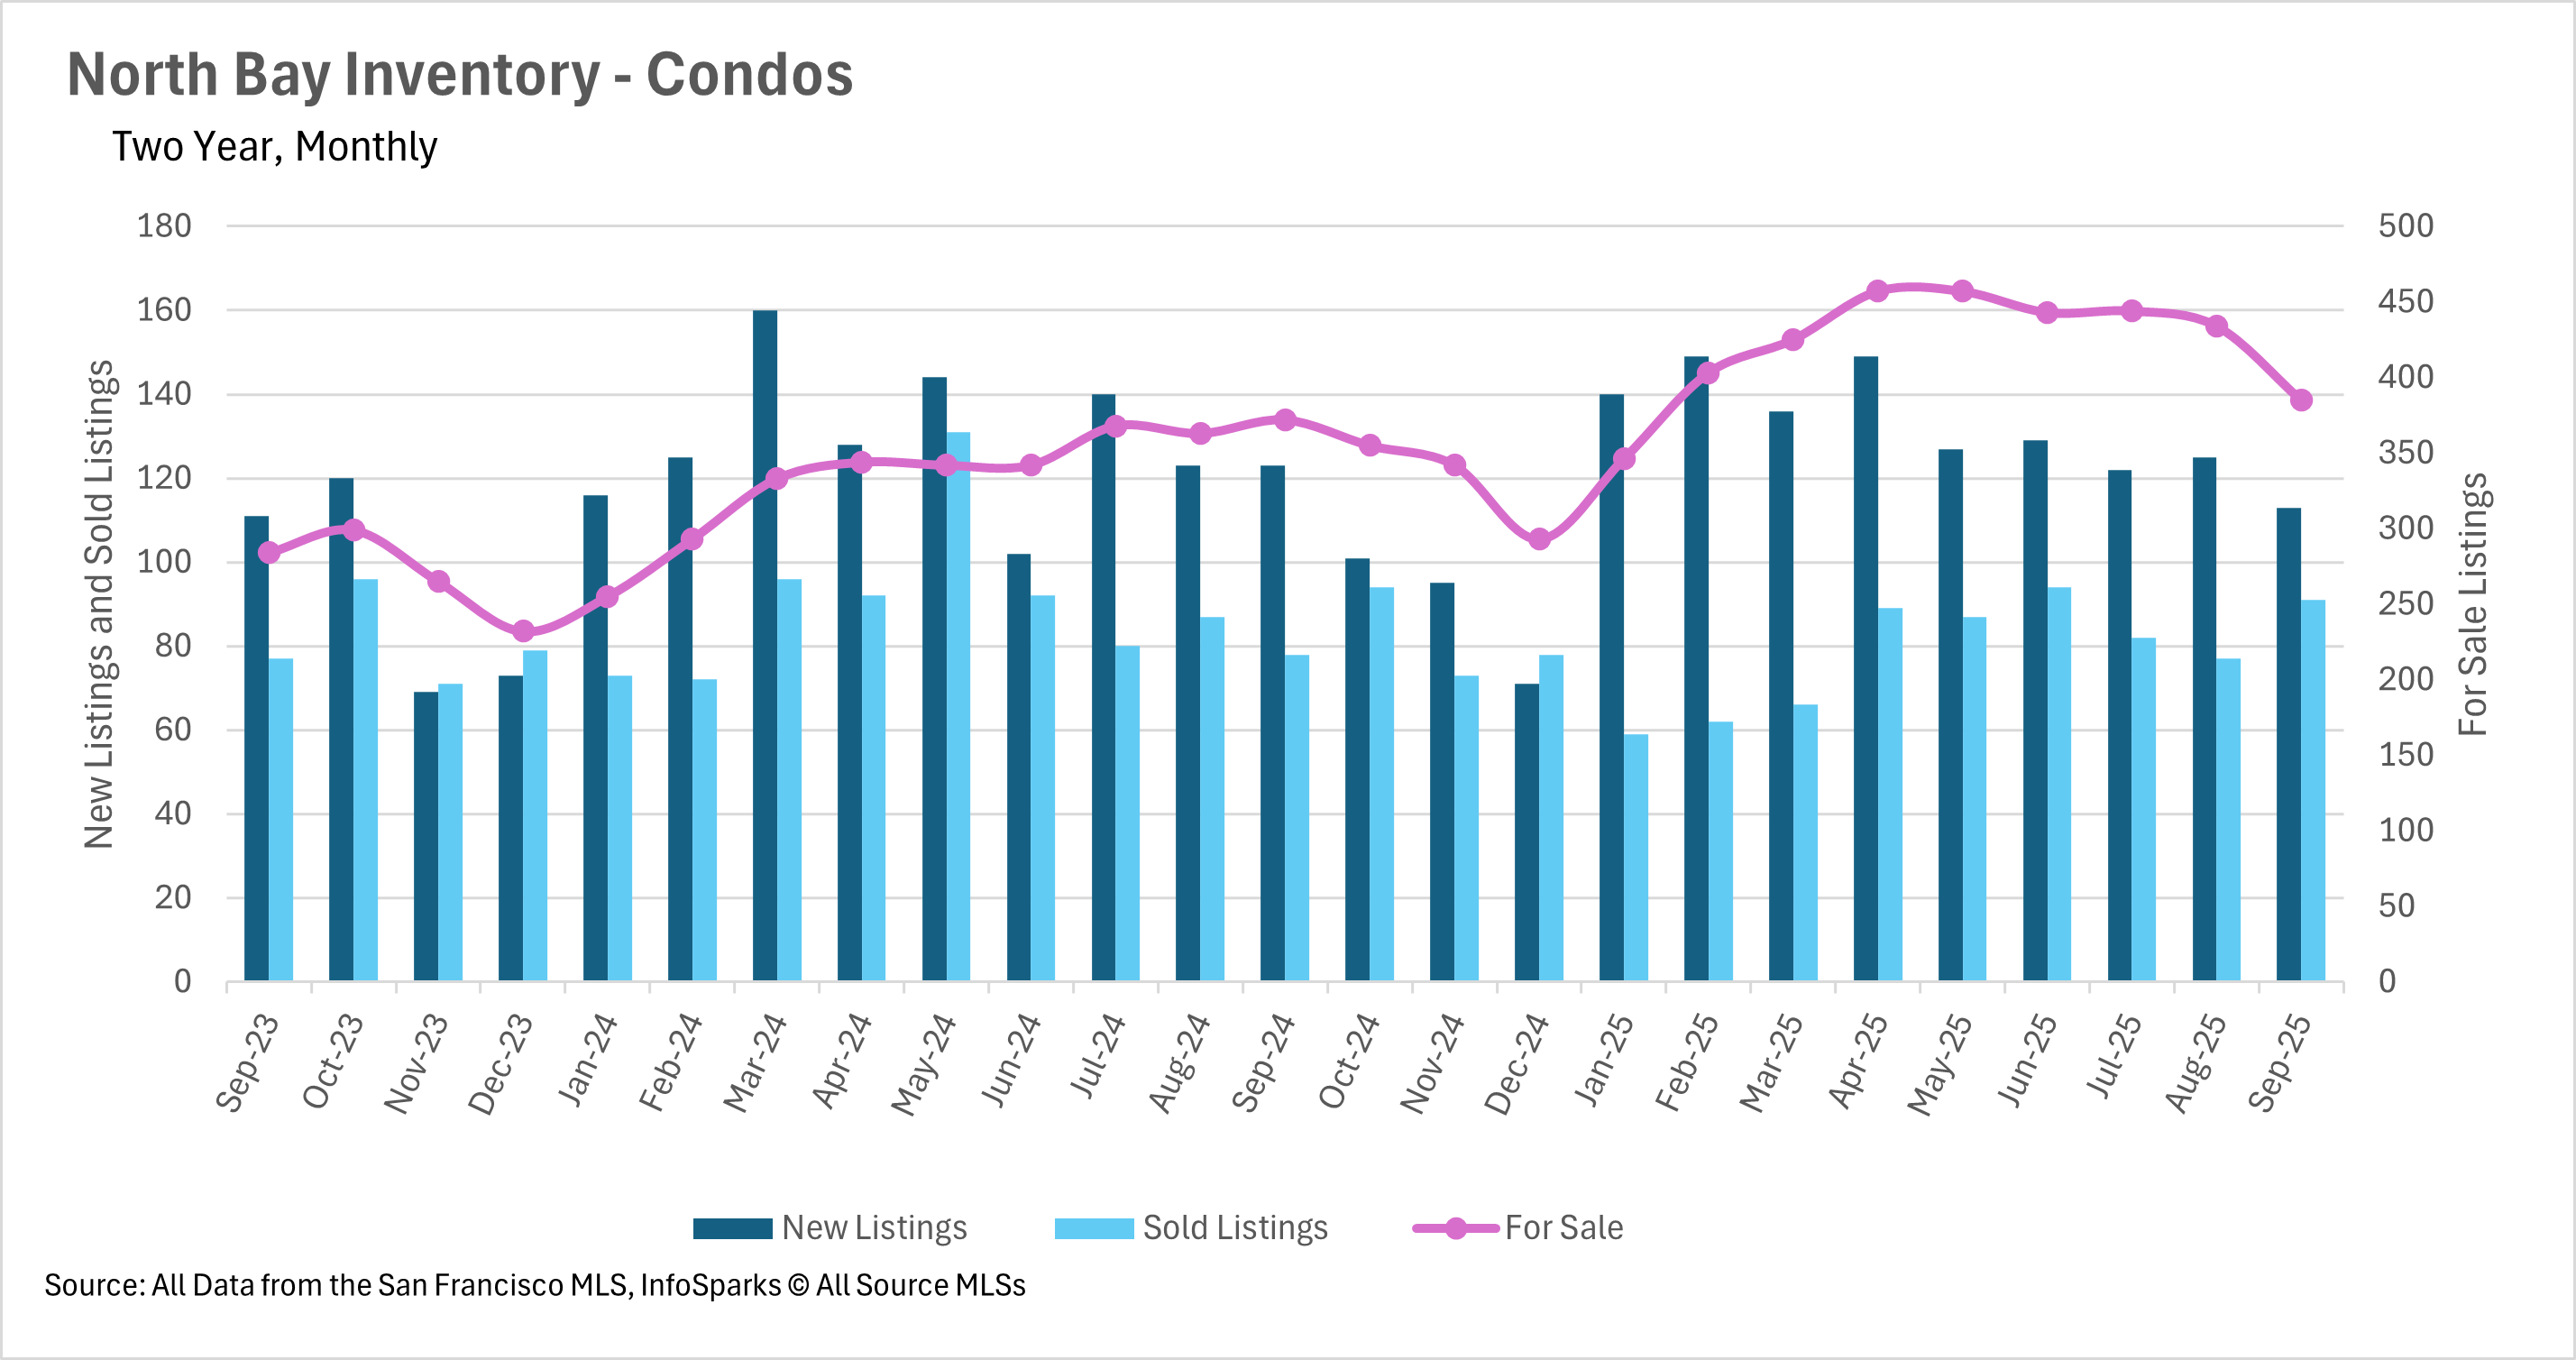
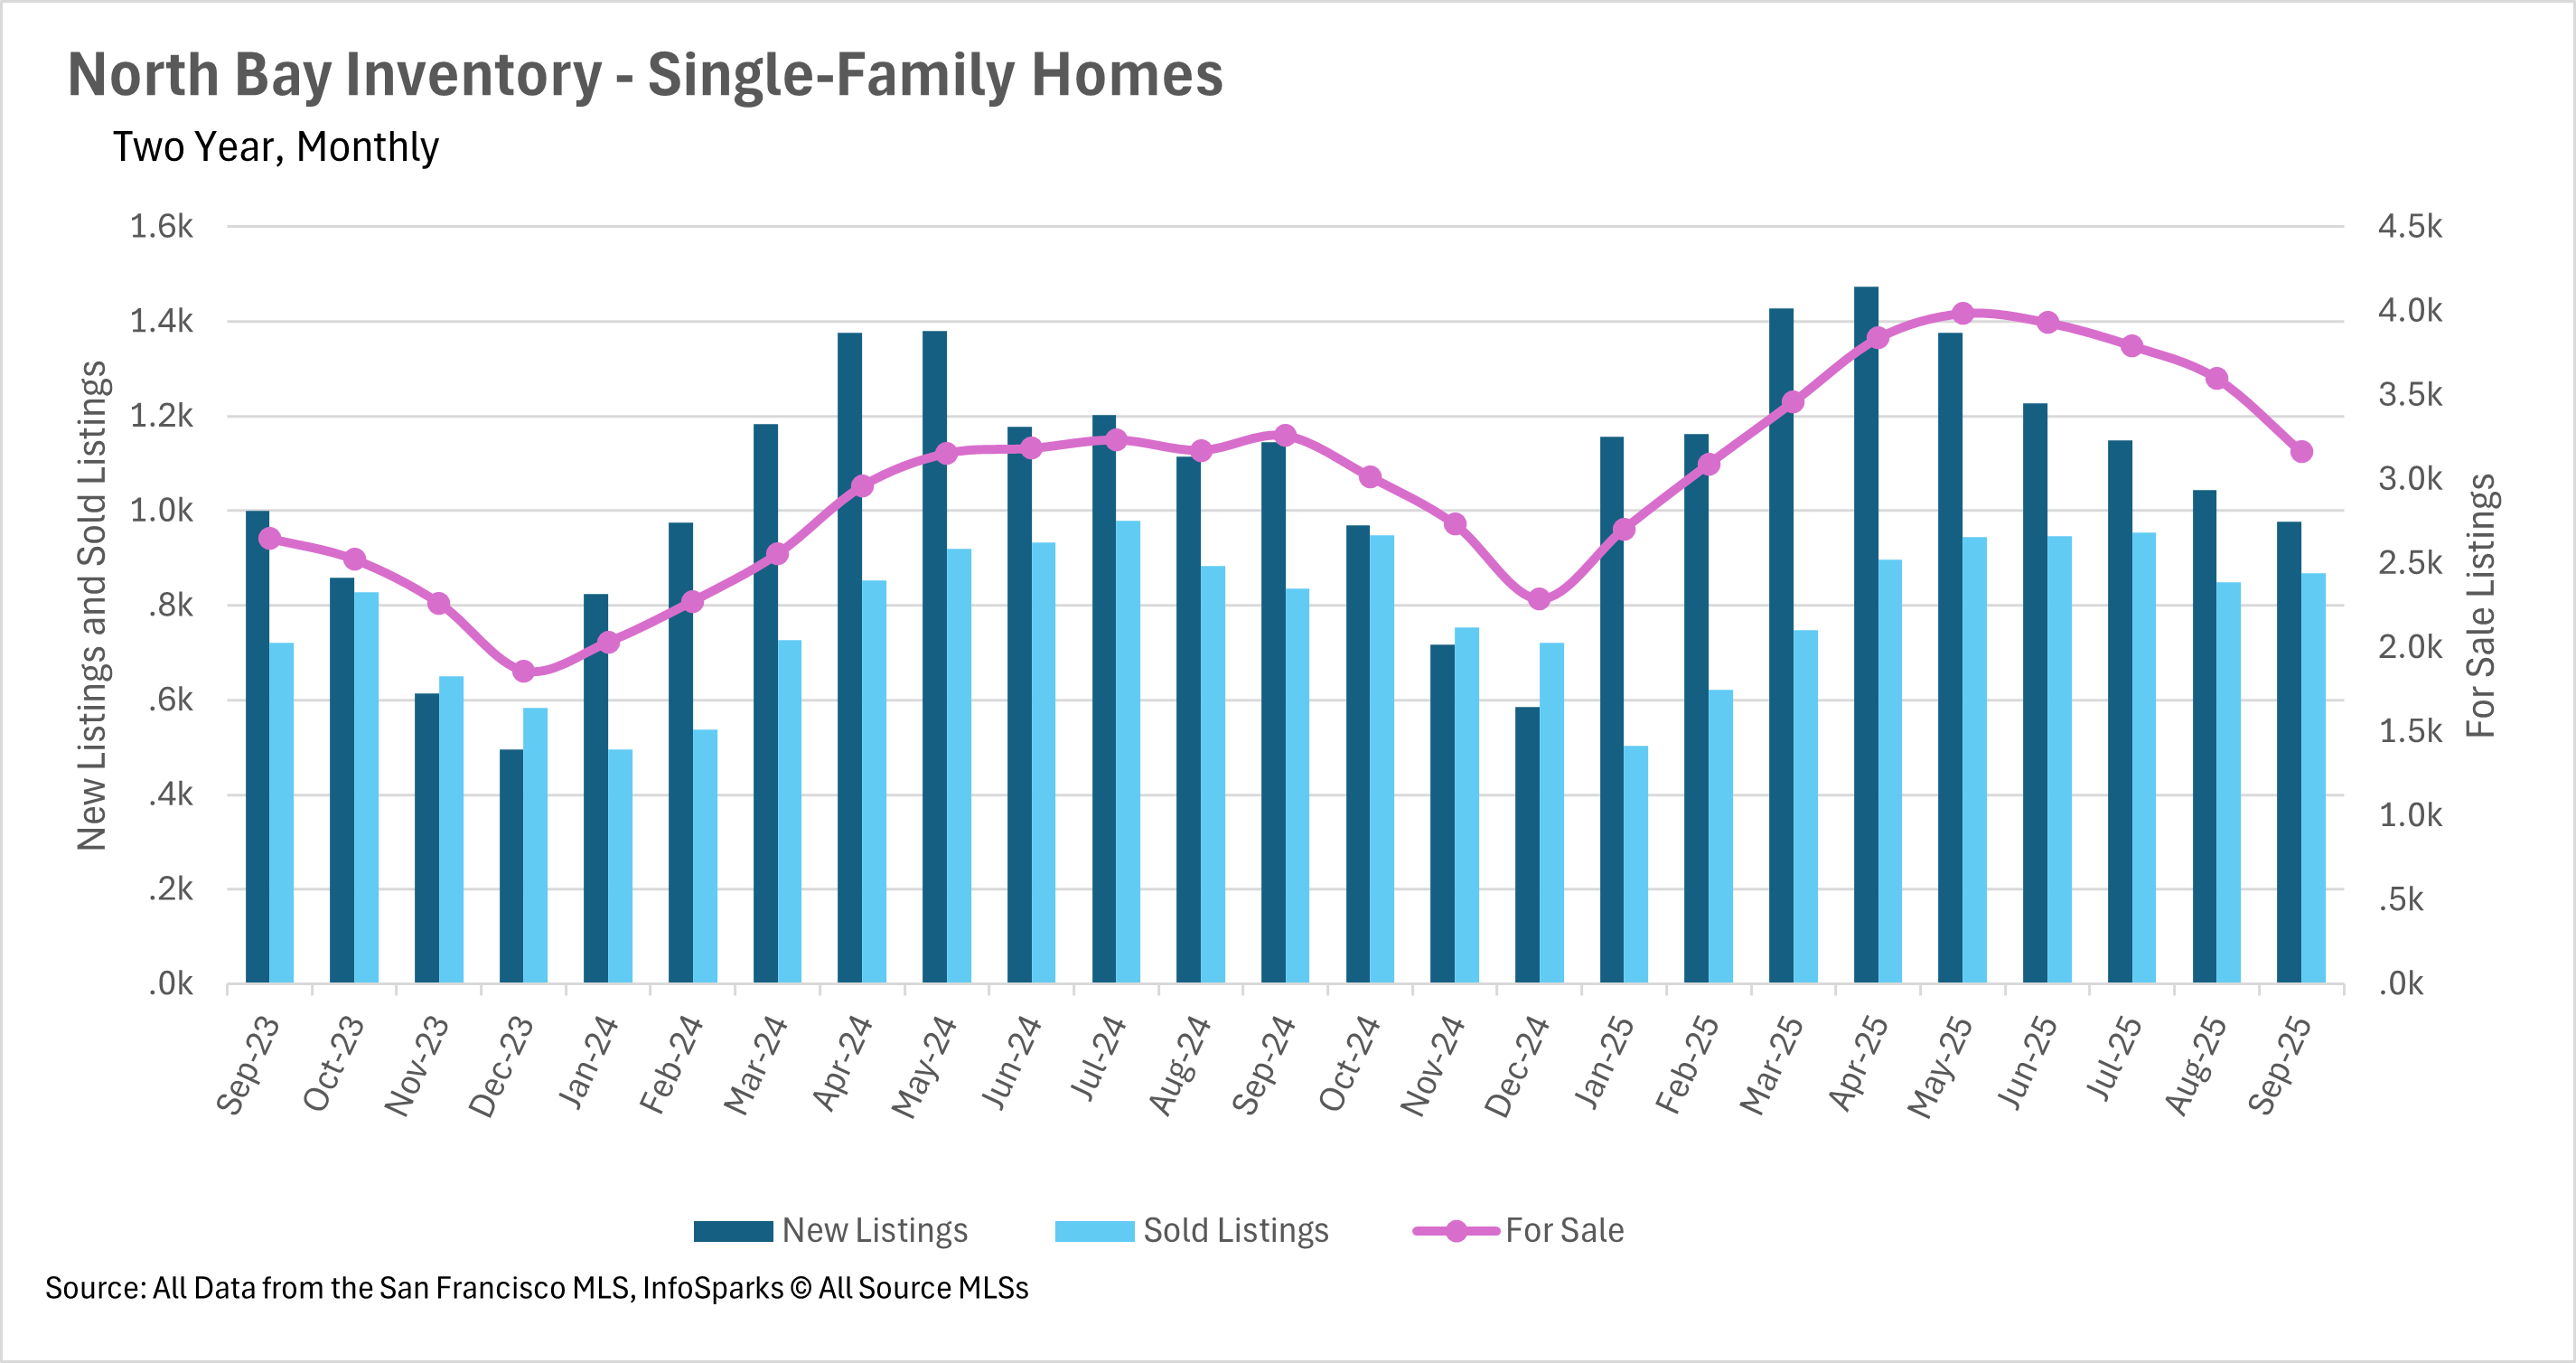
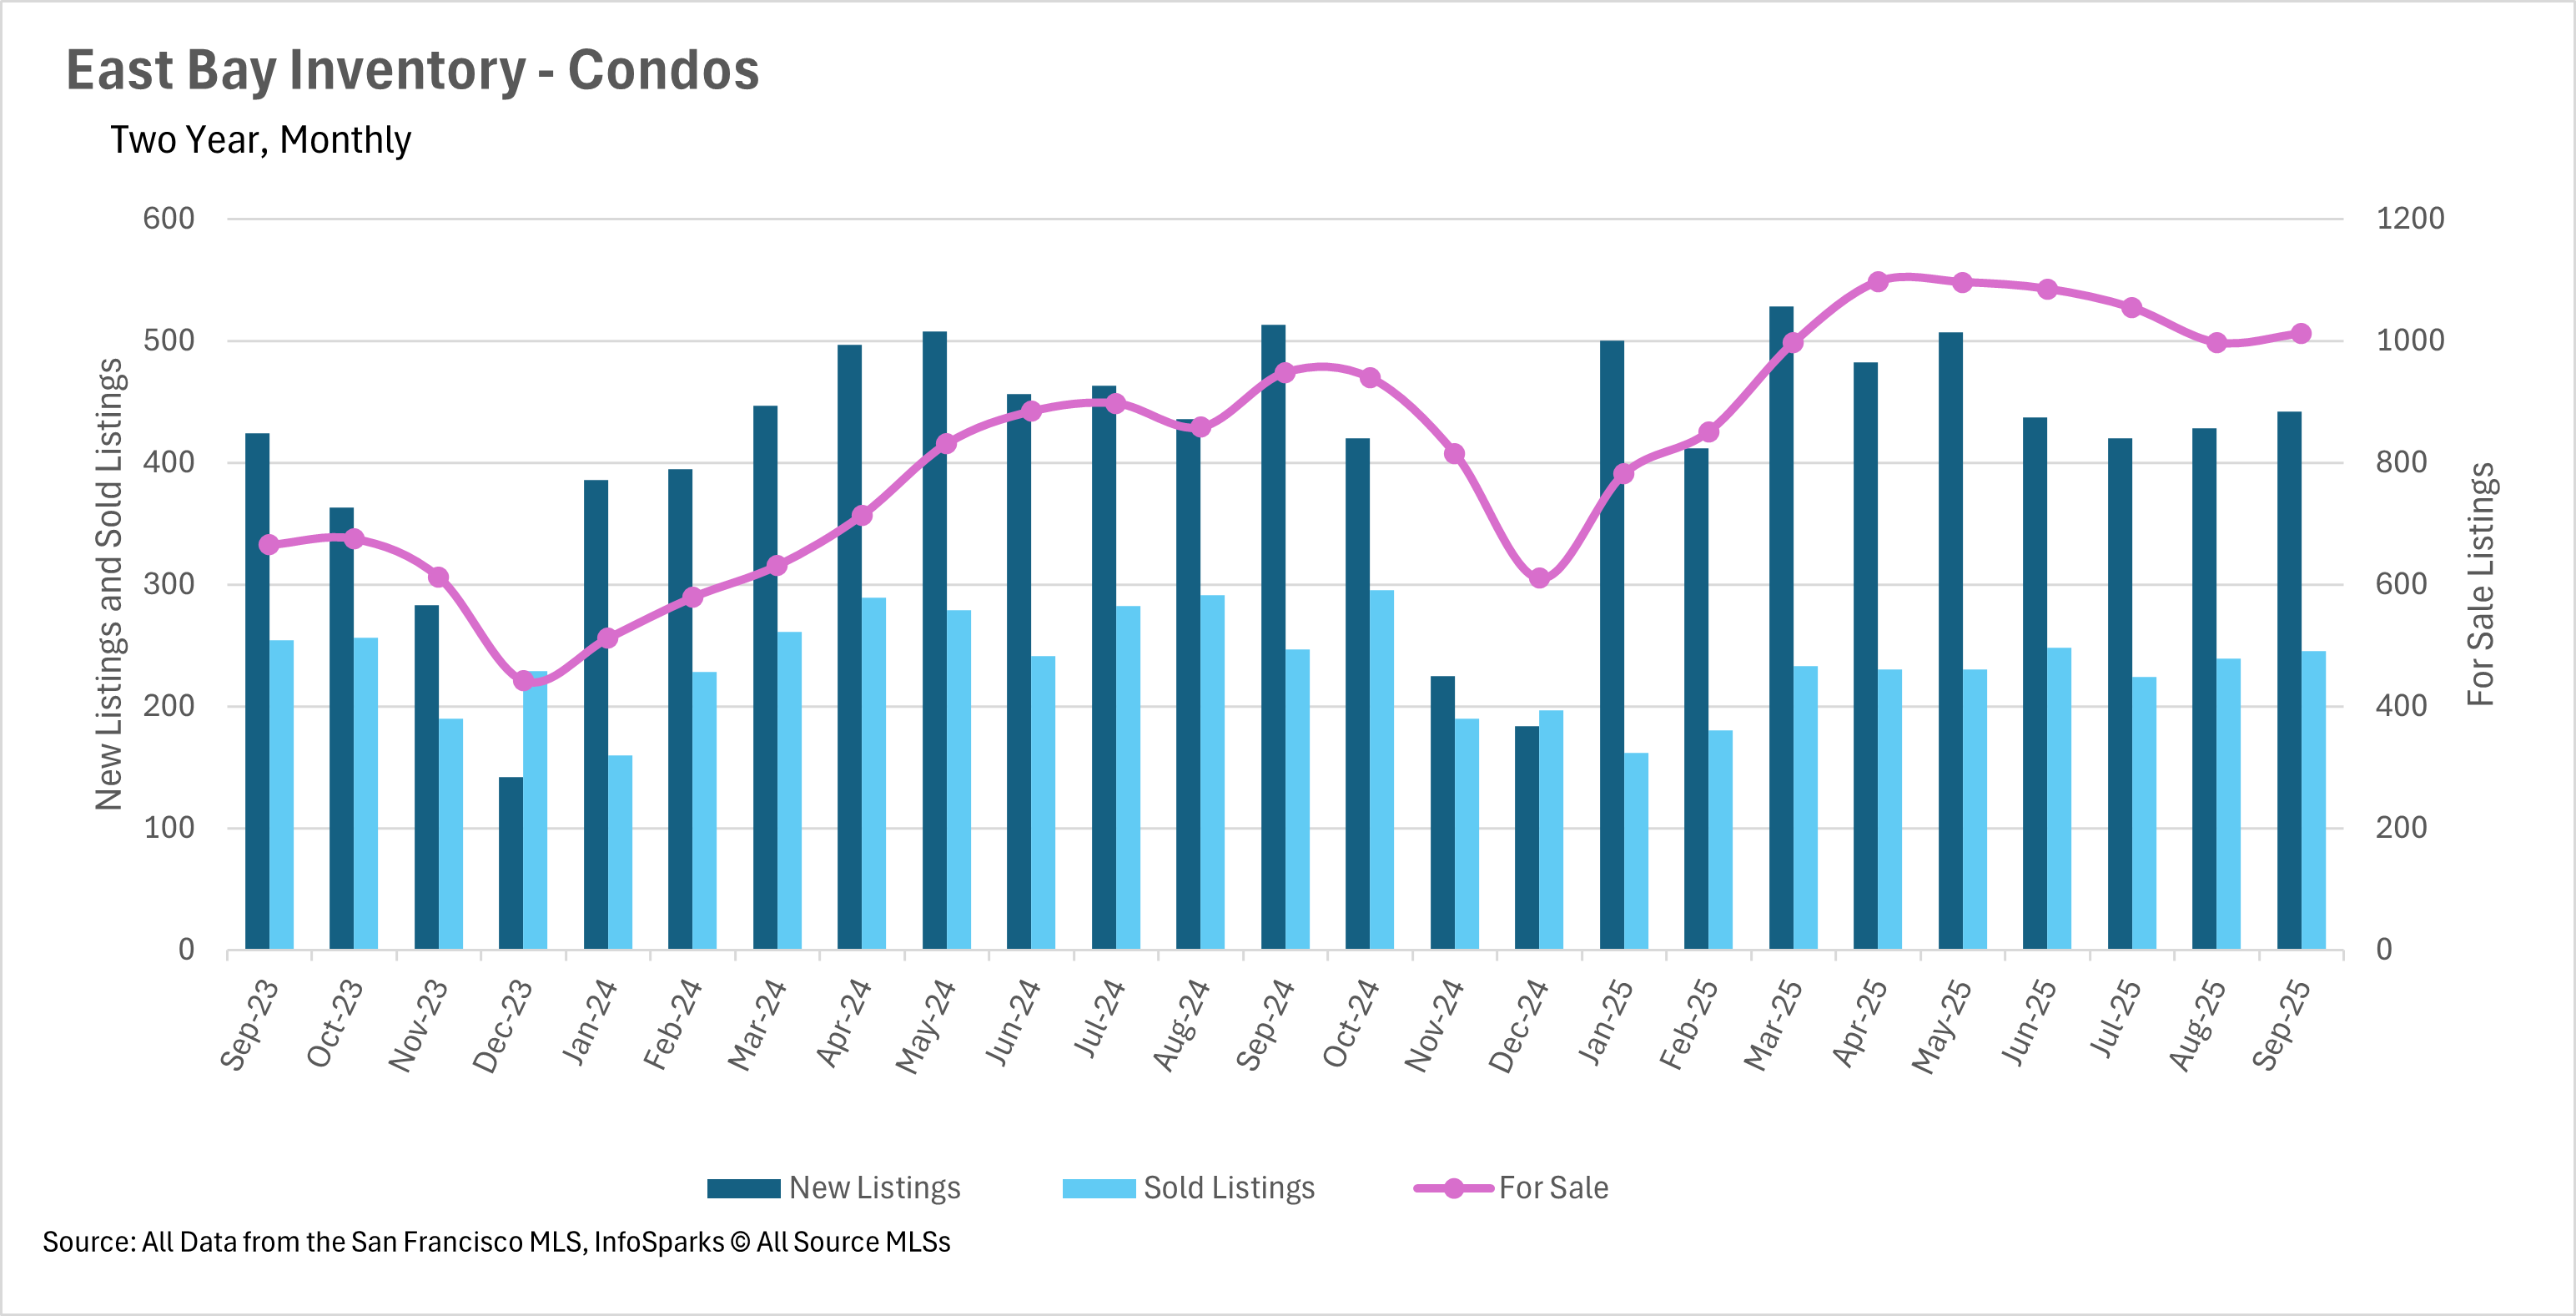
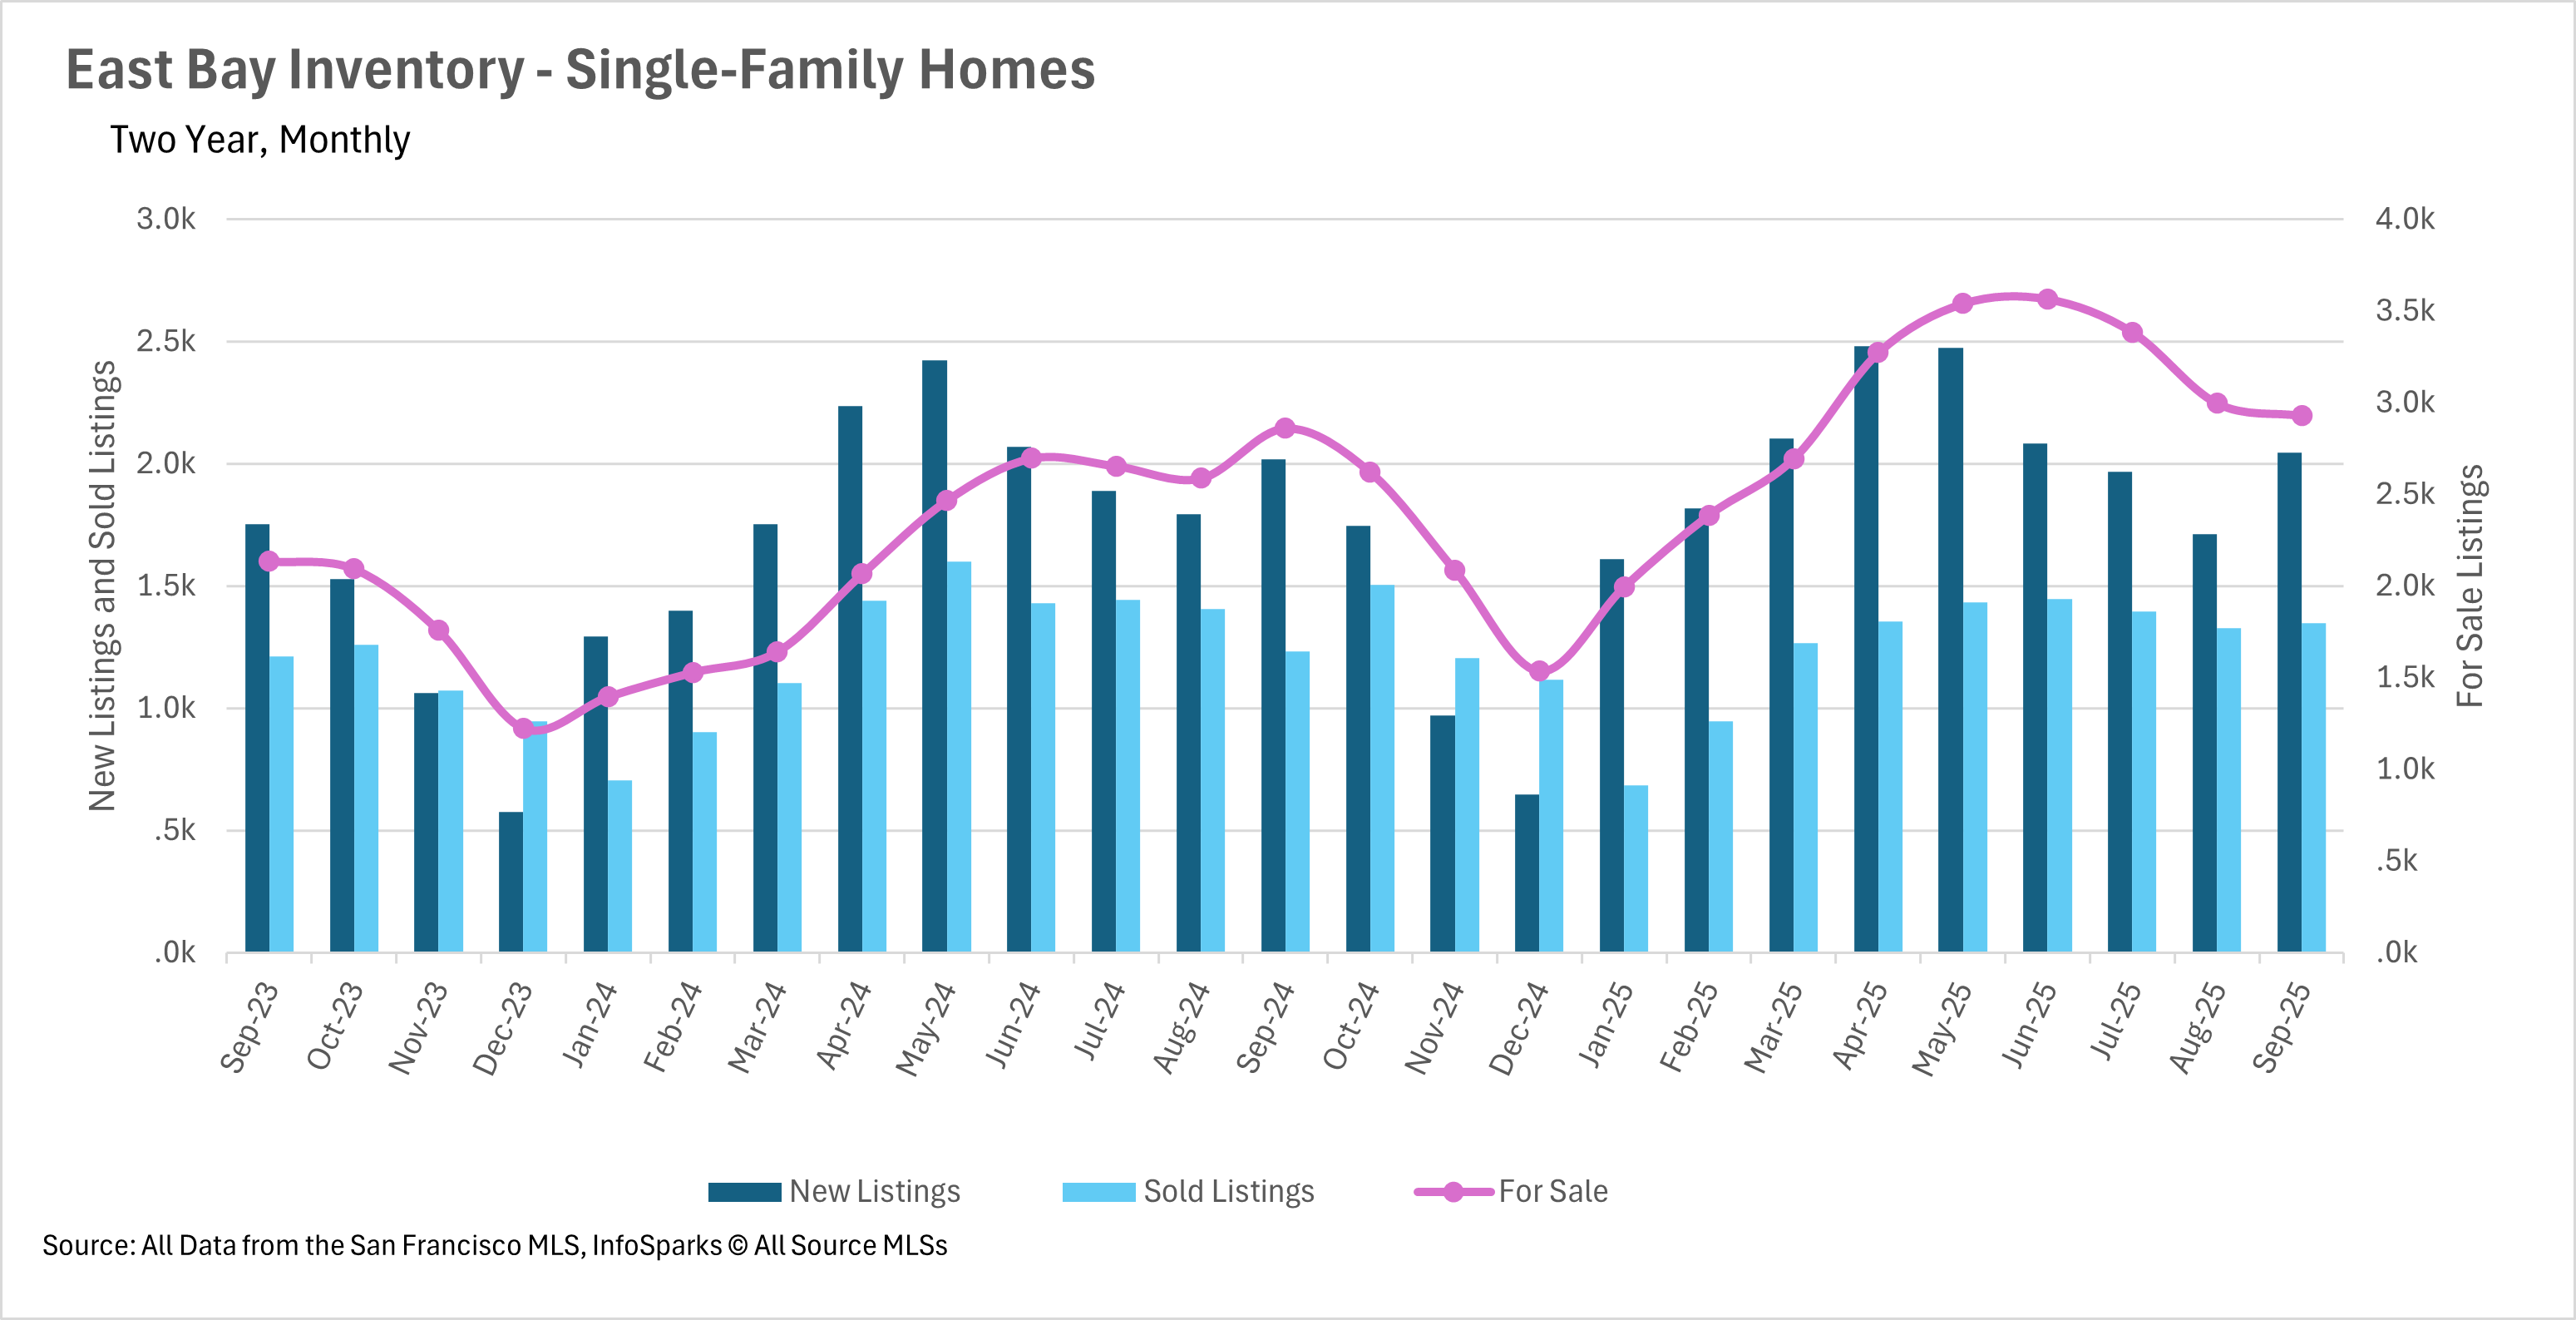
The North Bay experienced its first year-over-year inventory decline in several months, with single-family listings down 2.98%, driven by a sharp 14.75% drop in new listings and a 3.95% increase in sold listings, resulting in a dramatic 12.14% month-over-month inventory decline. Condo inventory remained slightly elevated at 3.49% above last year. The East Bay showed continued normalization with single-family inventory at just 2.41% above last year and condos at 6.75% above, both representing substantial improvements from summer peaks. The normalization was aided by nearly 10% more single-family homes sold in September compared to last year.
Market velocity accelerates despite percentage increases in days on market
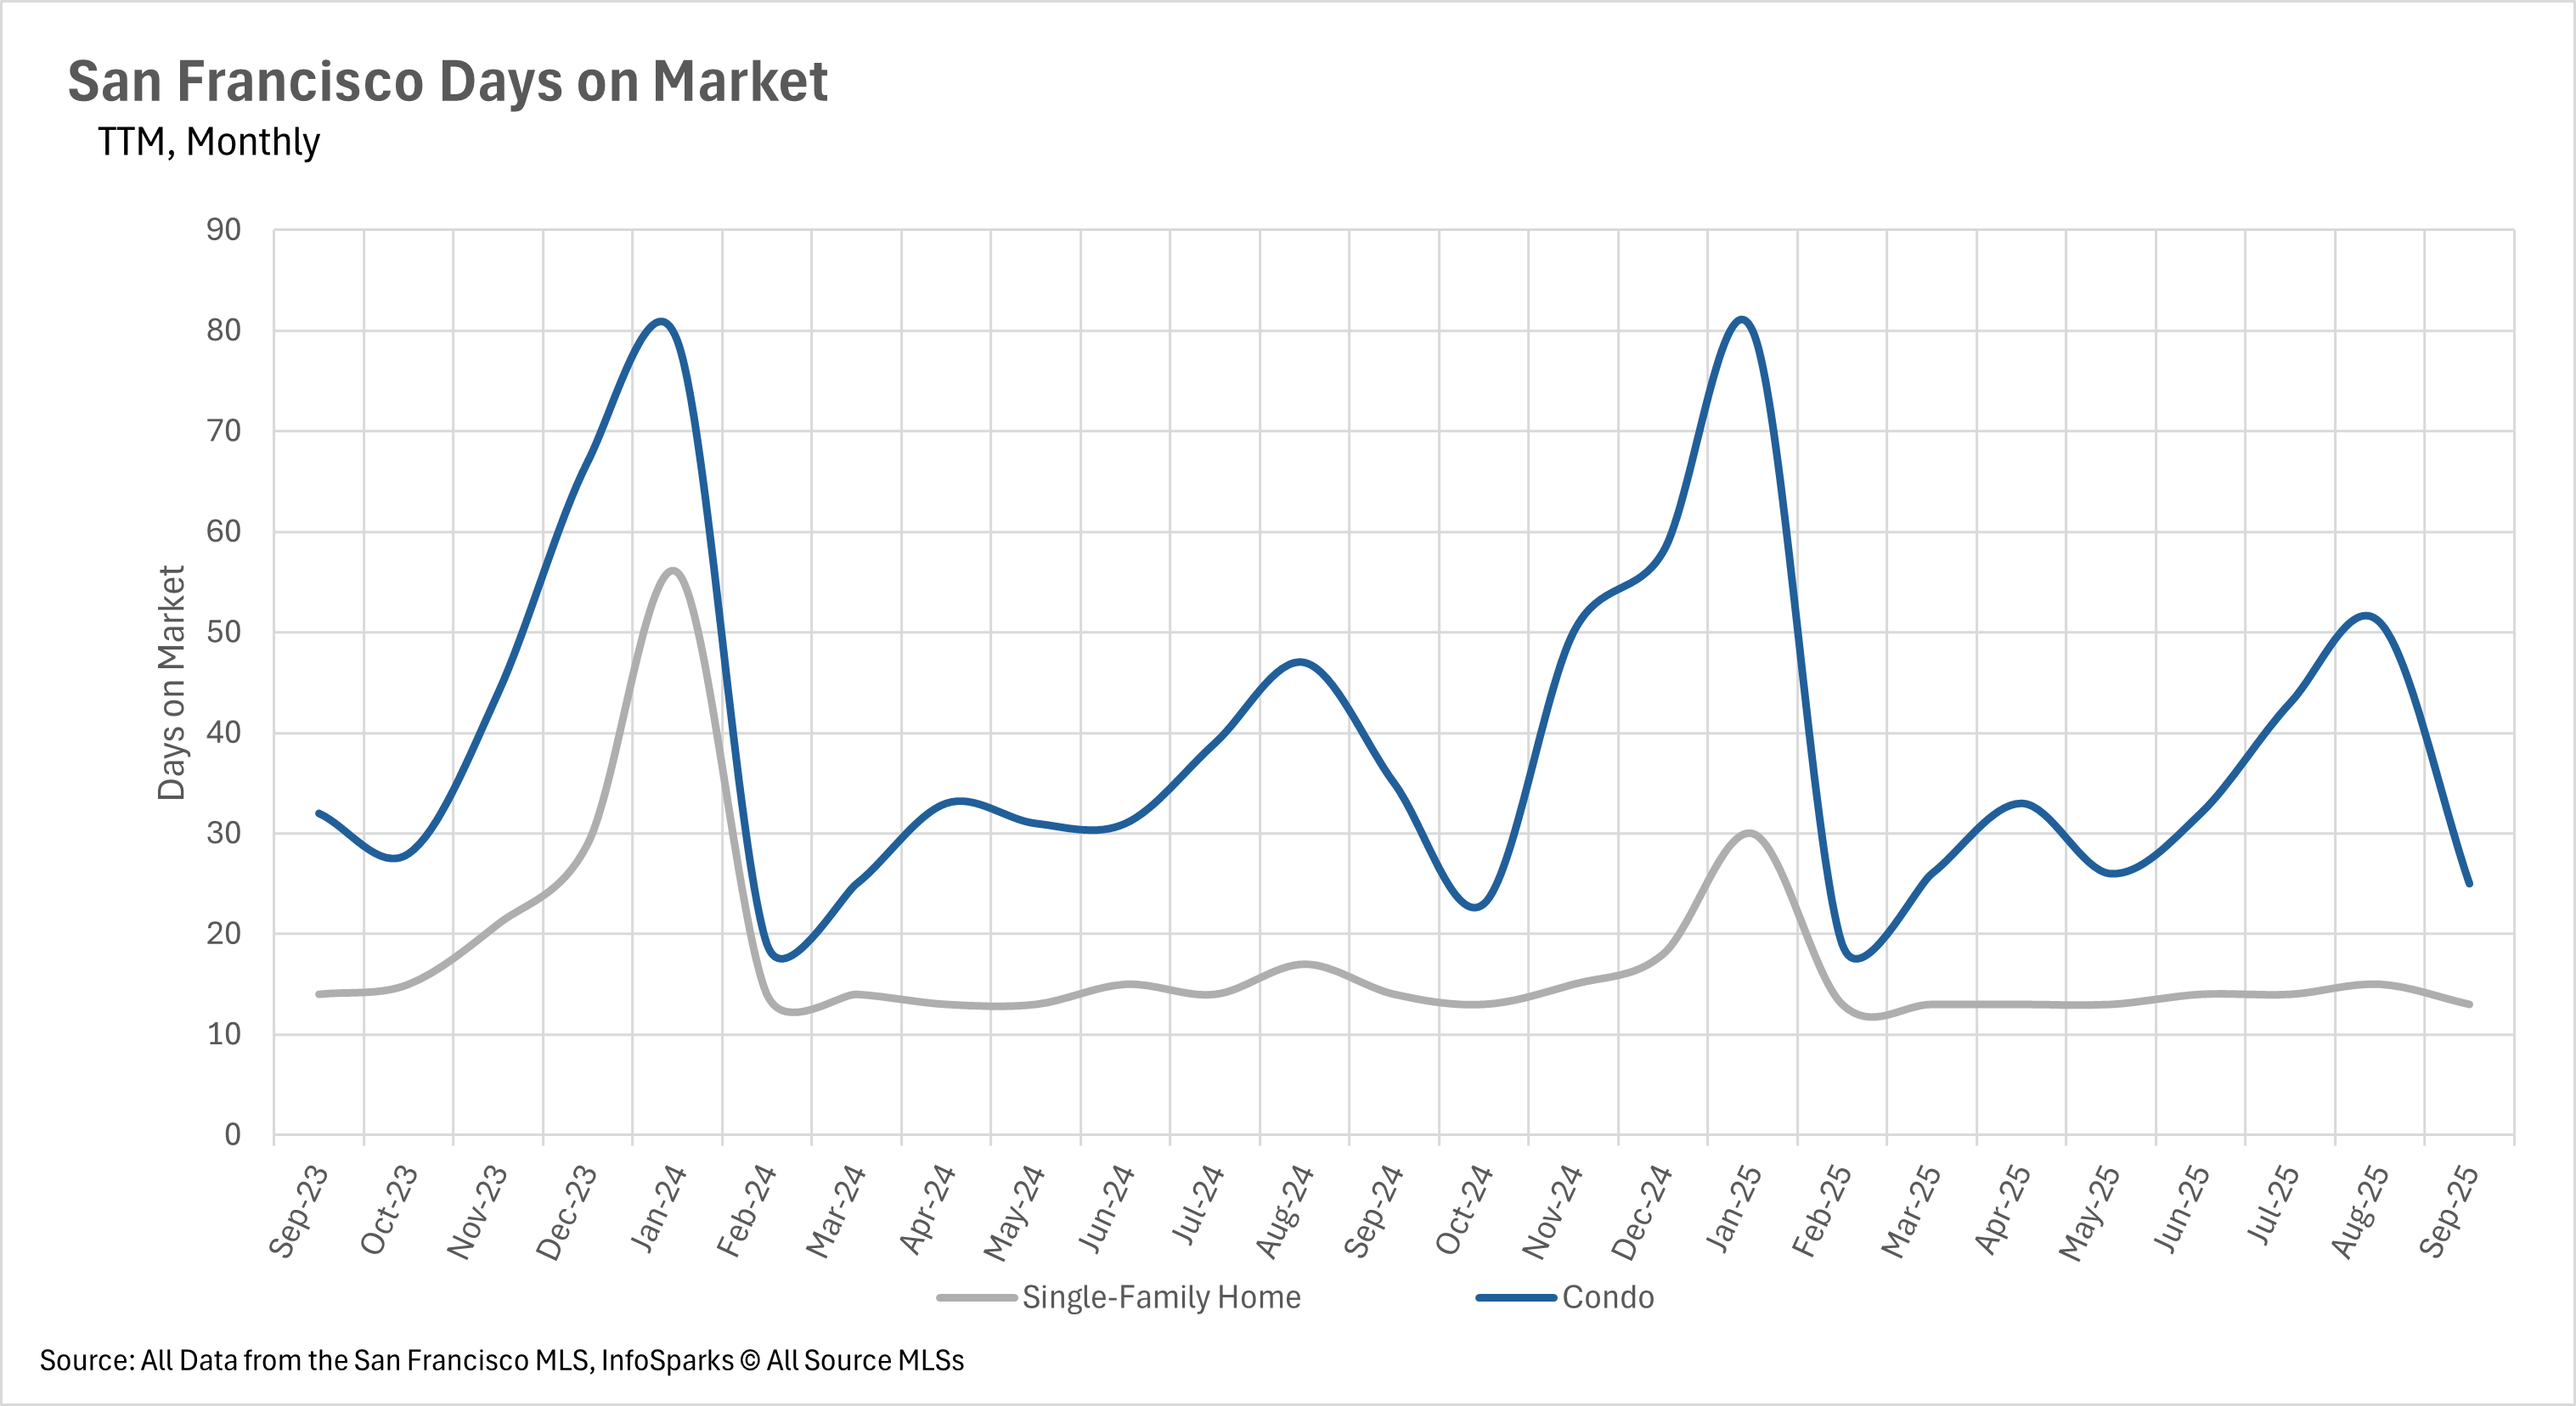
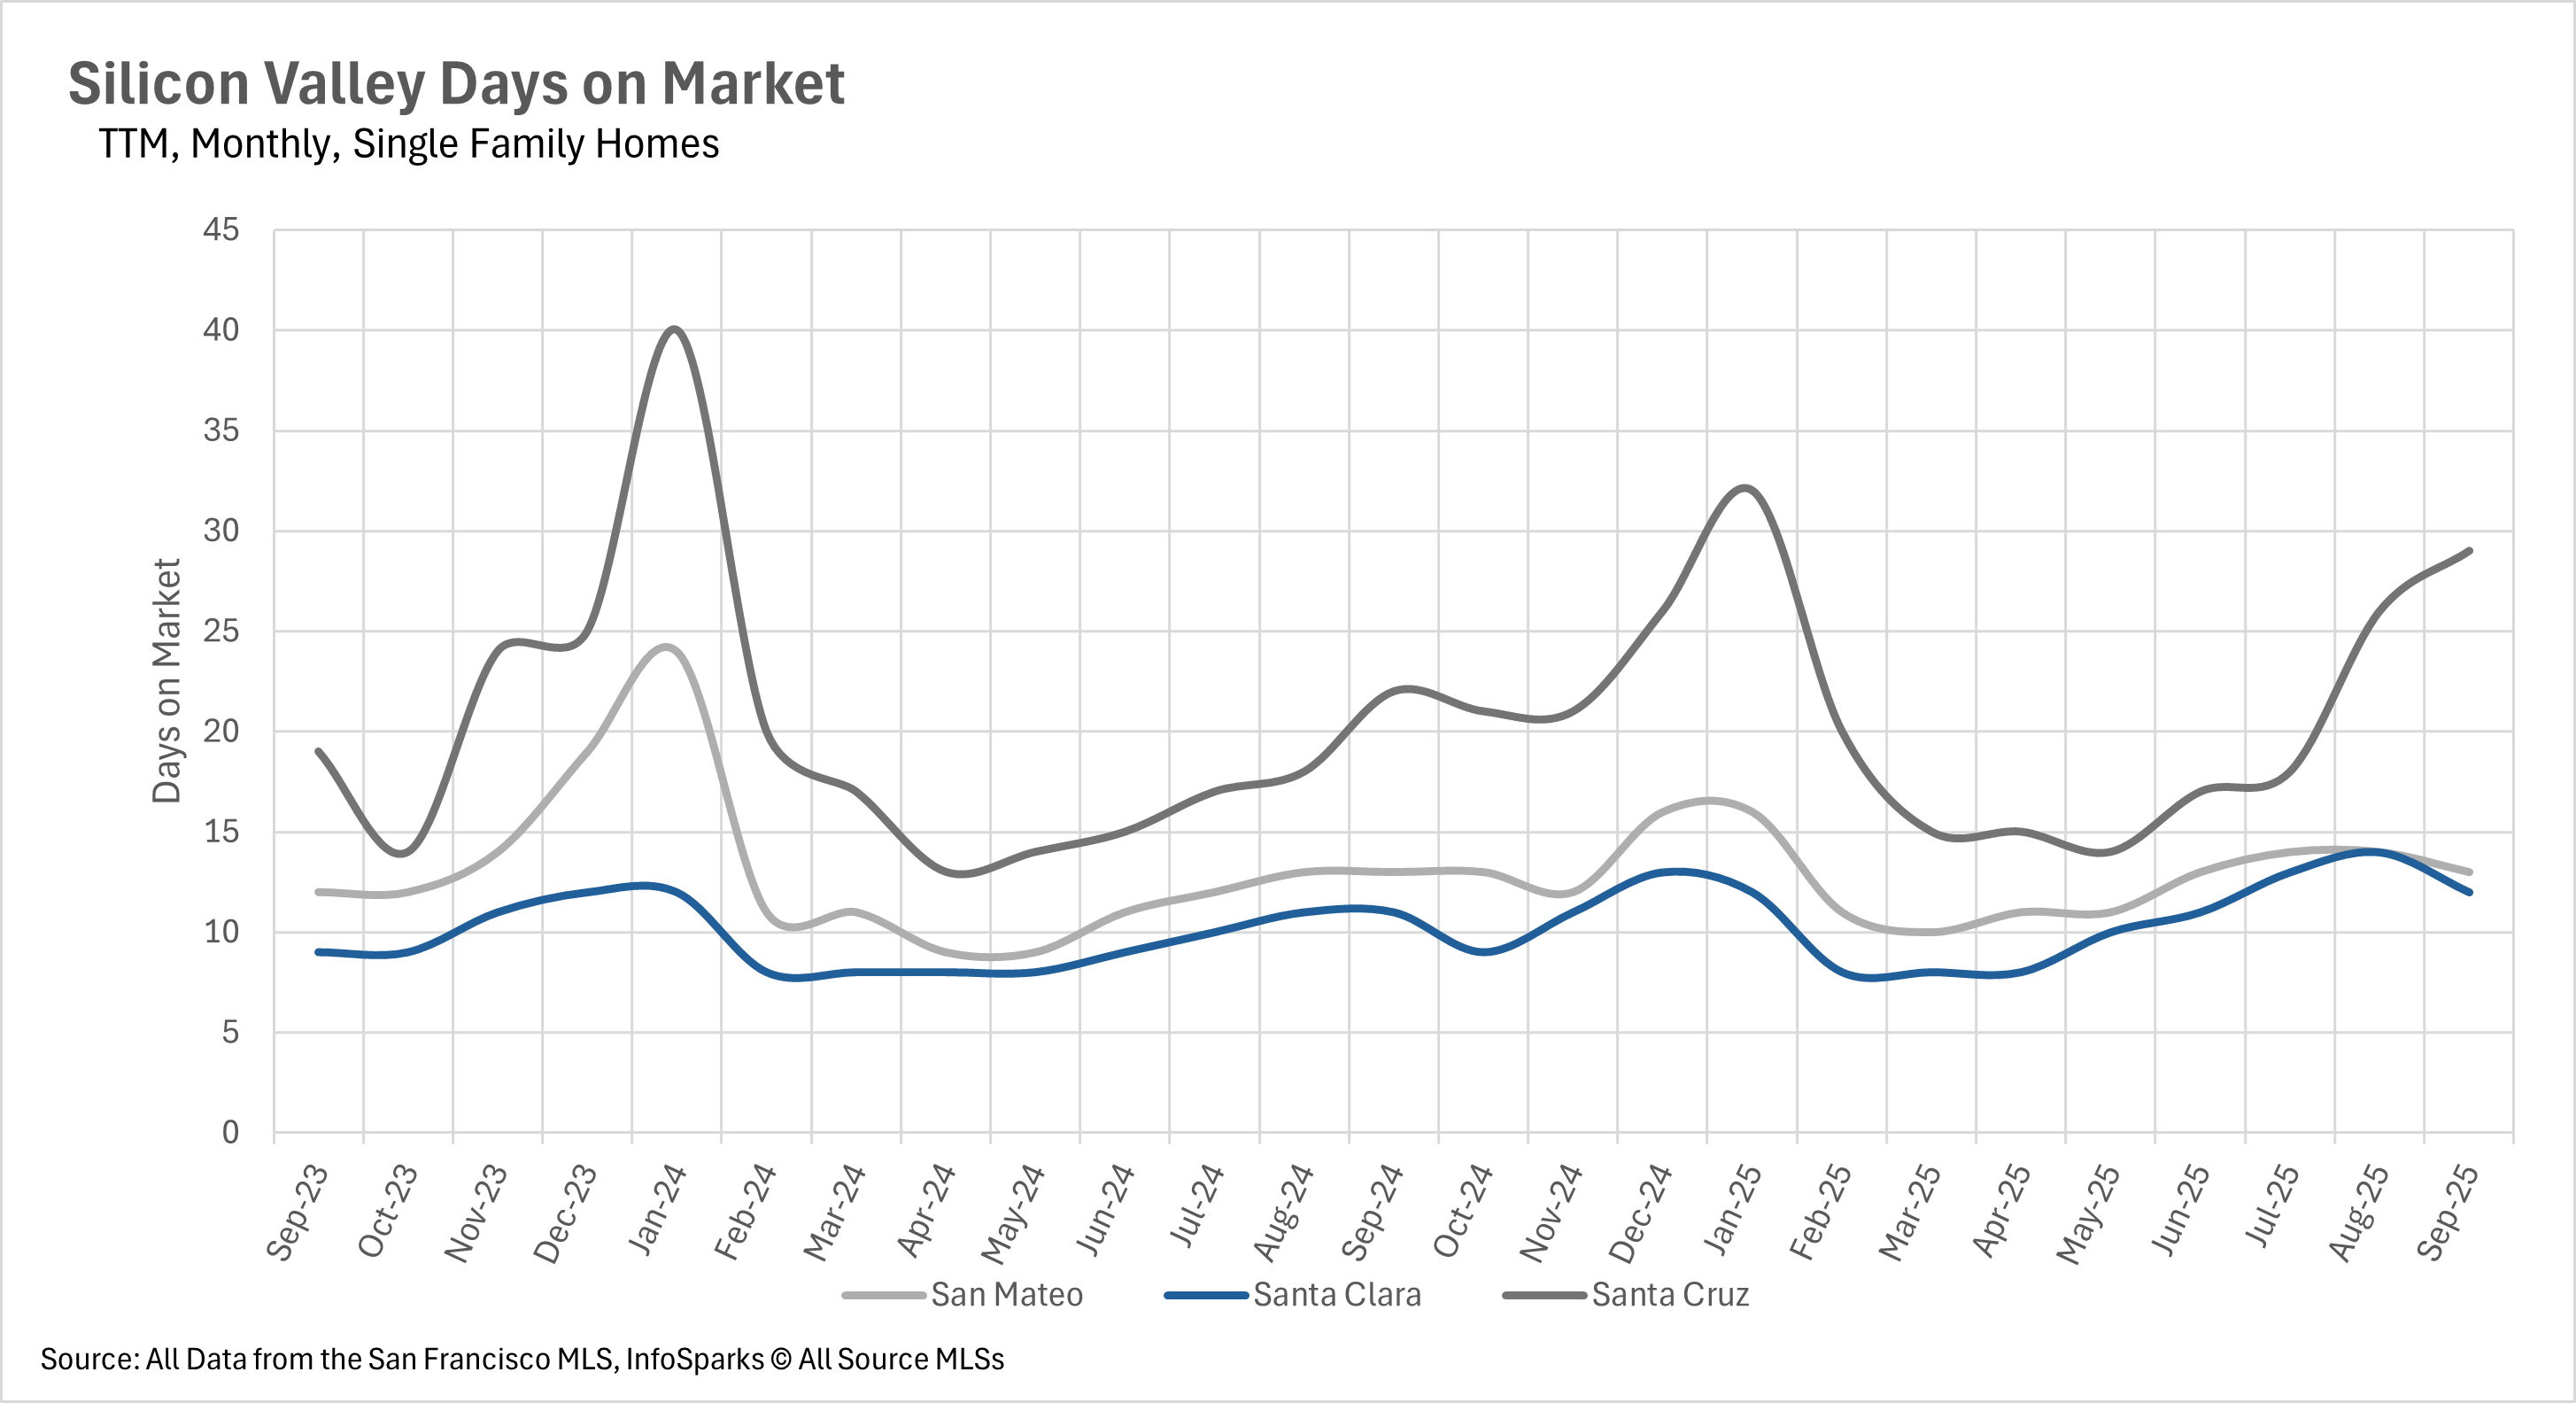
September revealed an interesting paradox across the Bay Area: while percentage increases in days on market appear significant, absolute numbers remain remarkably low, indicating strong underlying demand. San Francisco demonstrated accelerating velocity with single-family homes spending just 13 days on market (down 7.14% year-over-year) and condos dropping to 25 days (down 28.57% year-over-year and 50.98% month-over-month). Silicon Valley maintained breakneck pace for single-family homes, with San Mateo and Santa Clara County listings scooped up in under two weeks, and Santa Cruz County at just 29 days.
 
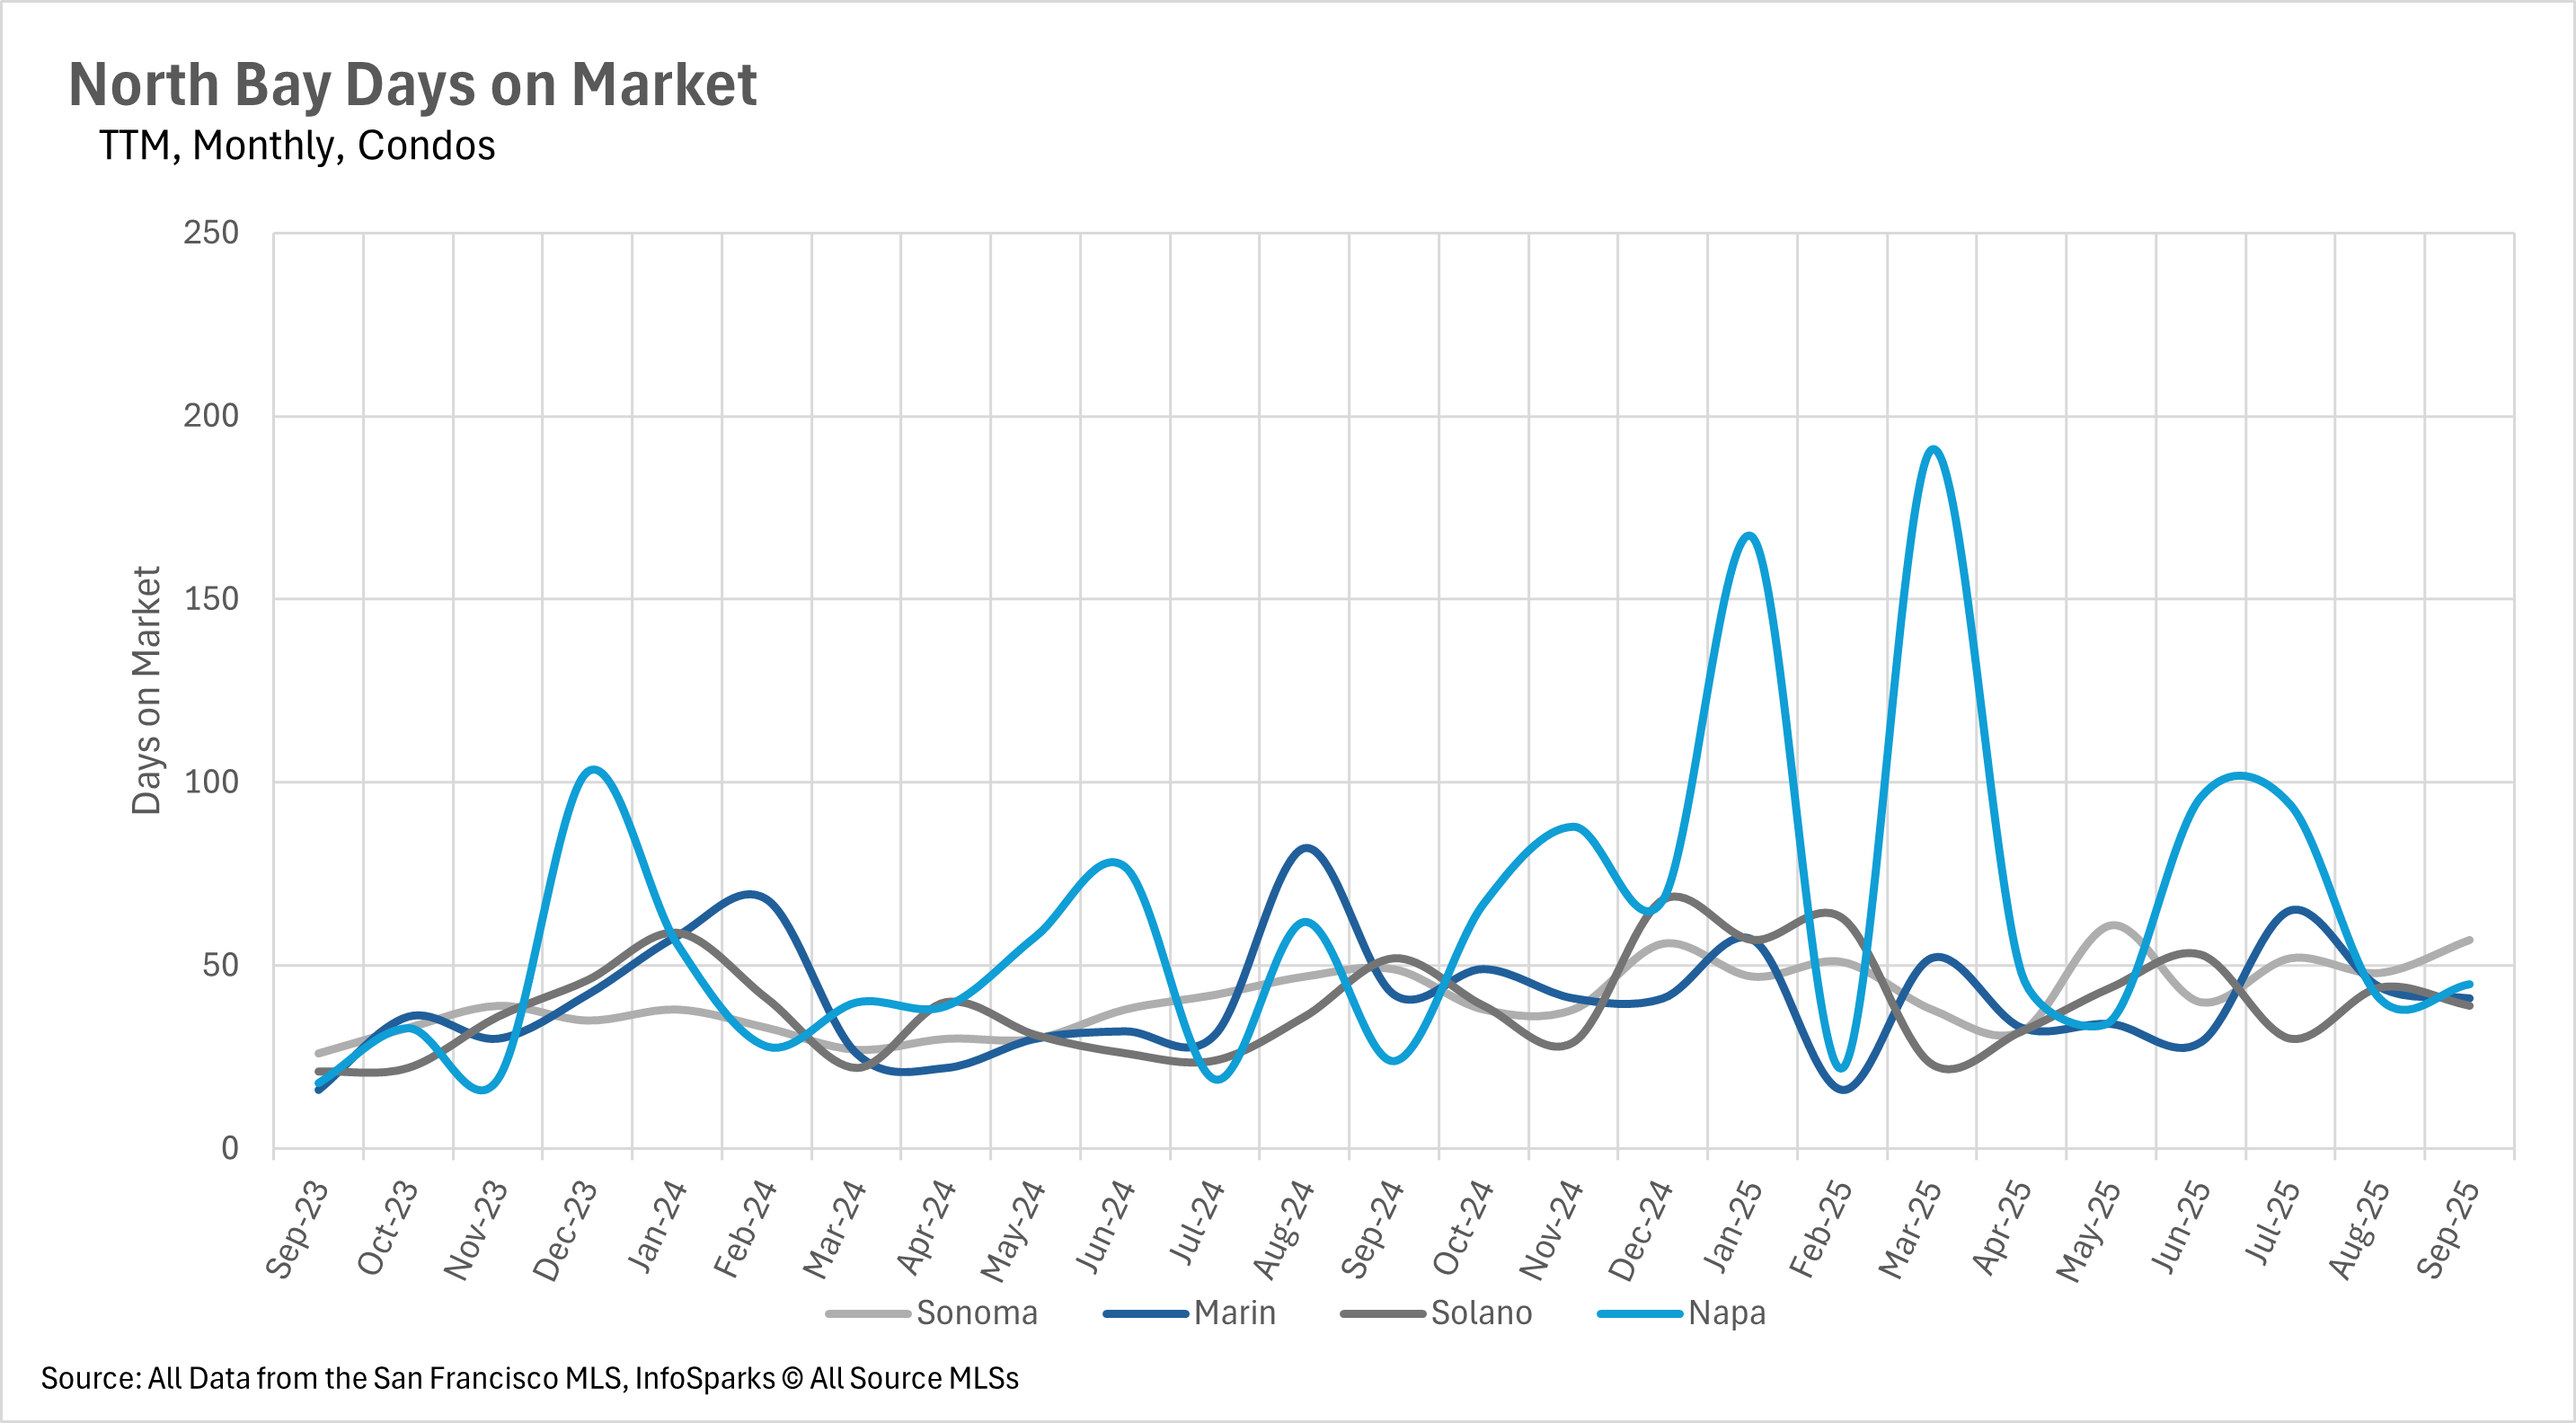
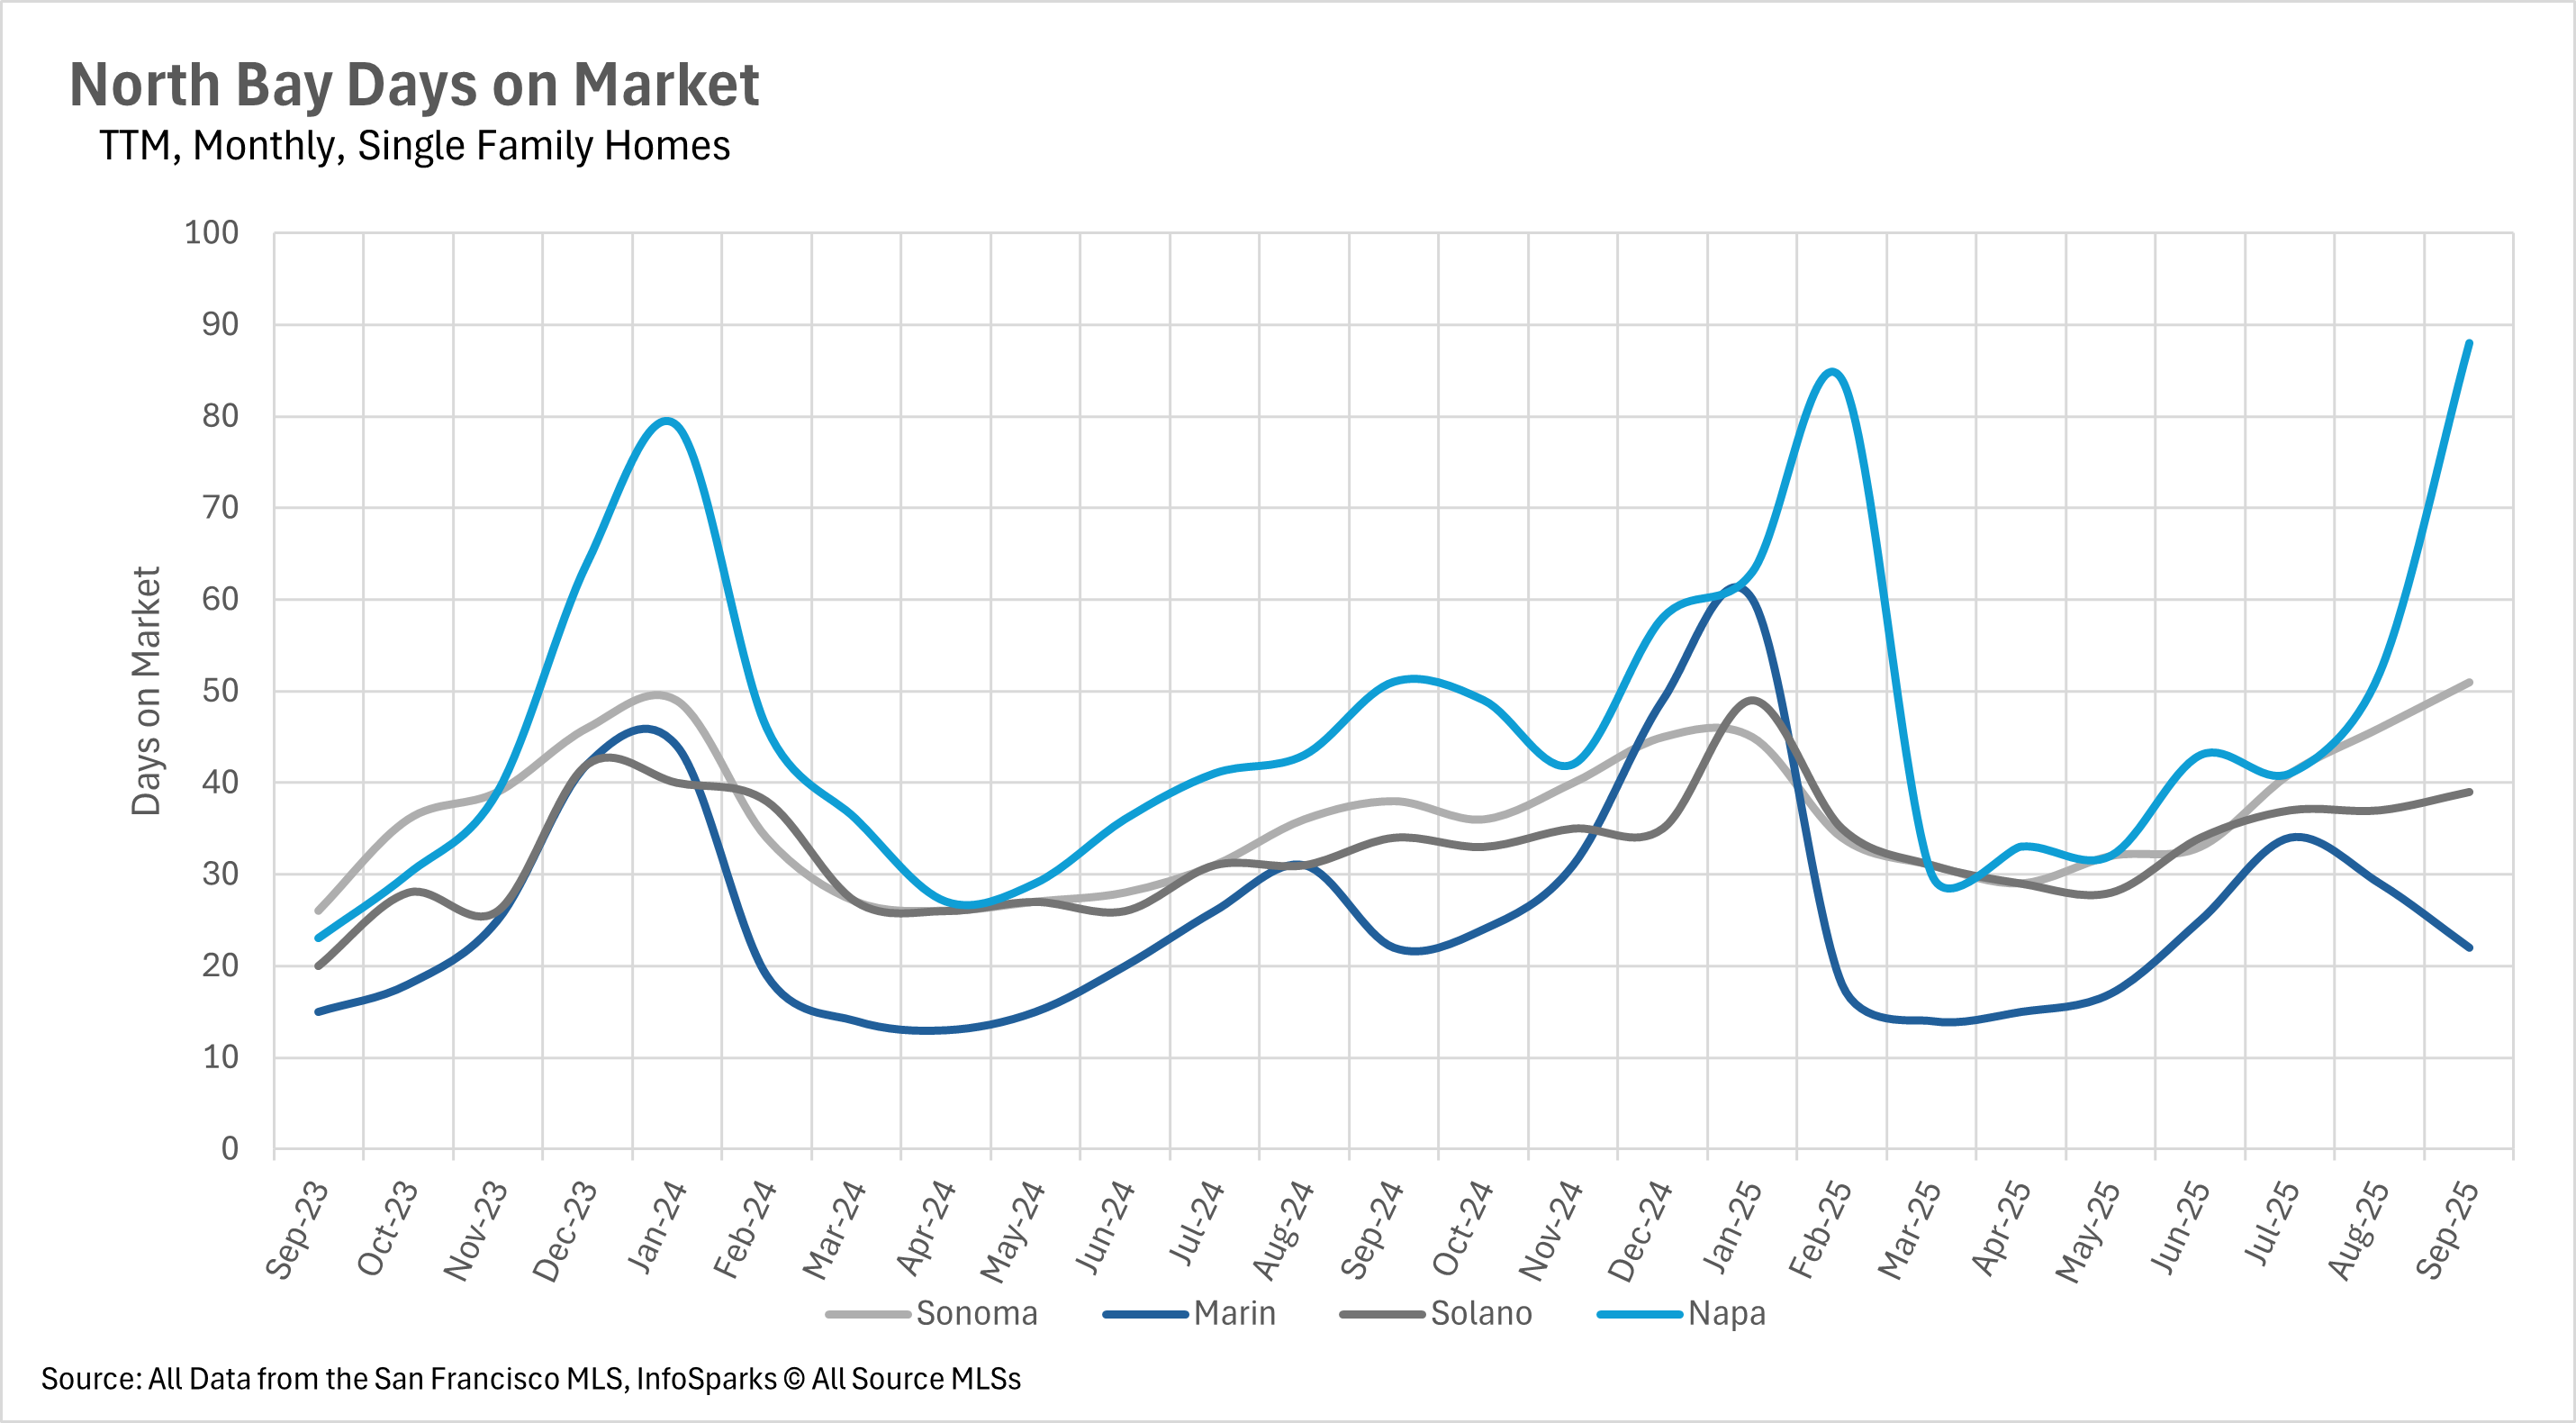
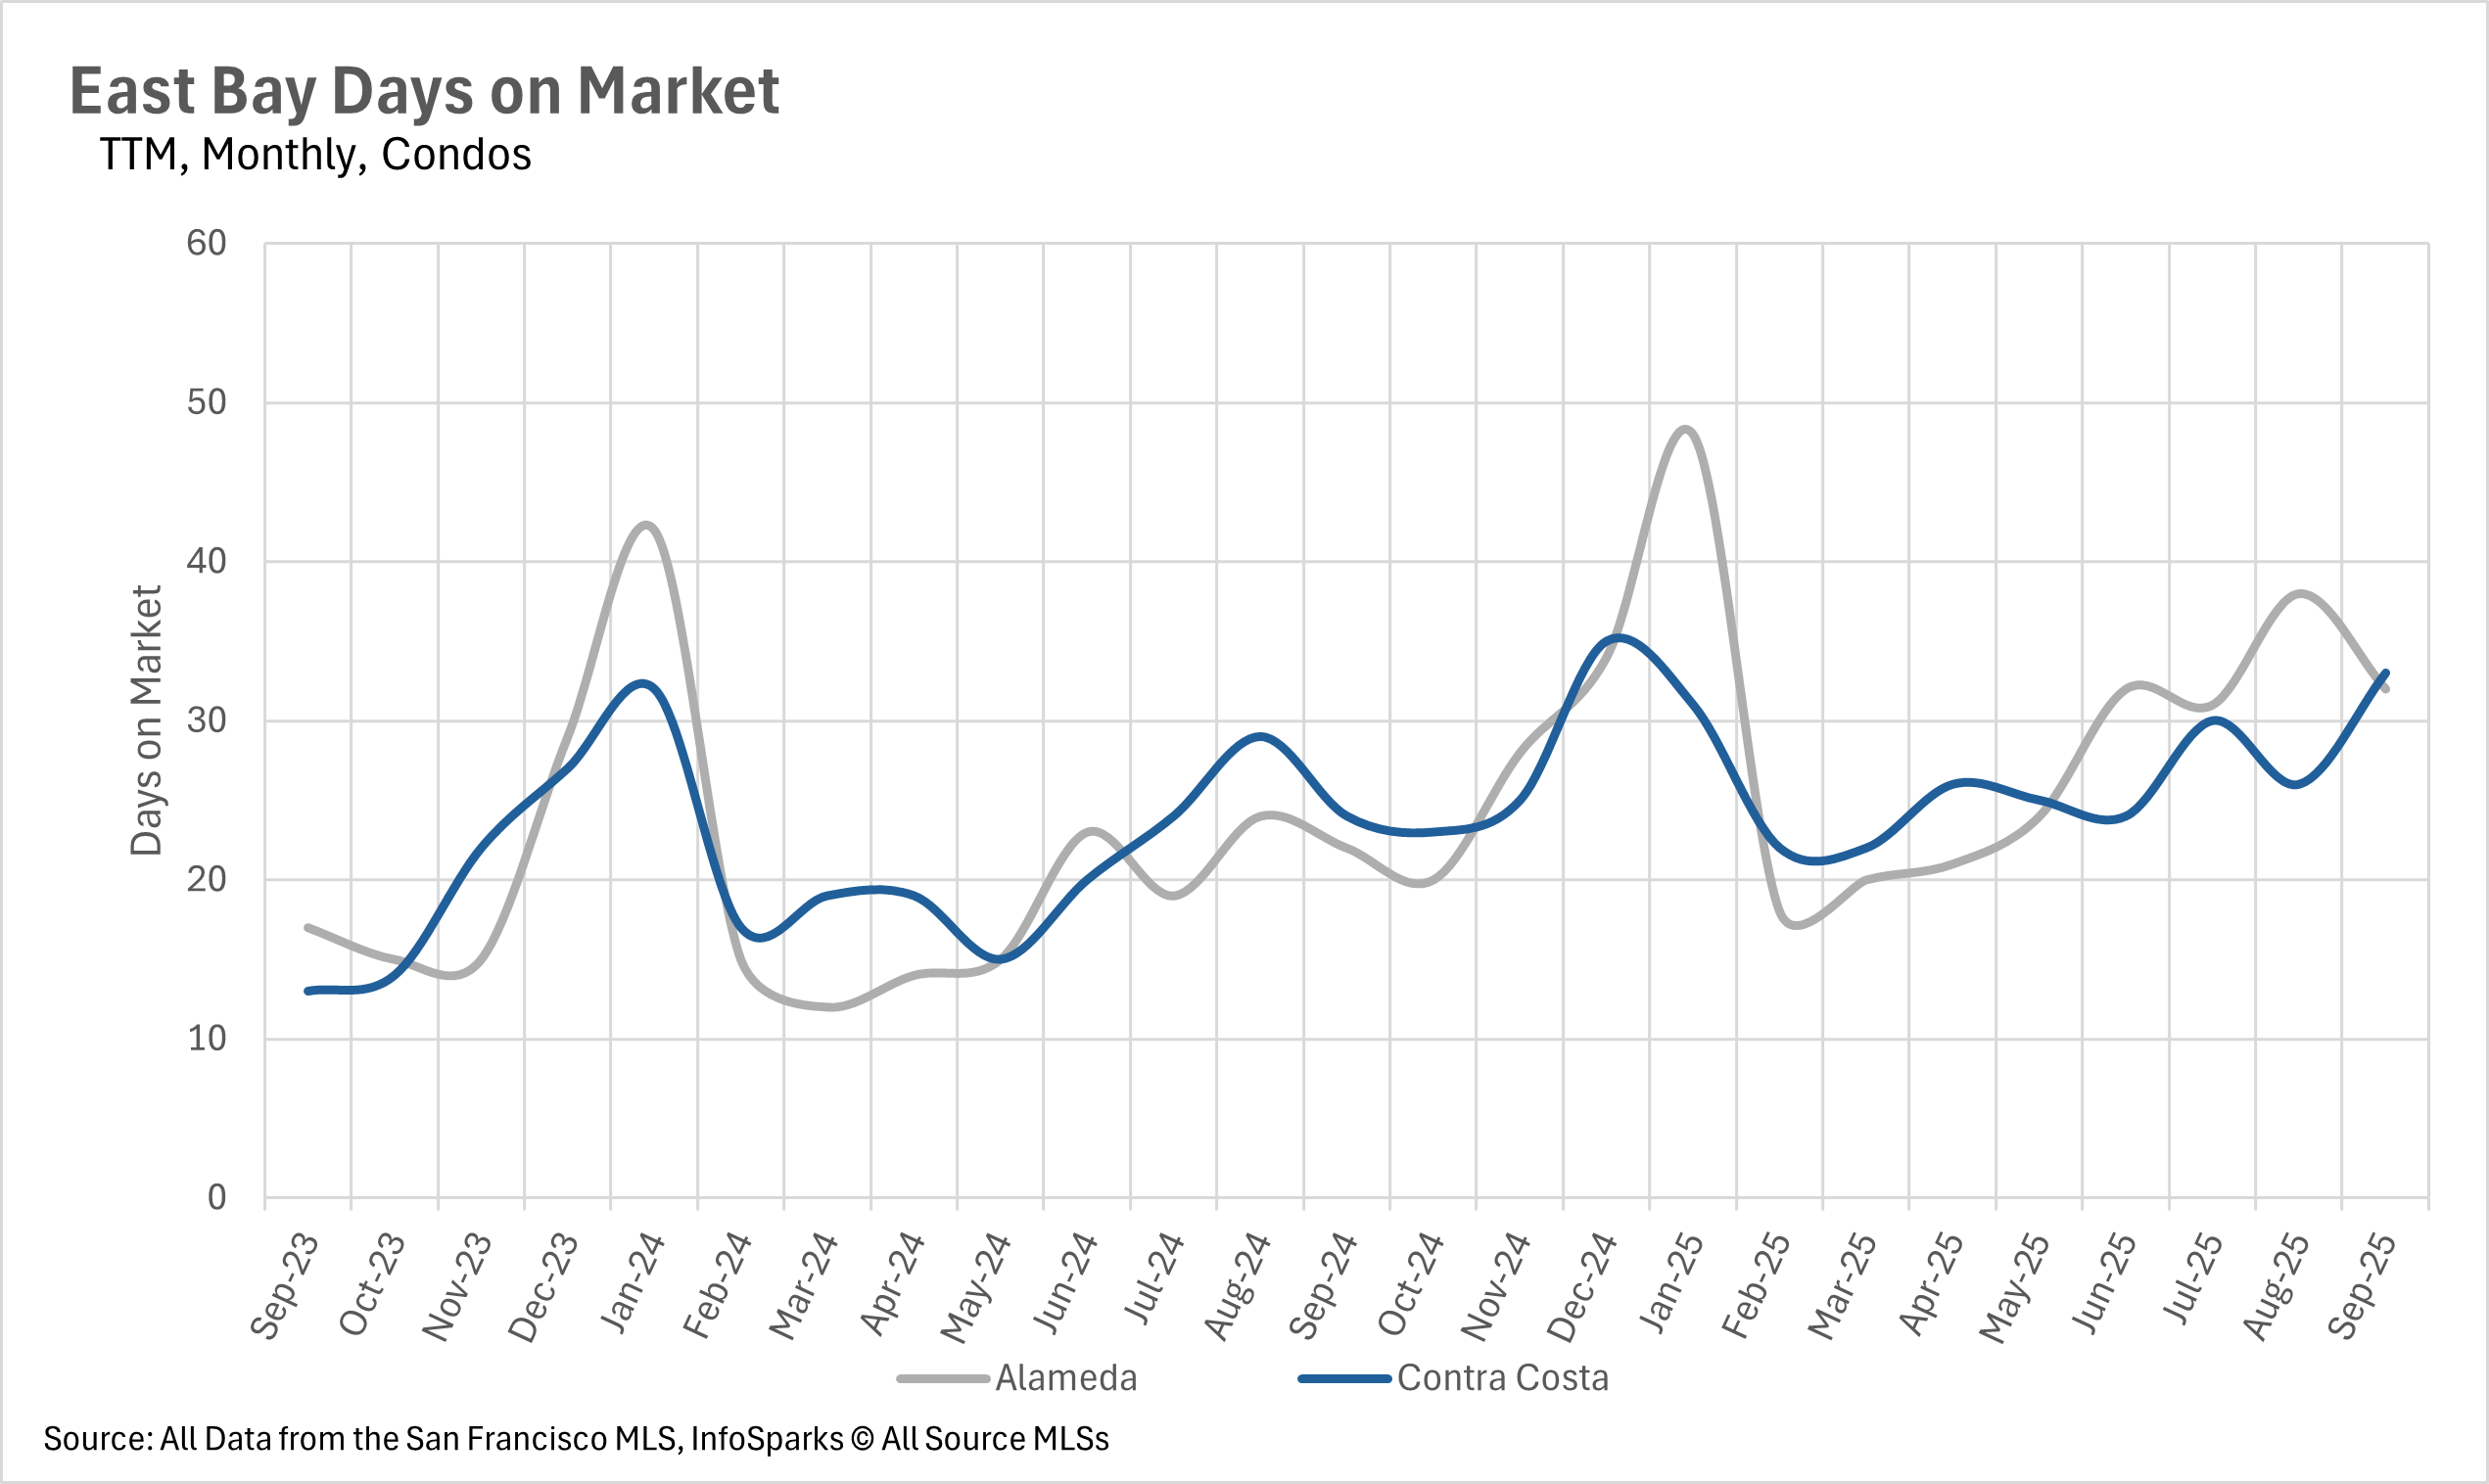
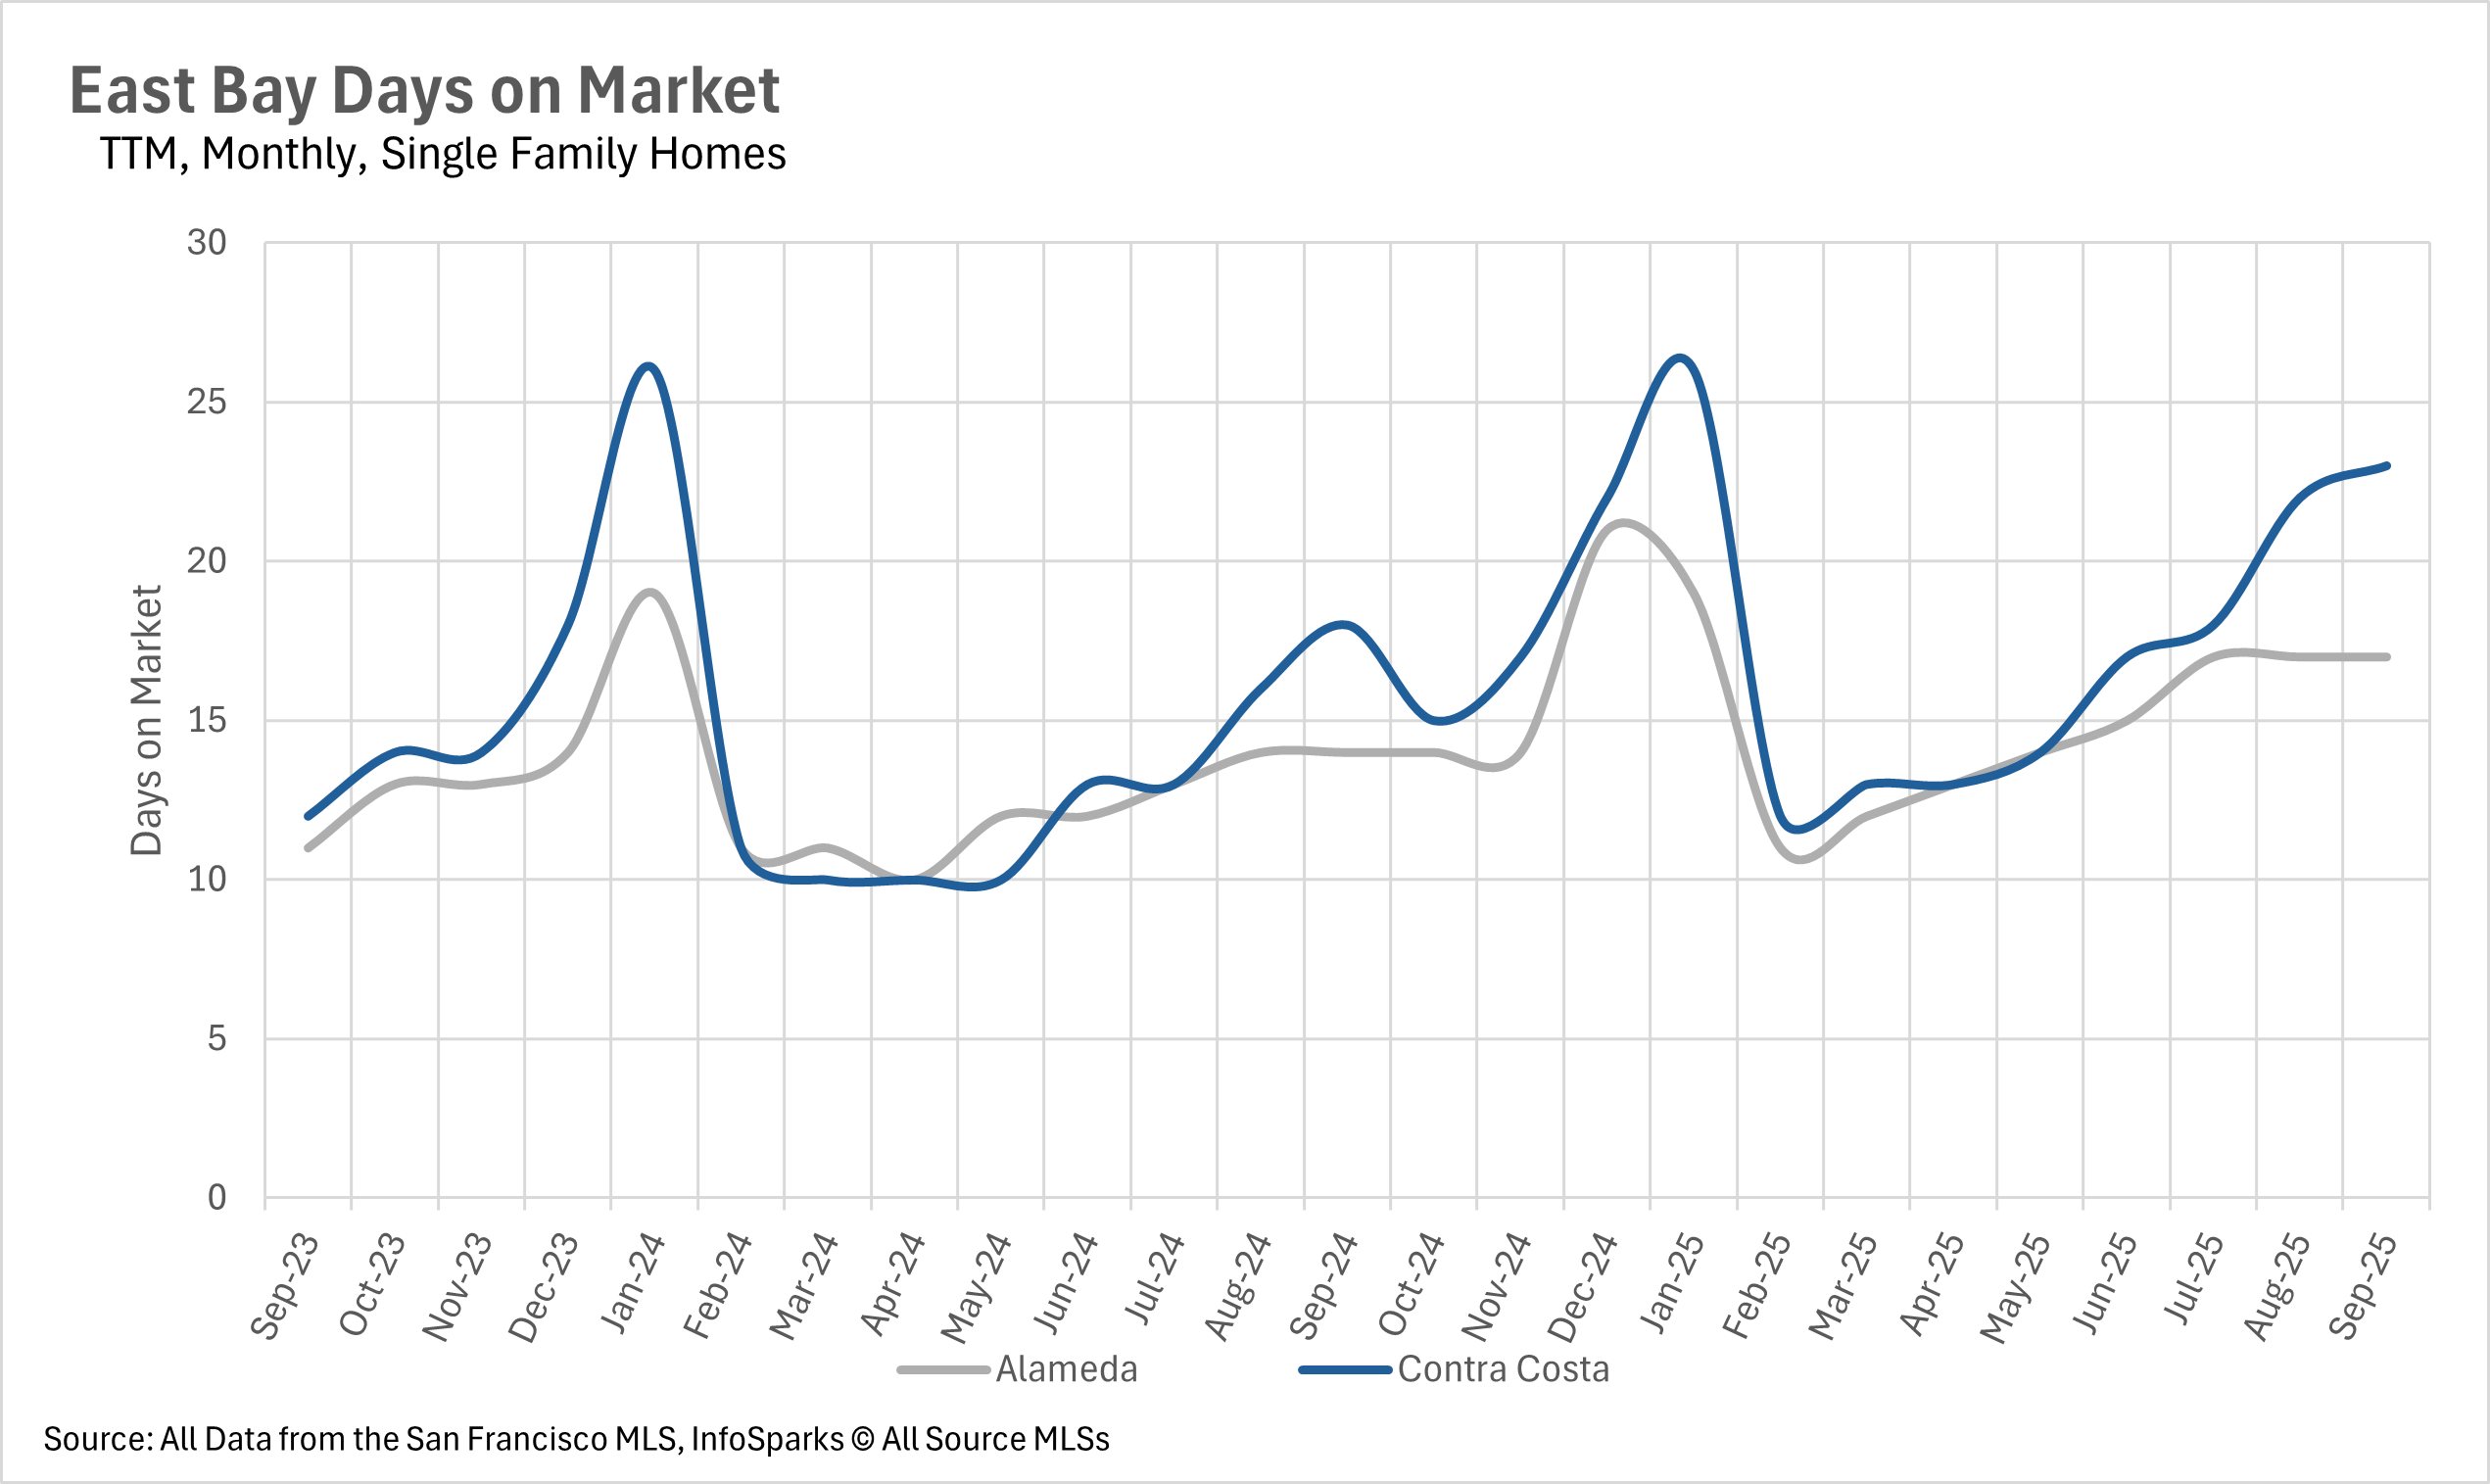
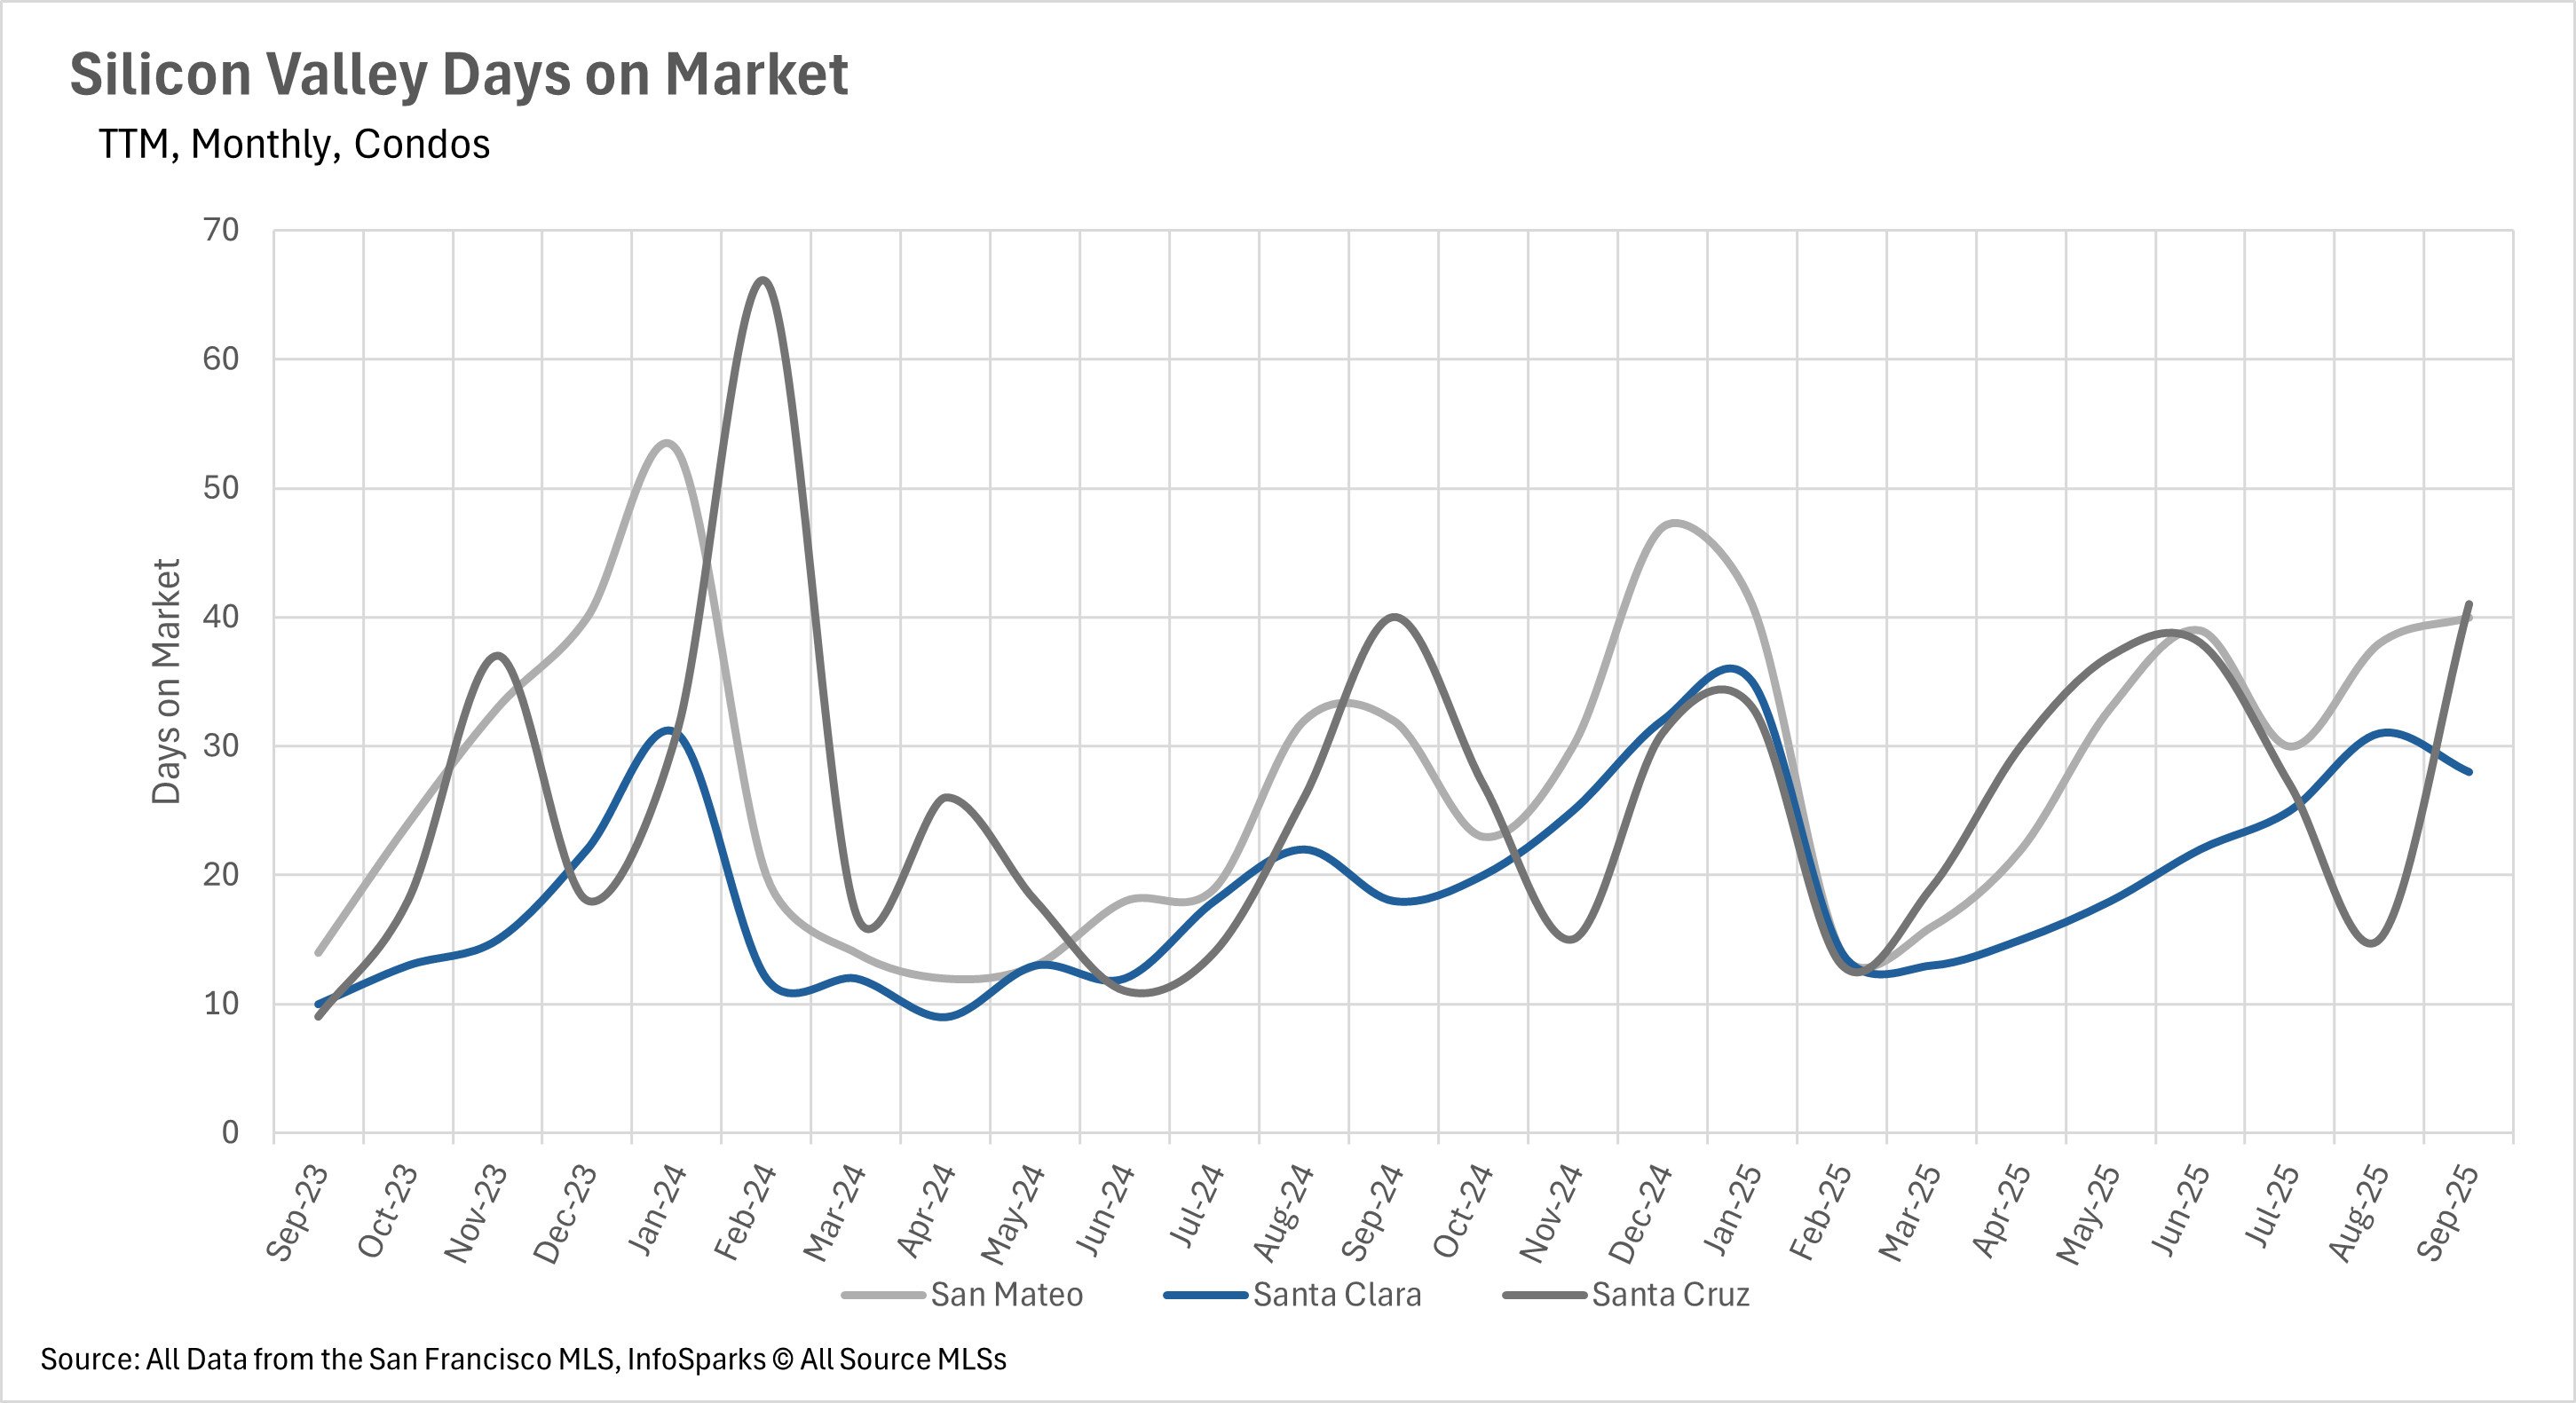
However, condos are experiencing significant delays with San Mateo at 40 days (+25% year-over-year), Santa Clara at 28 days (+55.56%), and Santa Cruz at 41 days (+2.5%). The East Bay showed significant percentage increases but maintained relatively quick absolute times, with single-family homes spending 17 days in Alameda County (+21.43% year-over-year) and 23 days in Contra Costa (+27.78%). Condos moved in 32 and 33 days respectively, despite year-over-year increases of 45.45% and 37.50%. The North Bay presented the most dramatic contrast, with Napa County's average listing spending 88 days on market (up 72.55% year-over-year and 69.23% month-over-month), while other counties showed more moderate increases. Marin County bucked all trends, maintaining the exact same days on market as last year.
Seller's market momentum builds across property types and regions
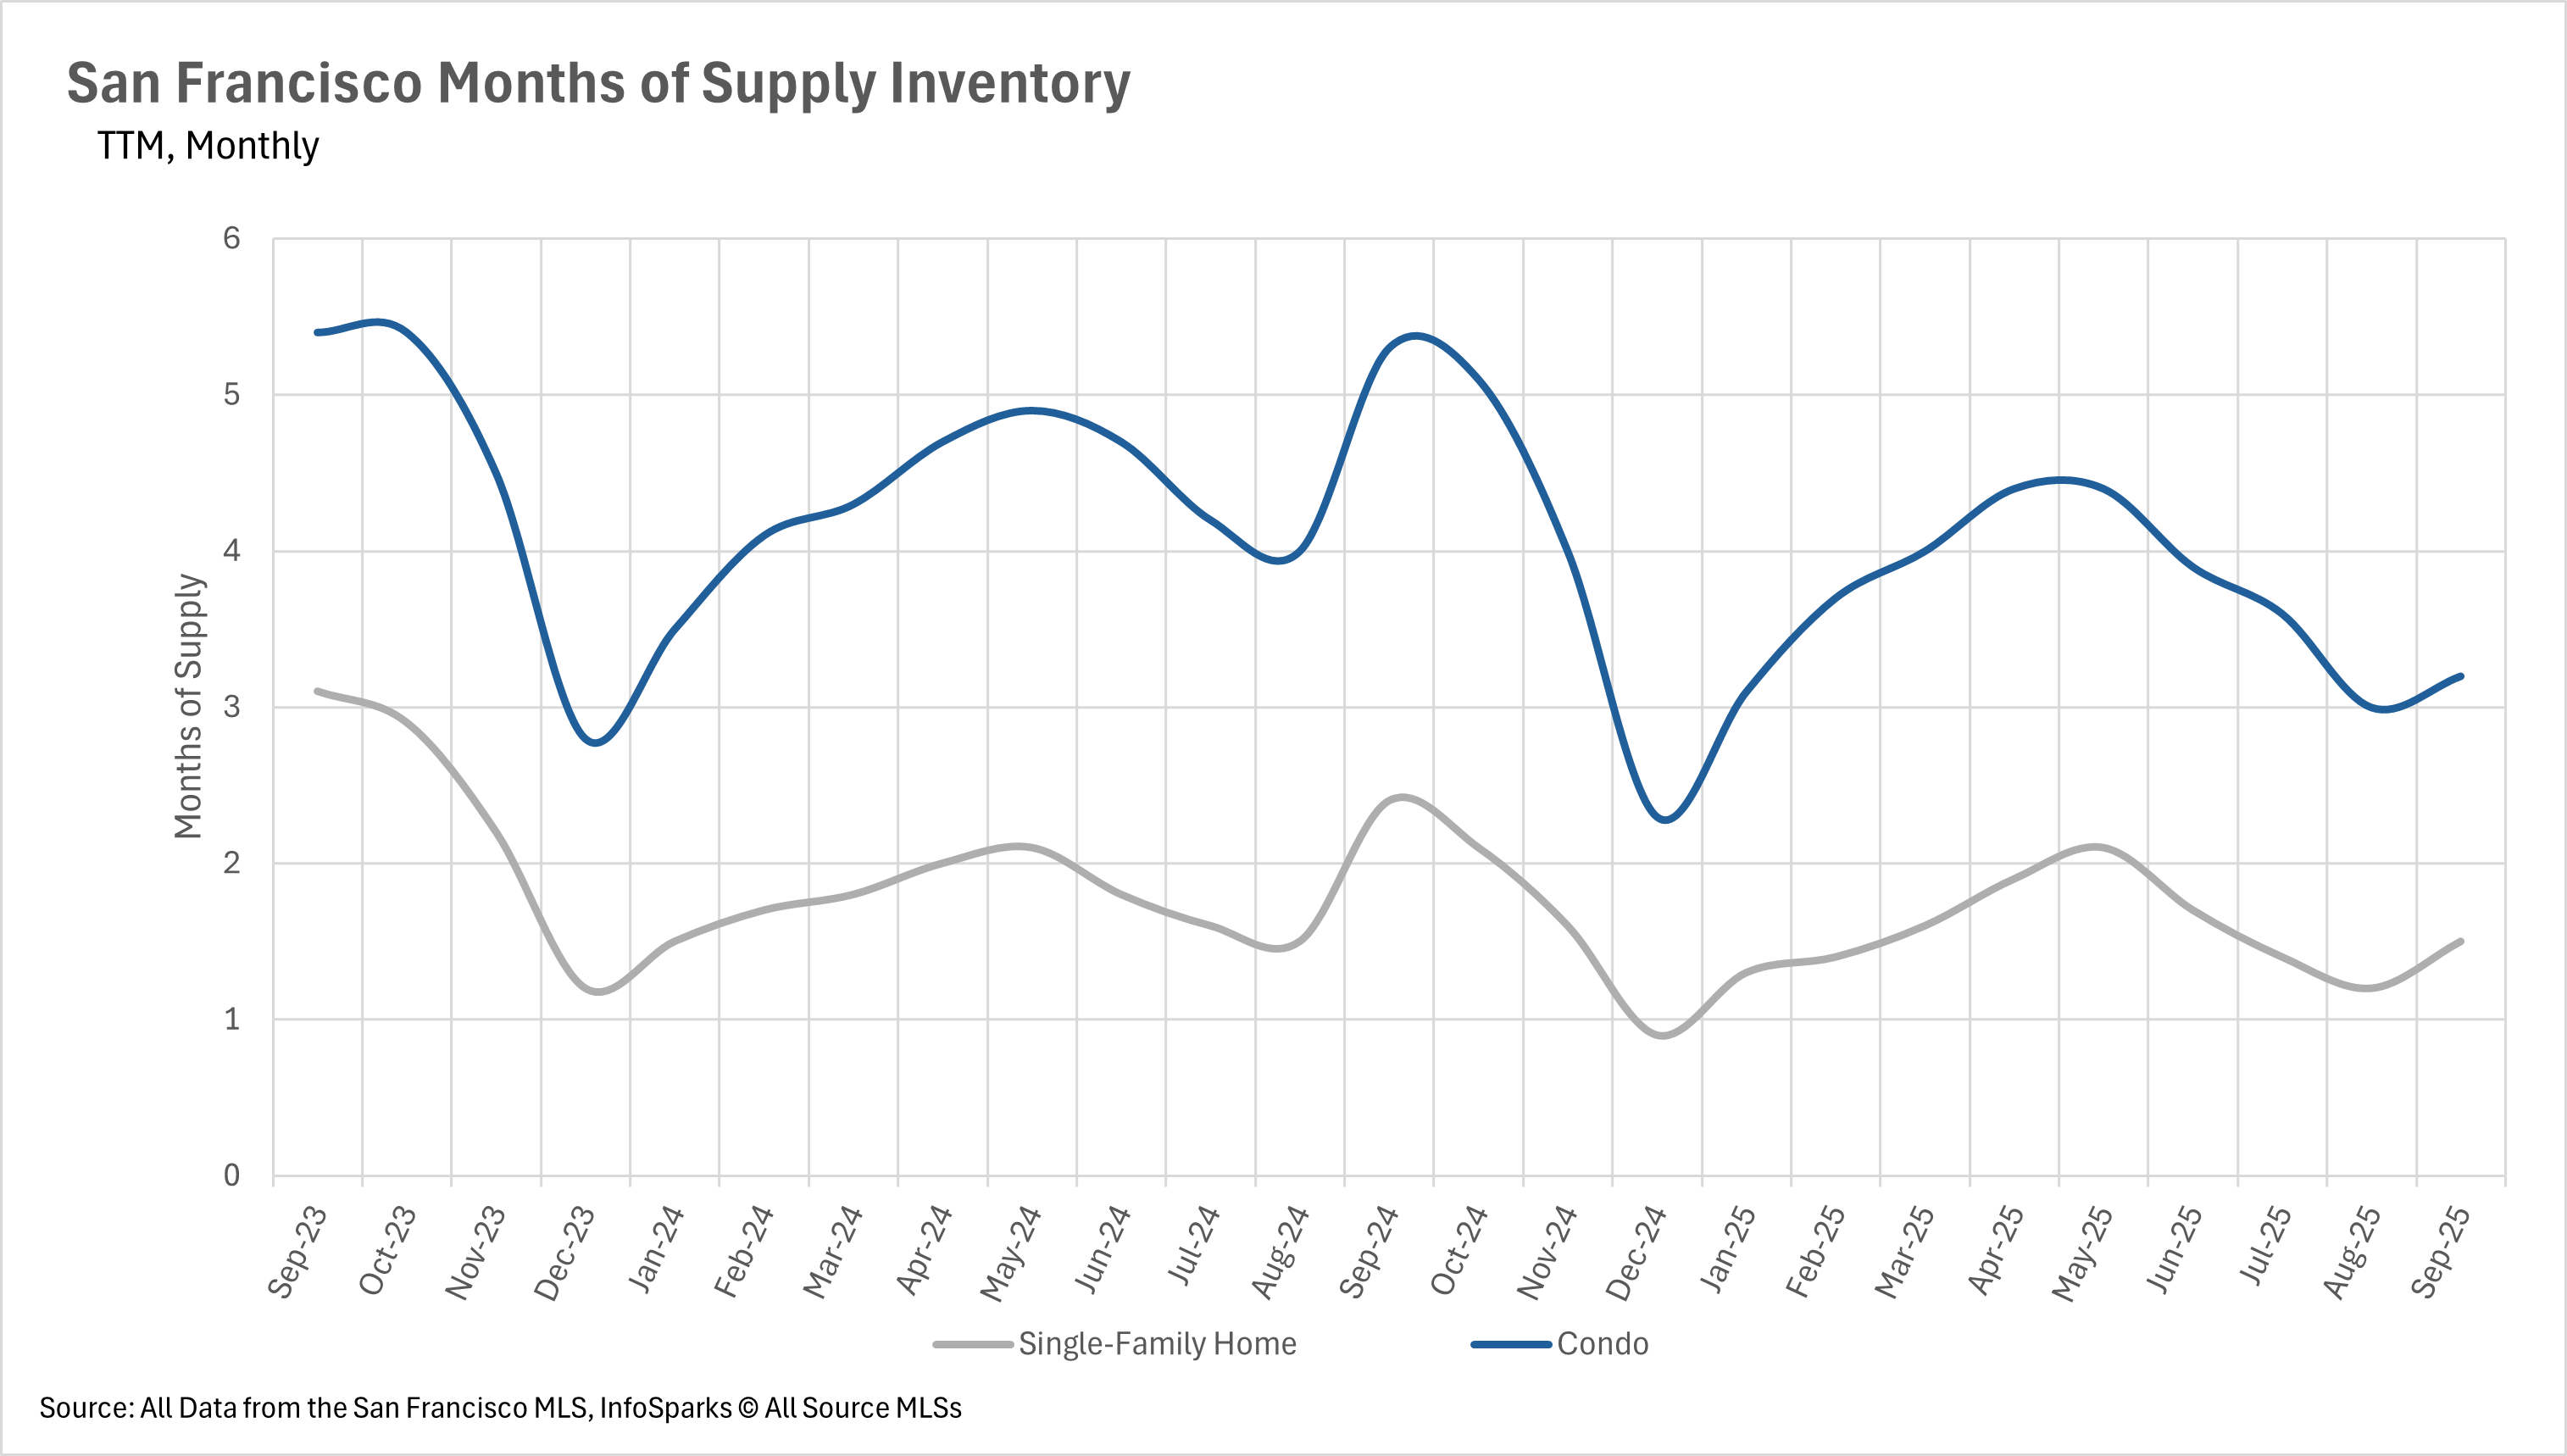
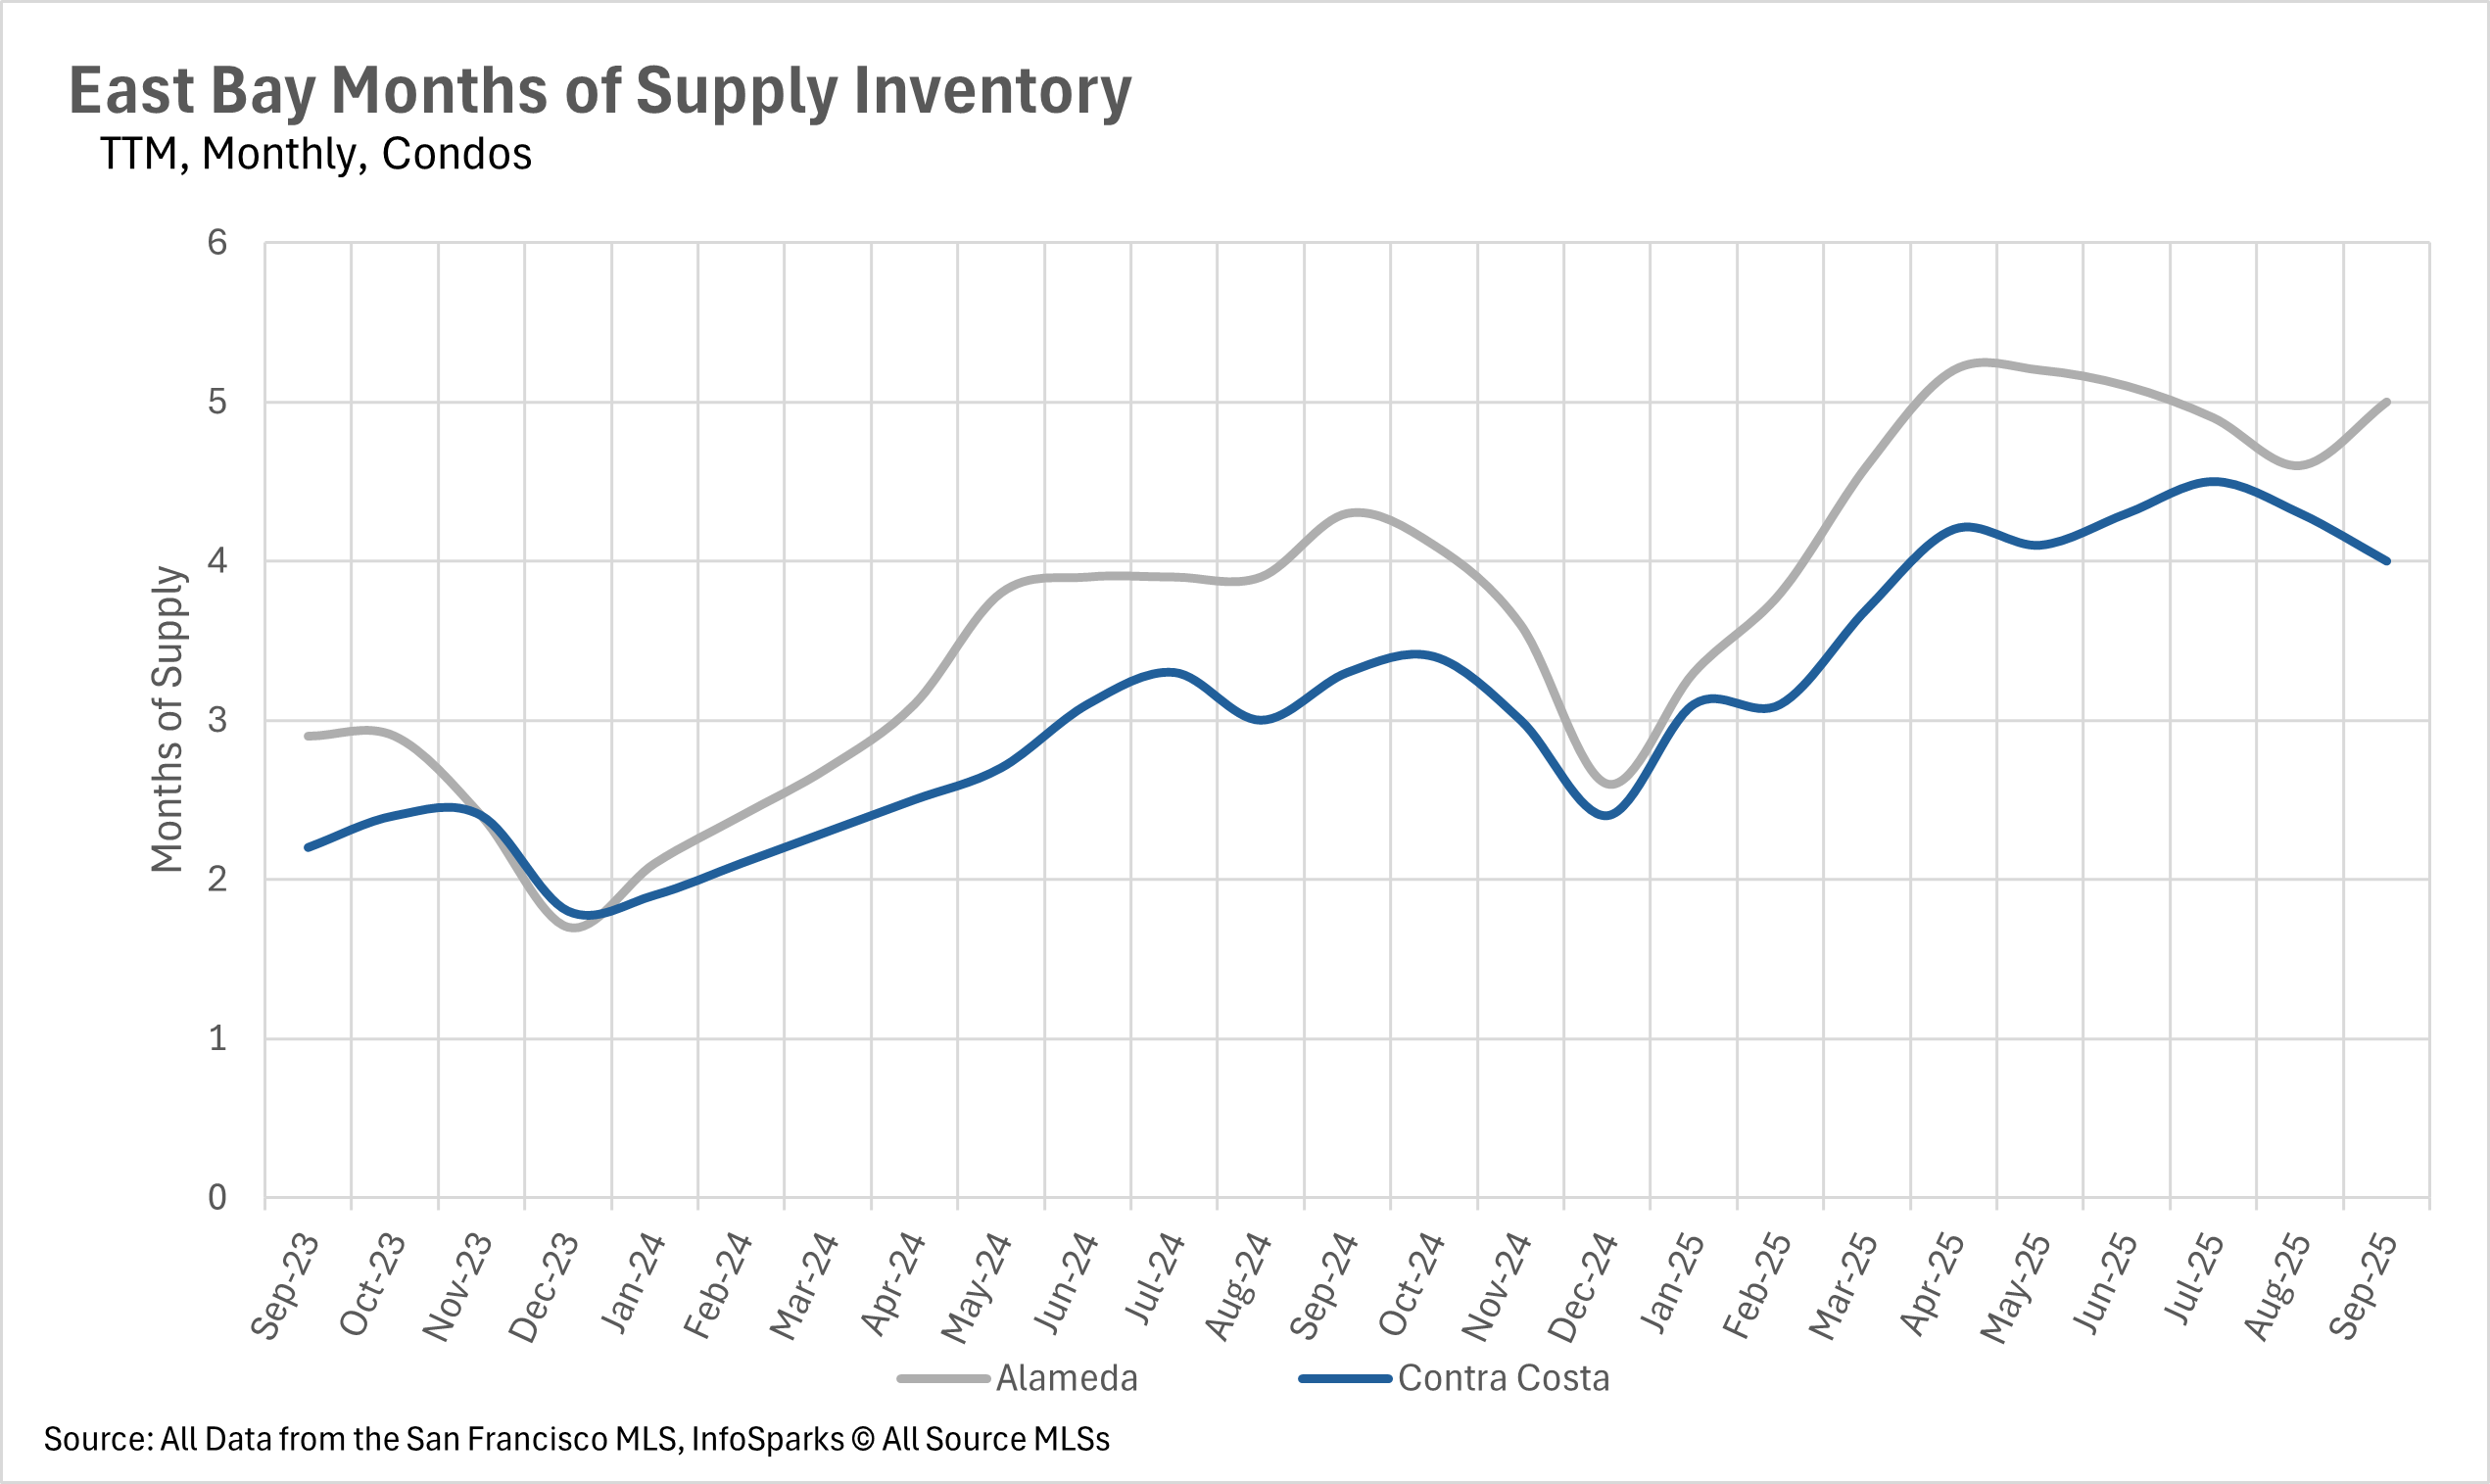
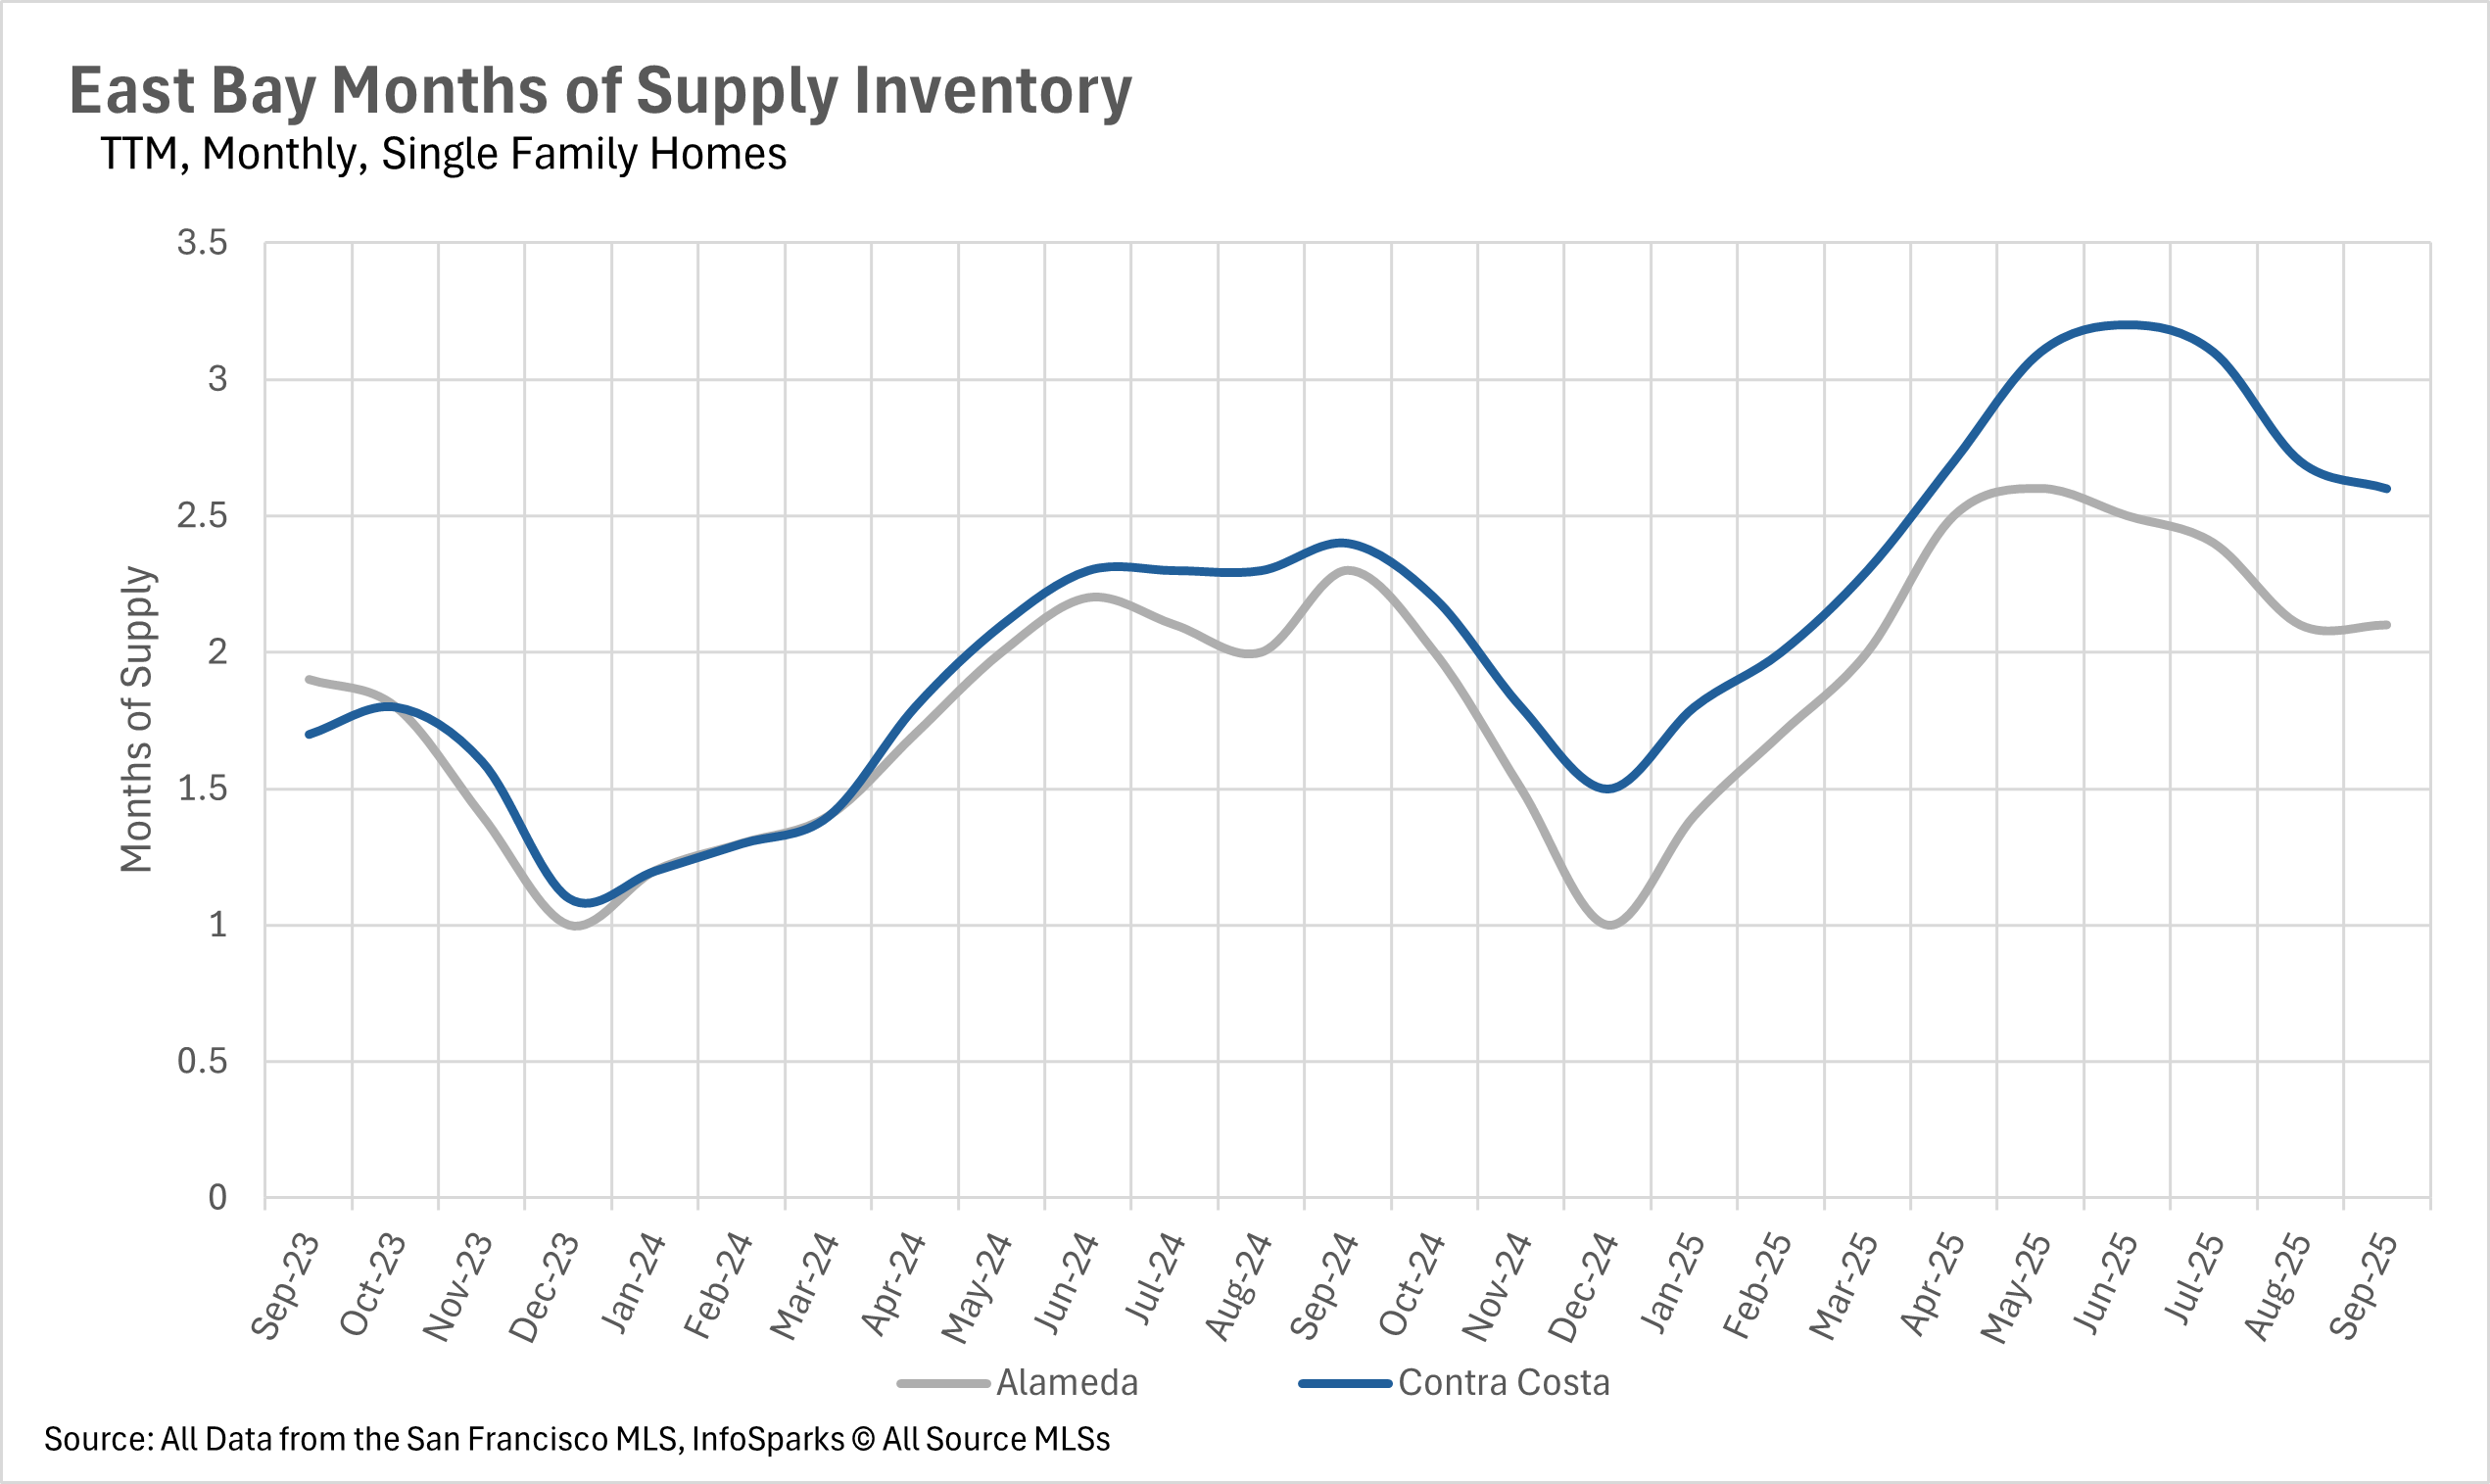
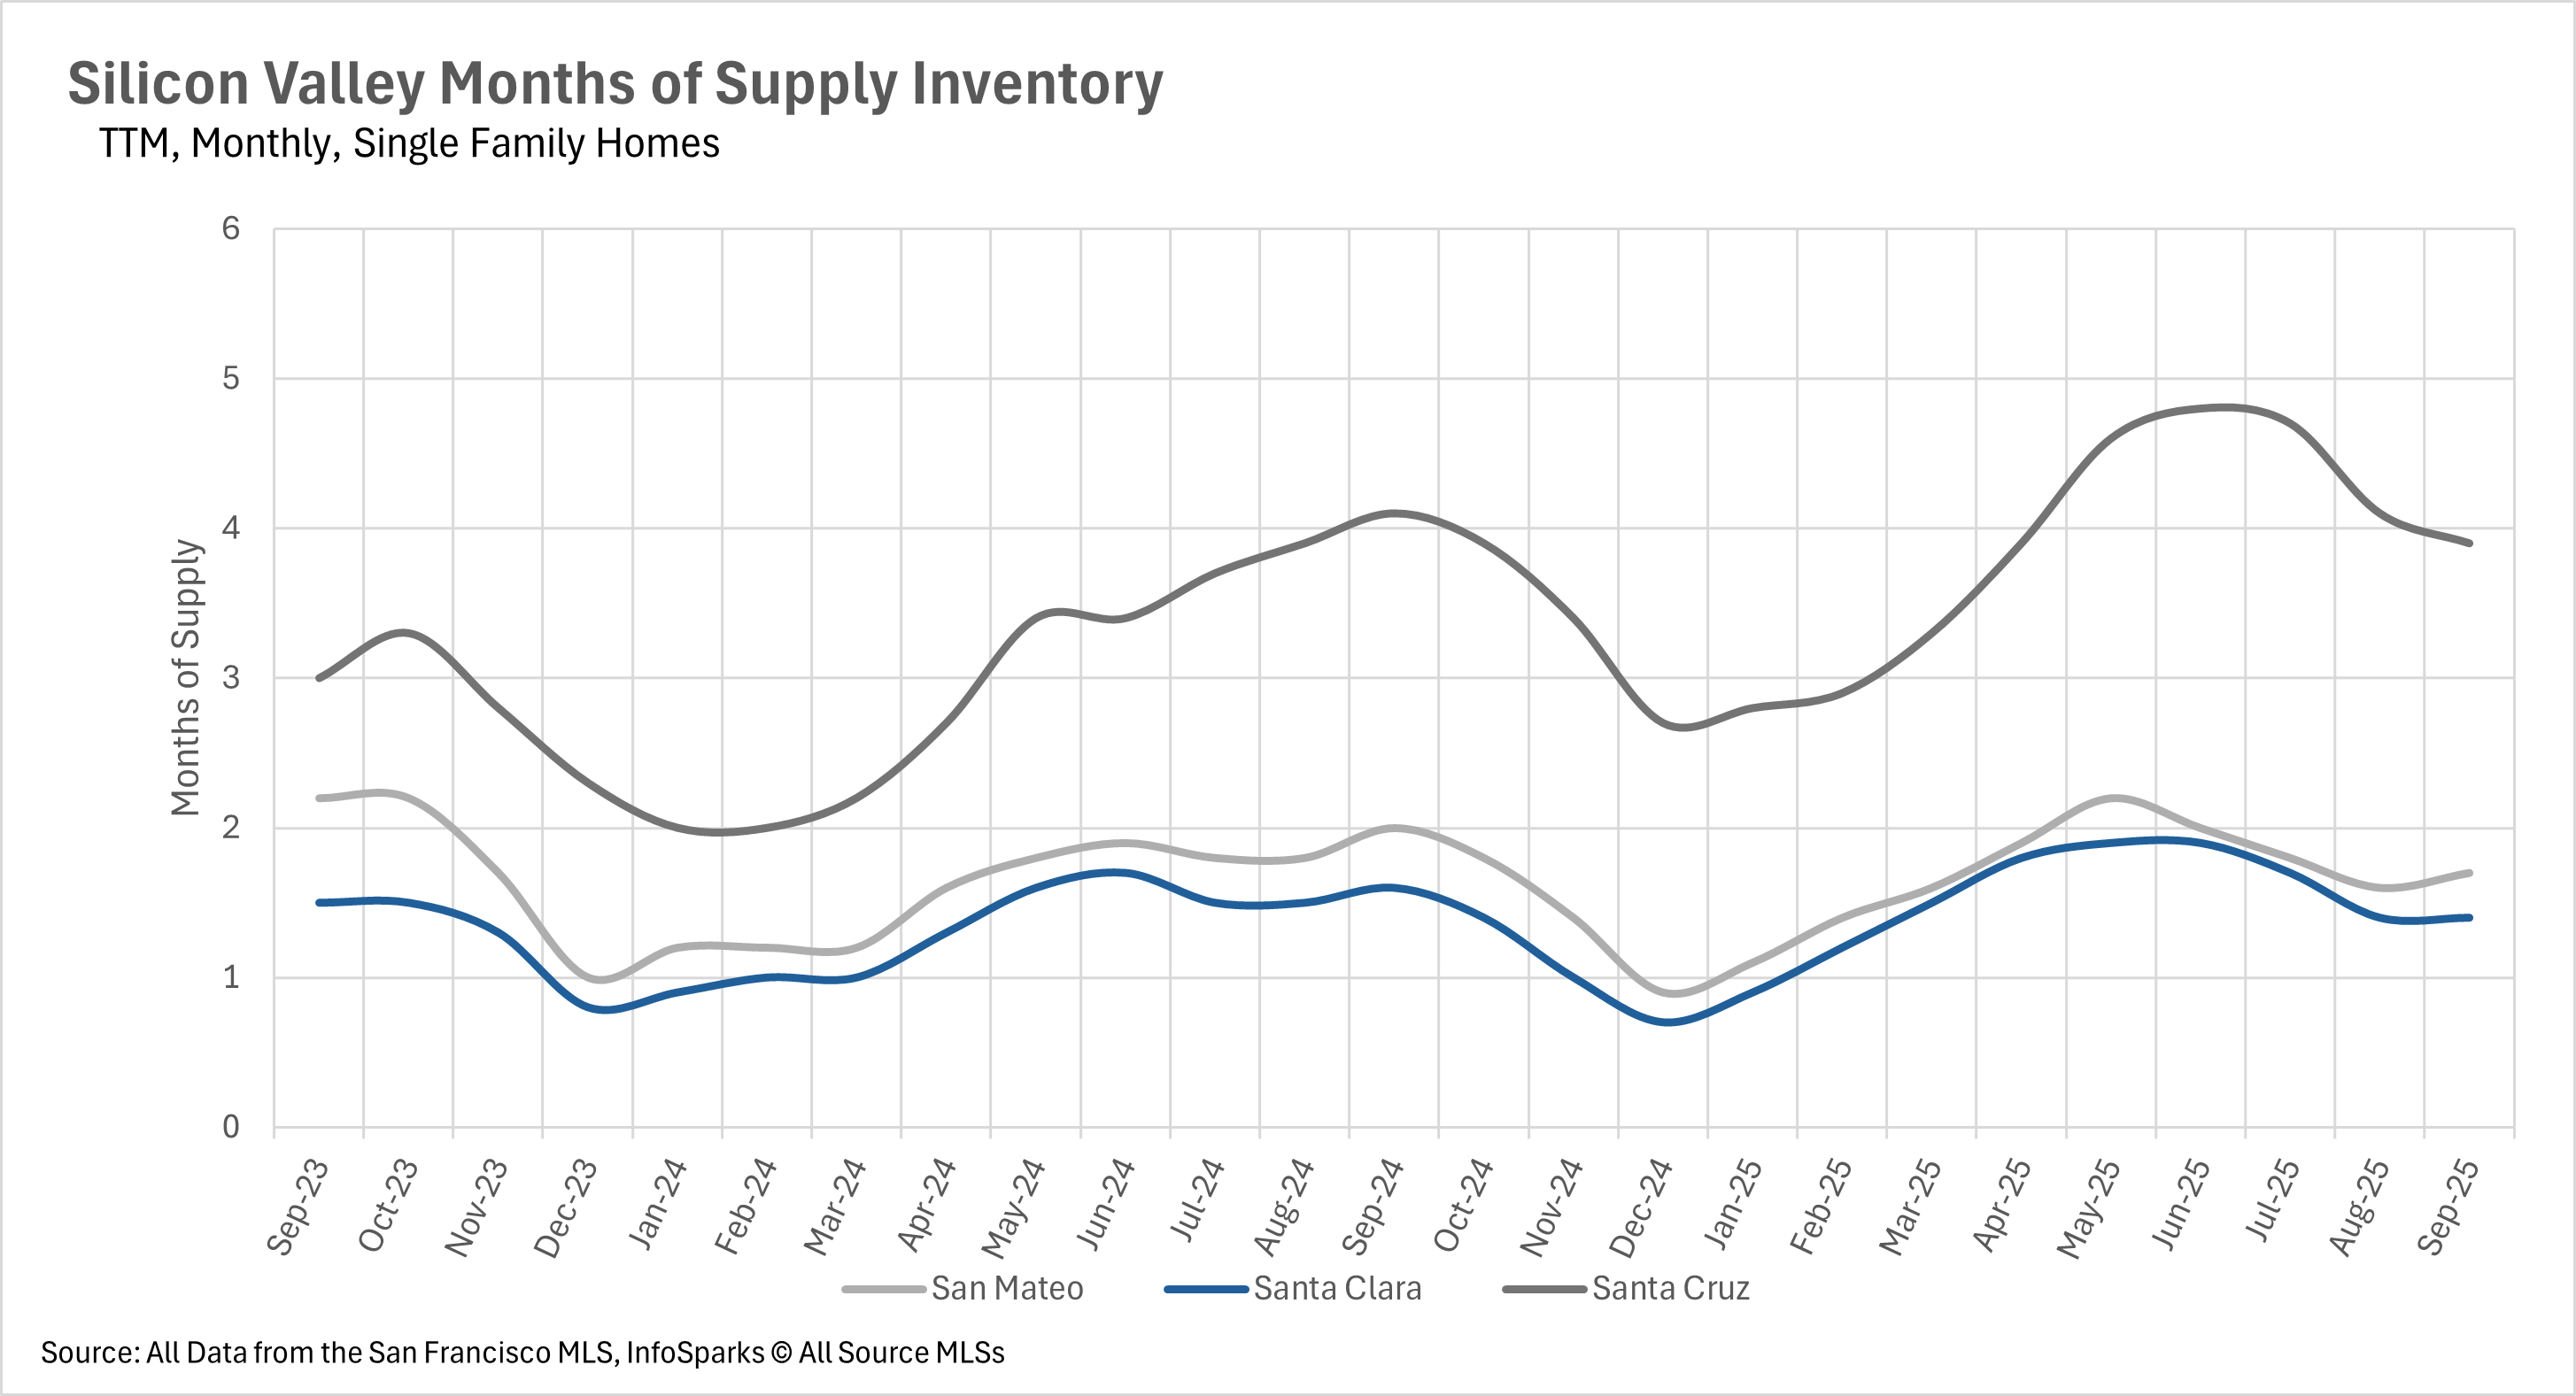
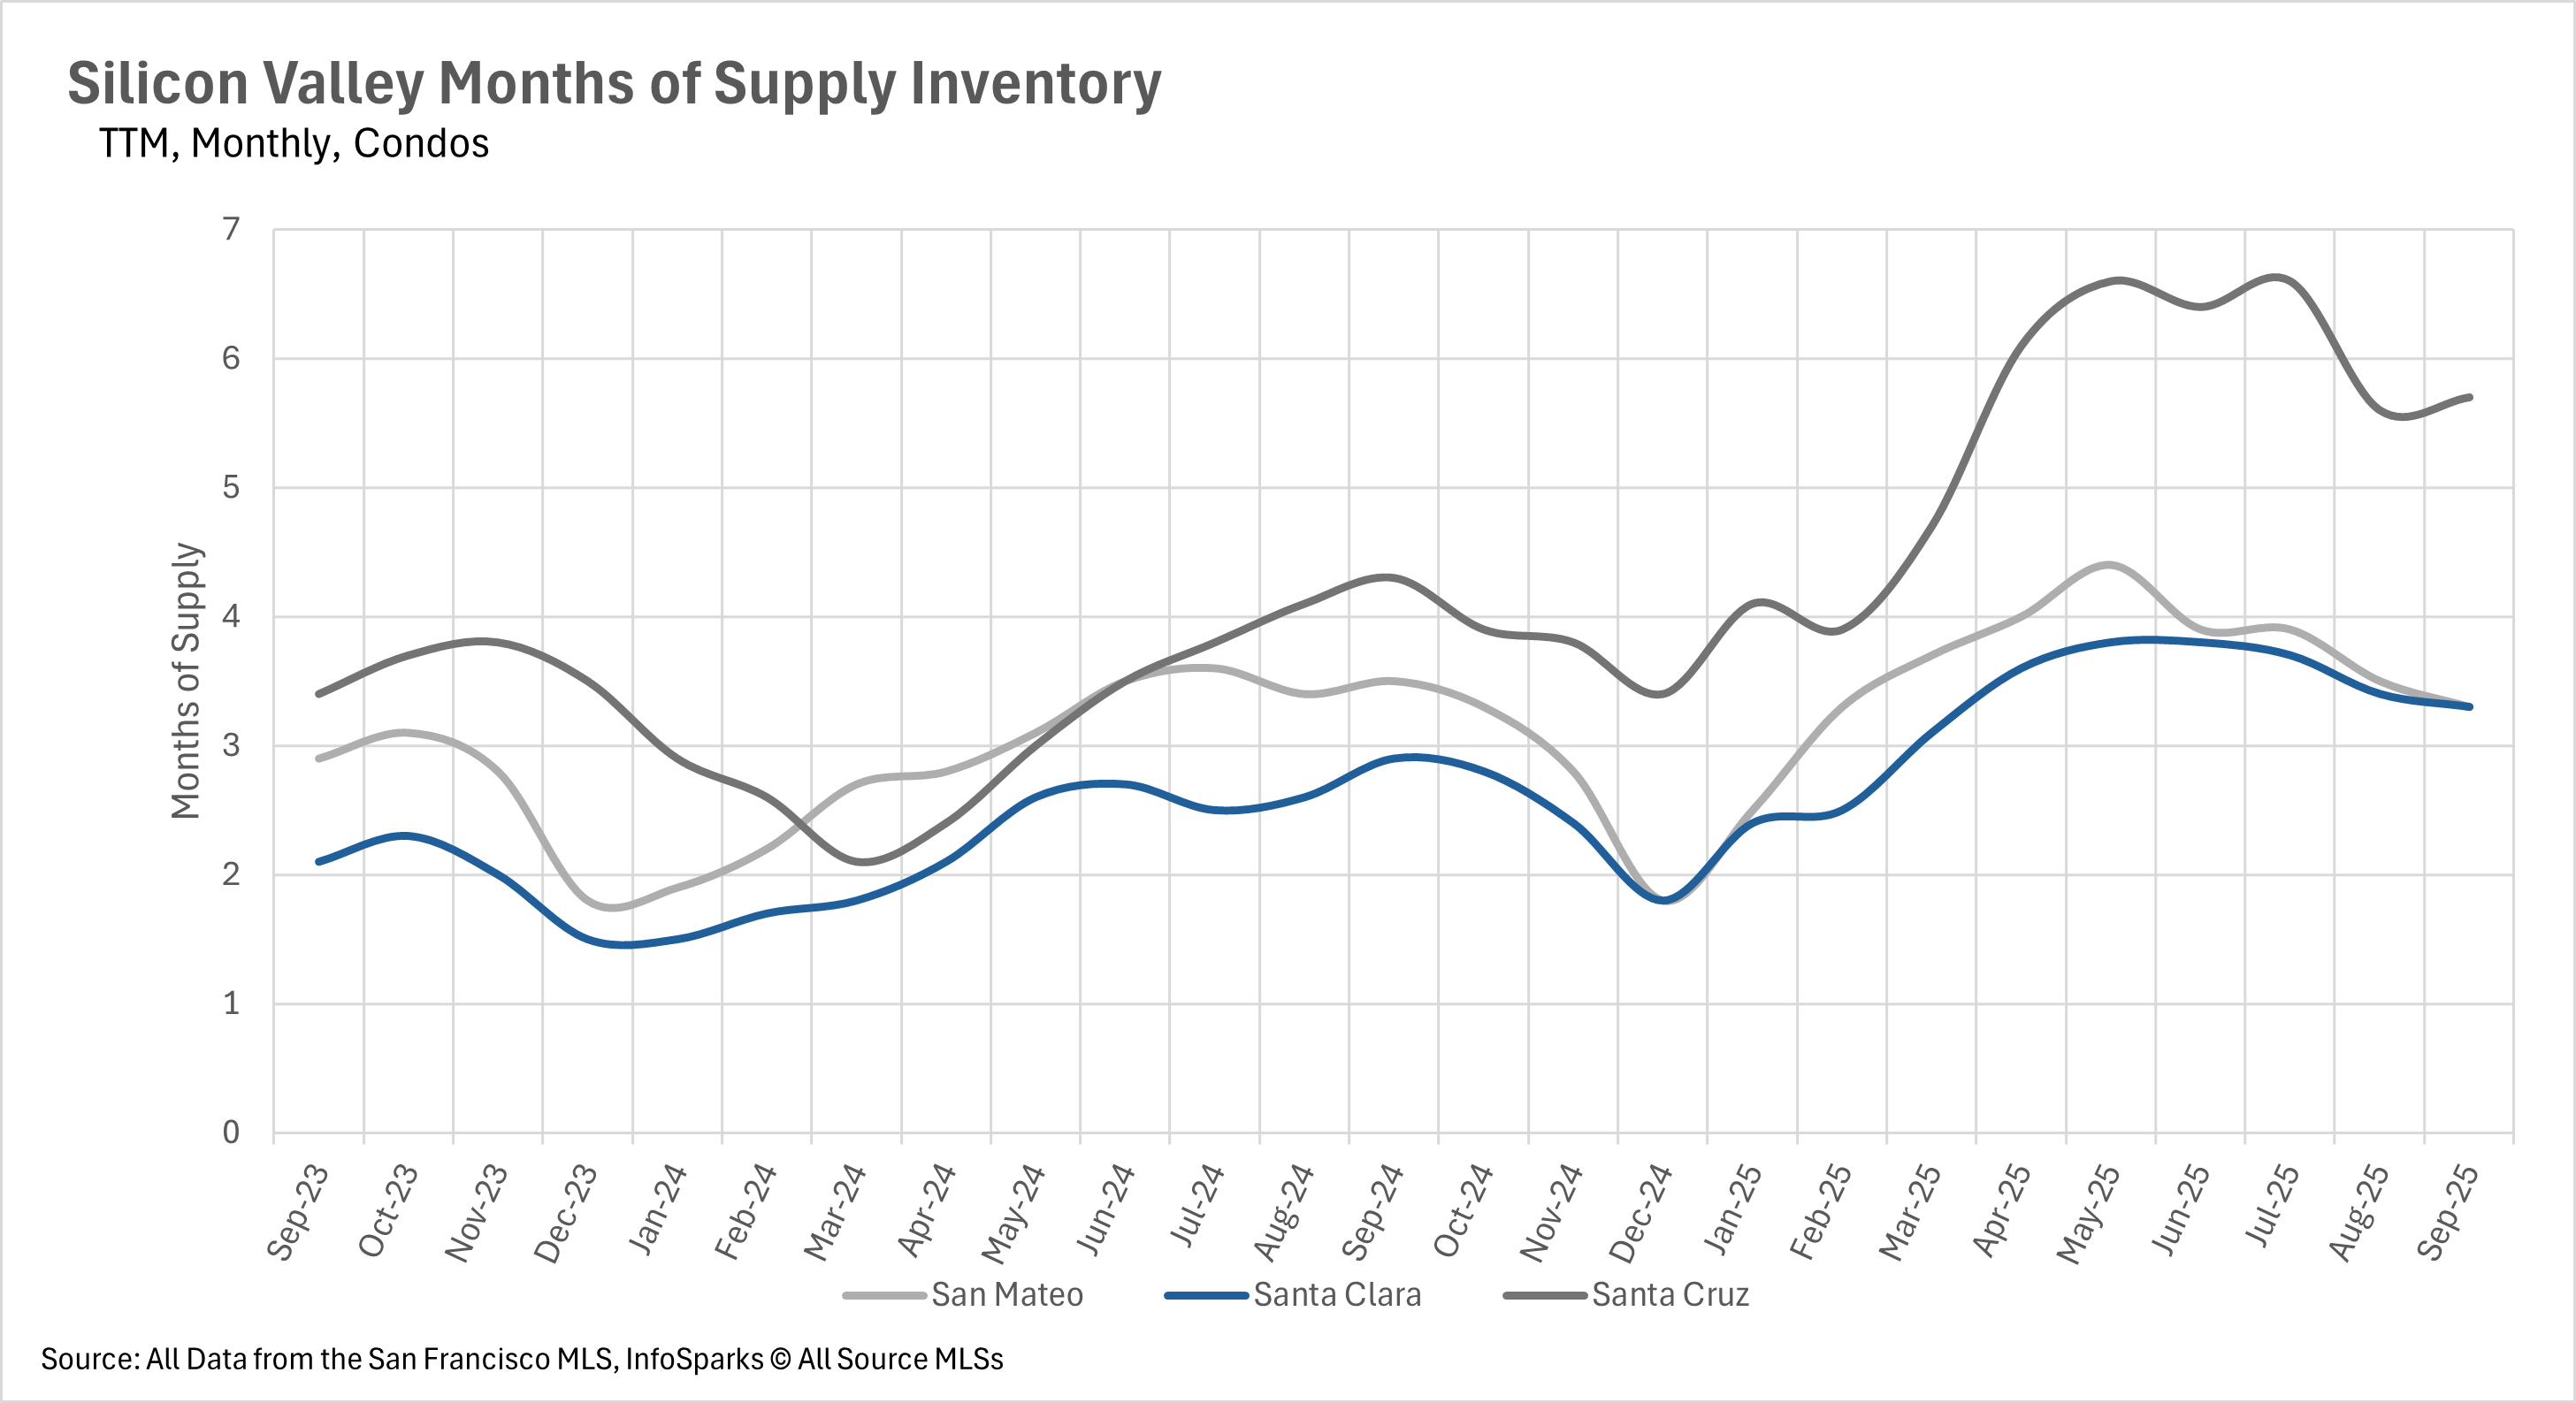
September's inventory normalization accelerated the Bay Area's shift toward seller's markets, with some regions reaching unprecedented levels of seller advantage. San Francisco's single-family market remained firmly in seller's territory at 1.5 months of supply, while the condo market approached seller's status at just 3.2 months - the closest it's been in recent memory. Silicon Valley maintained its ultra-competitive single-family stance with San Mateo at 1.7 months and Santa Clara at an extremely low 1.4 months, while Santa Cruz remained a buyer's market at 3.9 months. All Silicon Valley condo markets favor buyers with 3.3 months in San Mateo and Santa Clara, and 5.7 months in Santa Cruz. The East Bay preserved its traditional split with single-family homes favoring sellers at 2.1 months in Alameda and 2.6 months in Contra Costa, while condos remained buyer-friendly at 5.0 and 4.0 months, respectively.
 
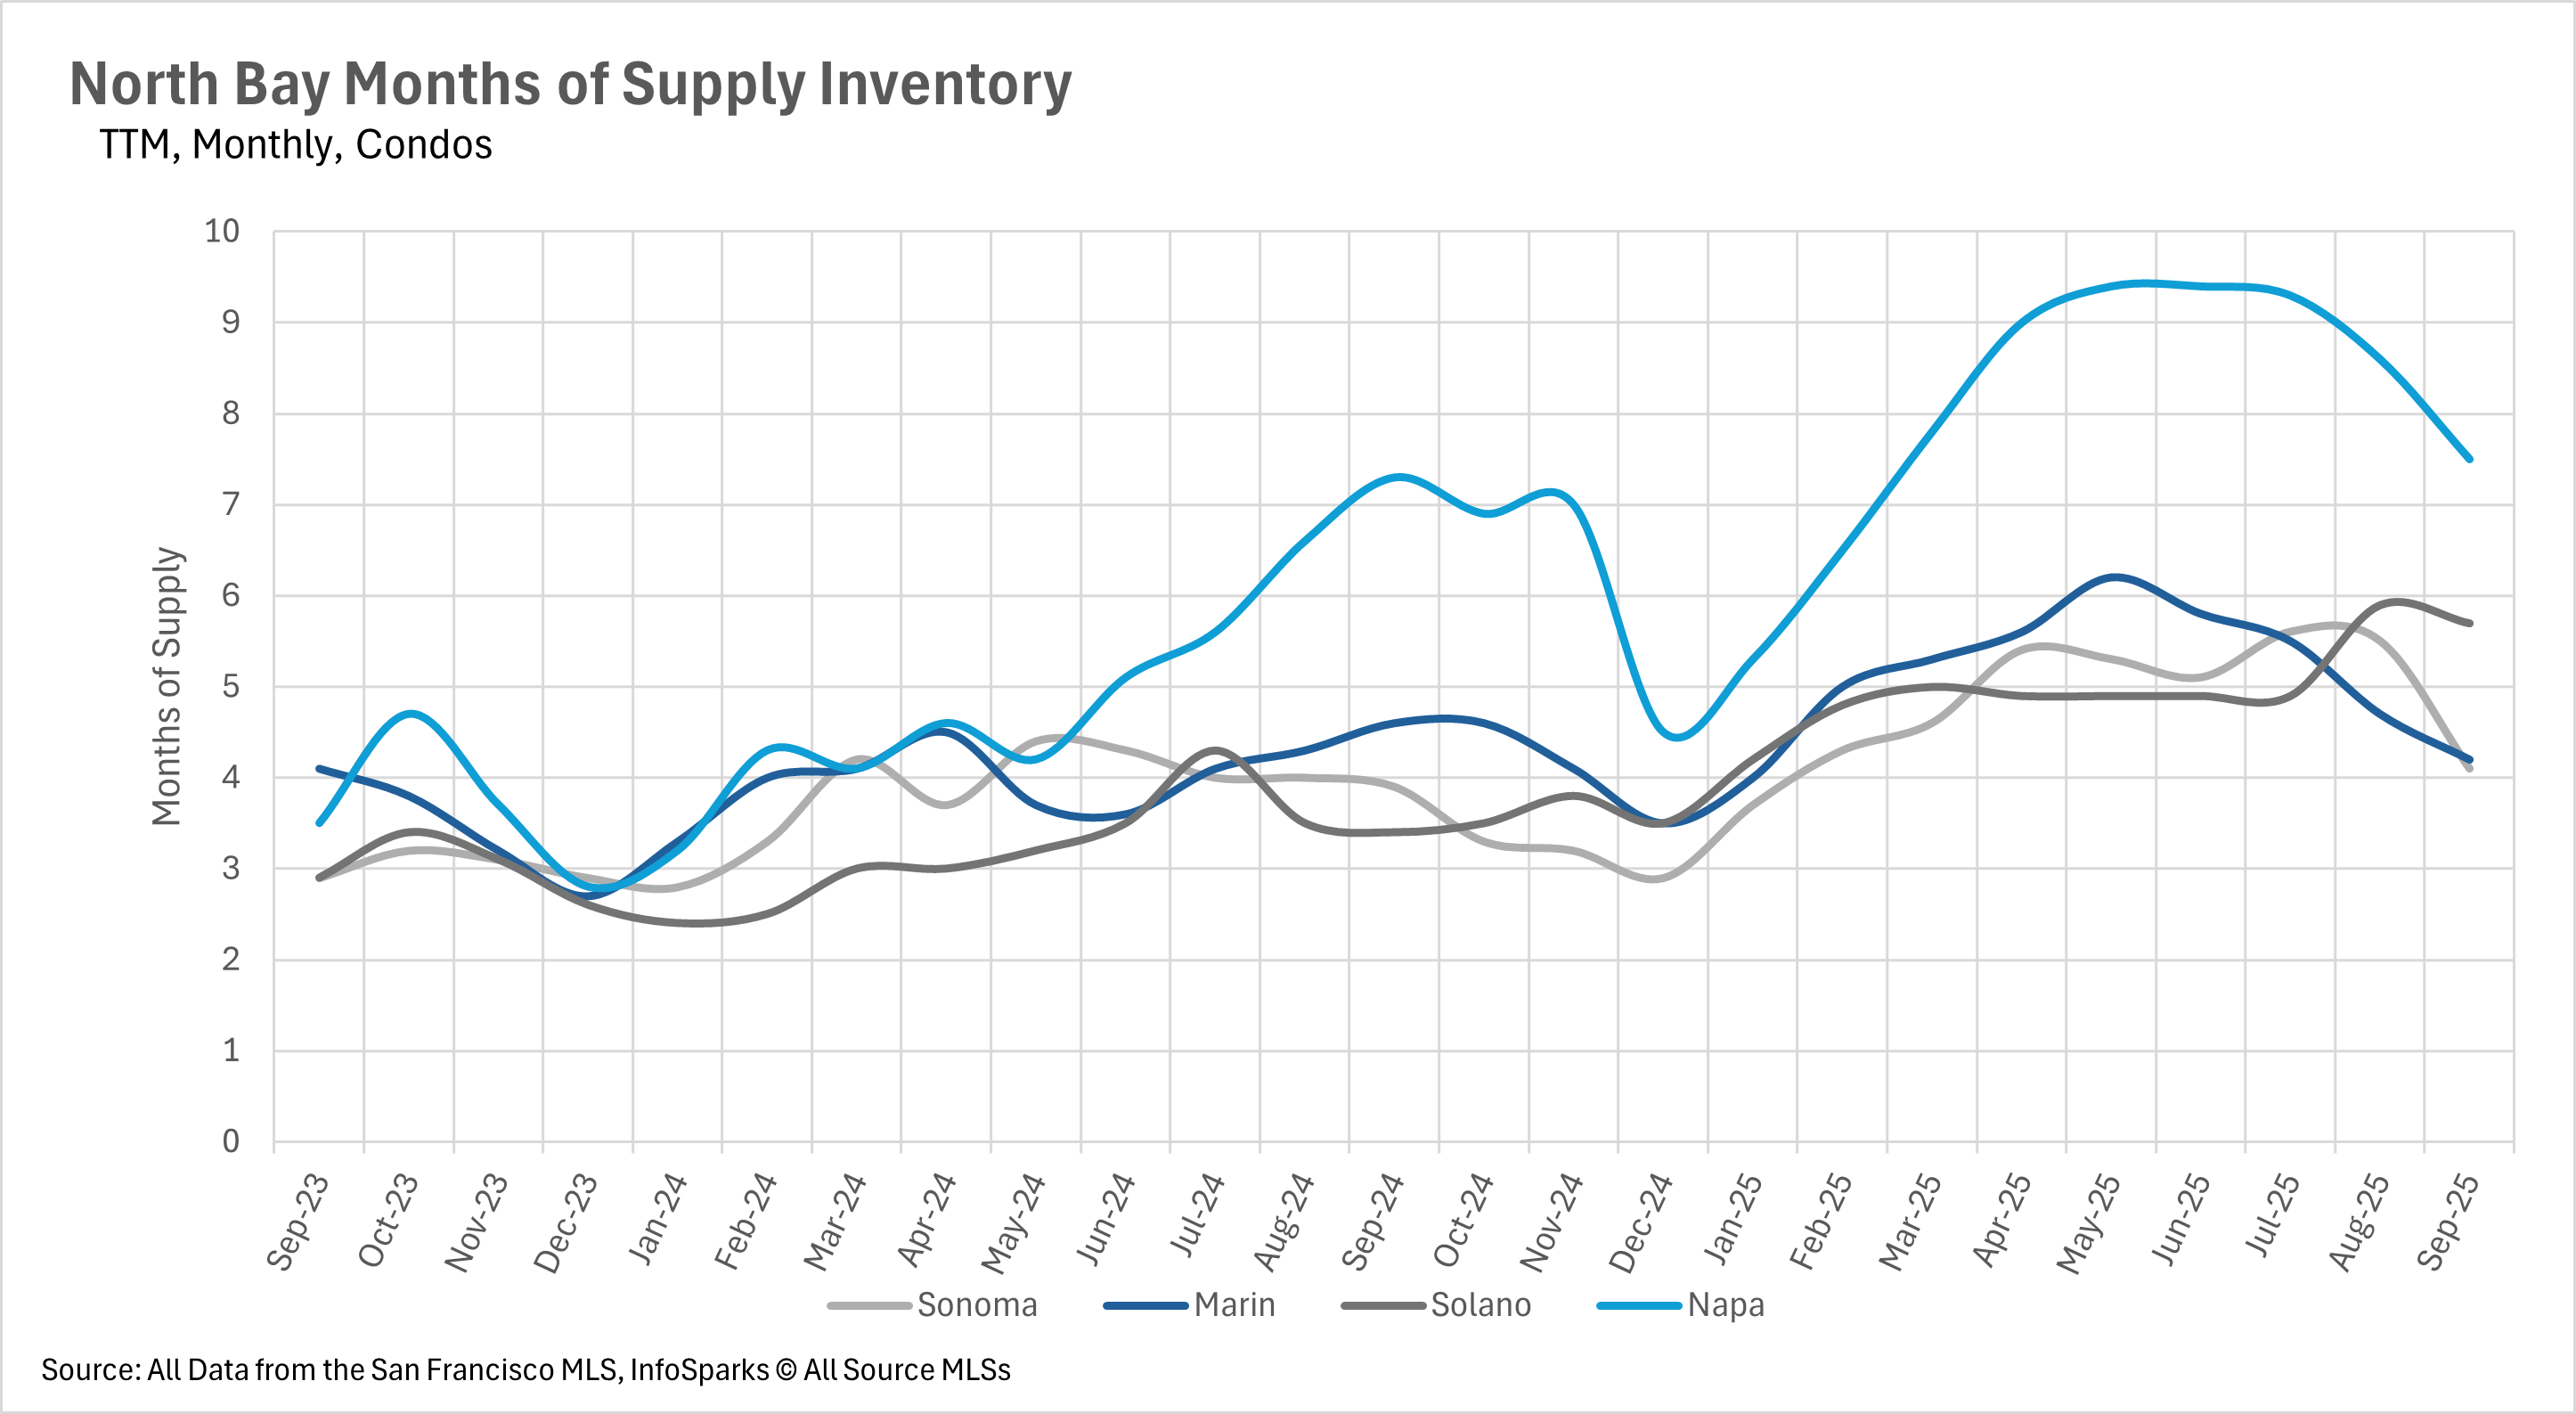
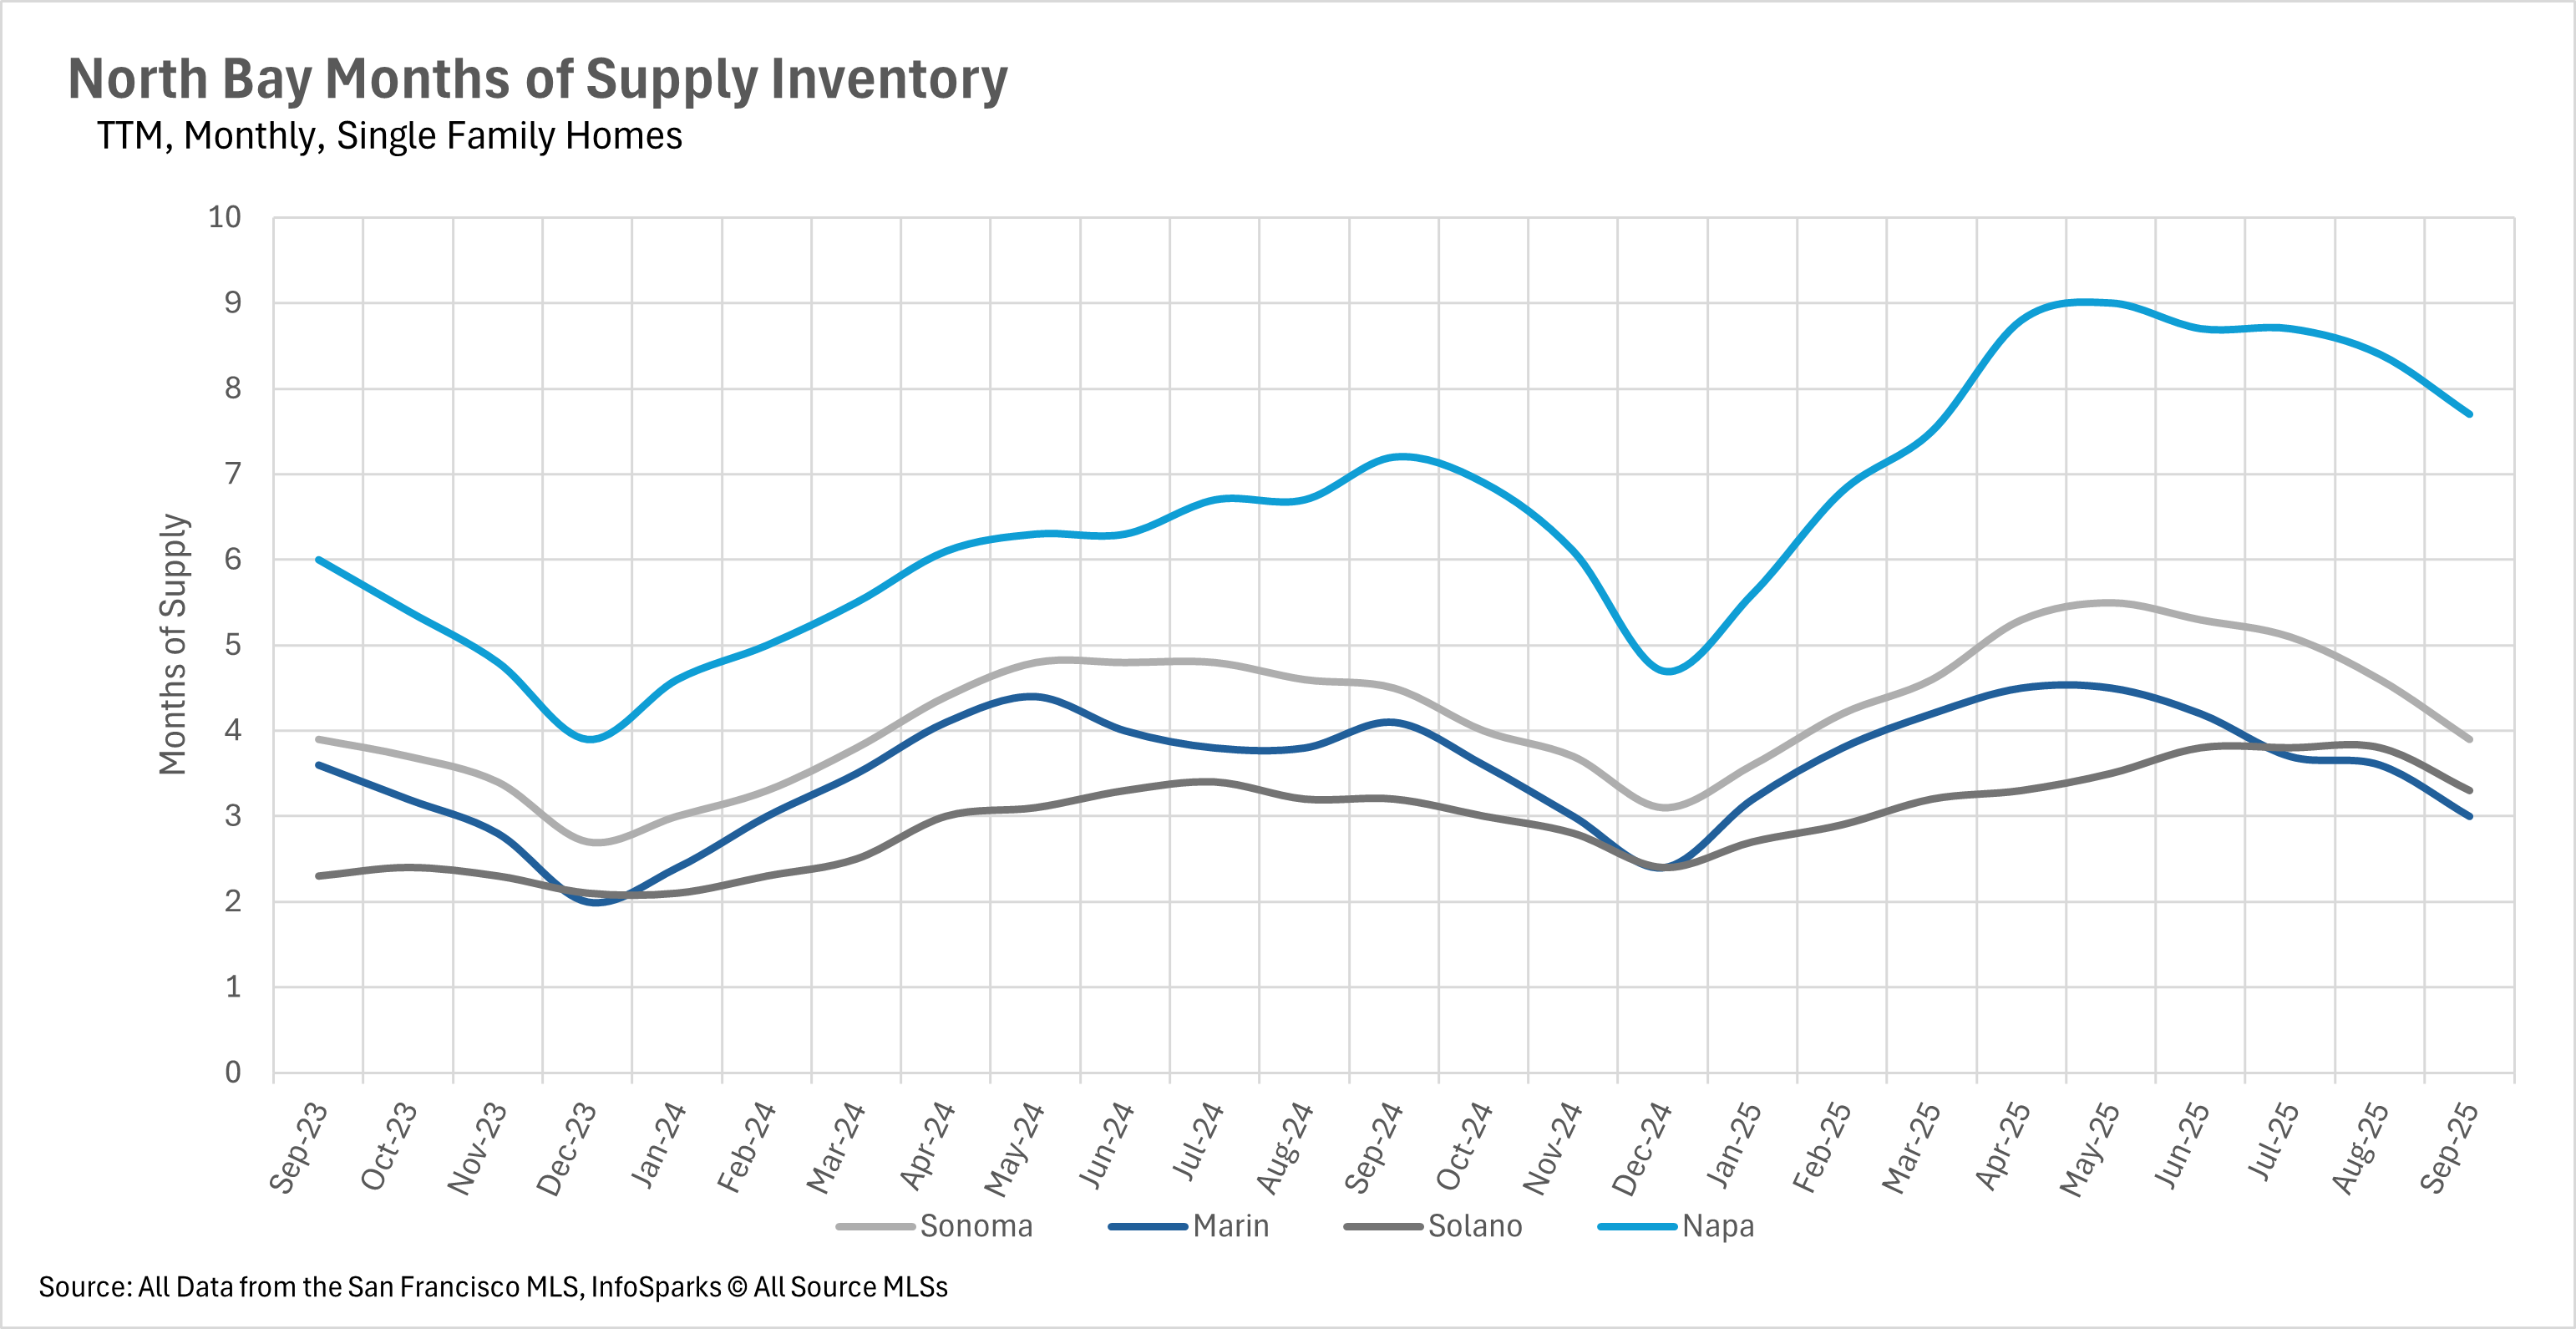
The North Bay showed the clearest shift toward balanced and seller's markets, with Marin County achieving perfect balance at exactly 3.0 months for single-family homes, while Sonoma (3.9 months), Solano (3.3 months), and Napa (7.7 months) continue trending toward balance from buyer's market territory. North Bay condos remain entirely in buyer's market territory but are slowly drifting toward balance, with supply ranging from 4.1 months in Sonoma to 7.5 months in Napa County. This region-wide pattern suggests that as the traditional fall season approaches, seller leverage is strengthening across most Bay Area markets.
Local Lowdown Data
Chart comparing monthly days on market for San Francisco condos and single-family homes, September 2023–September 2025.
Chart of San Francisco condo listings, sales, and inventory from September 2023 to September 2025.
Chart of monthly San Francisco single-family home new listings, sold listings, and homes for sale, September 2023–September 2025.
San Francisco chart: single-family and condo prices as percentages of original price, Sep 2022–Sep 2025.
San Francisco year-over-year median price changes for single-family homes and condos, October 2024–September 2025.
San Francisco housing supply chart comparing monthly condo and single-family home inventory from September 2023 to September 2025.
Chart of San Francisco monthly median prices, September 2022–September 2025, comparing single-family homes and condos.
Line chart of monthly North Bay condo days on market by county, September 2023 to September 2025.
Chart of North Bay condo inventory, showing monthly new and sold listings and homes for sale from September 2023 to September 2025.
Line chart comparing monthly days on market for single-family homes in Sonoma, Marin, Solano, and Napa, September 2023–September 2025.
Bar chart of North Bay condo price changes by county, October 2024–September 2025, with a sharp Napa spike in February.
North Bay single-family home inventory chart, with monthly new listings, sold listings, and homes for sale from September 2023 to September 2025.
Bar chart of North Bay single-family home price changes by county, October 2024–September 2025.
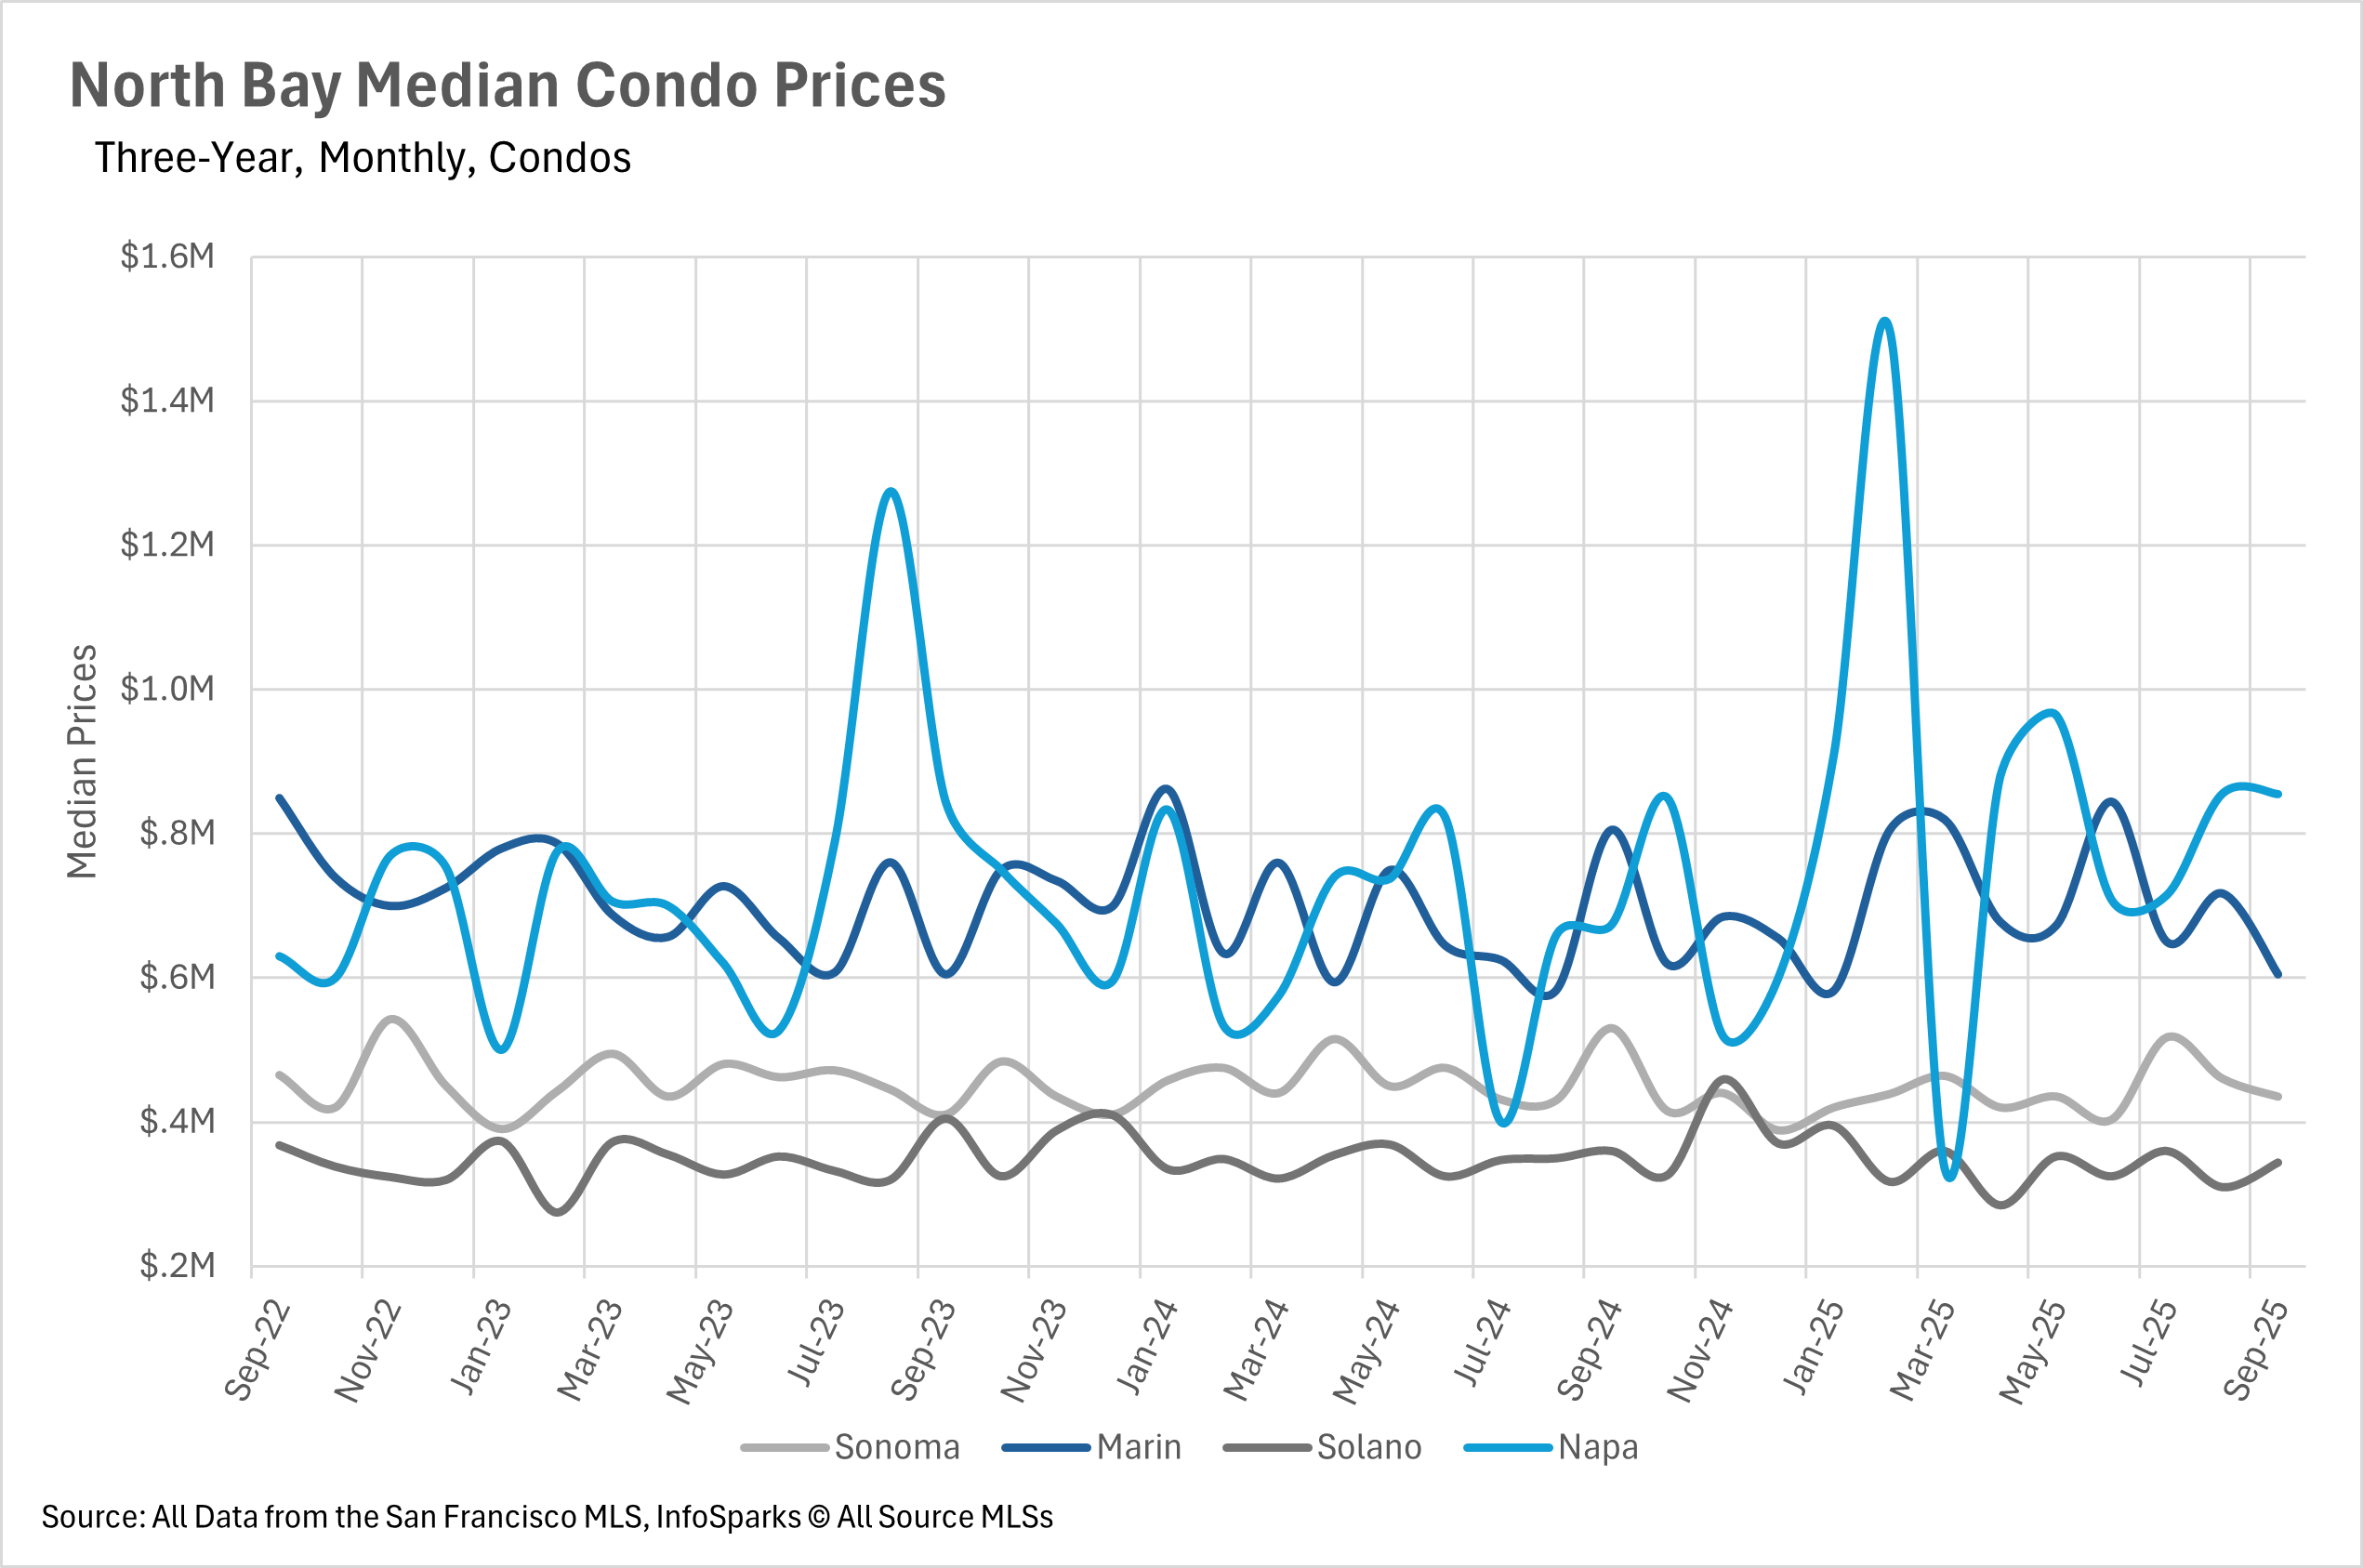
Line chart of North Bay monthly condo prices by county, September 2022–September 2025; Napa shows the sharpest fluctuations.
Line chart of monthly median single-family home prices in Sonoma, Marin, Solano, and Napa counties, 2022–2025.
Line chart comparing monthly condo inventory supply across Sonoma, Marin, Solano, and Napa counties.
Line chart of North Bay county housing inventory, with Napa highest and peaking near nine months in spring 2025.
Line chart compares monthly condo days on market in Alameda and Contra Costa from September 2023 to September 2025.
East Bay condo inventory chart comparing monthly new listings, sold listings, and listings for sale, September 2023–September 2025.
East Bay year-over-year condo price changes, with Alameda and Contra Costa mostly declining in 2025.
Chart of East Bay days on market, comparing Alameda and Contra Costa single-family homes from September 2023 to September 2025.
Bar chart of year-over-year East Bay single-family home price changes in Alameda and Contra Costa counties, October 2024–September 2025.
East Bay single-family home inventory chart, showing monthly new listings, sales, and homes for sale from September 2023 to September 2025.
Line chart comparing monthly median condo prices in Alameda and Contra Costa from September 2022 to September 2025.
Chart comparing monthly median single-family home prices in Alameda and Contra Costa counties, September 2022–September 2025.
Line chart of monthly condo supply in Alameda and Contra Costa, September 2023–September 2025.
Line chart comparing monthly single-family home inventory supply in Alameda and Contra Costa, September 2023–September 2025.
Line chart comparing monthly days on market for single-family homes in San Mateo, Santa Clara, and Santa Cruz counties.
Chart of Silicon Valley condo listings, sold listings, and inventory from September 2023 to September 2025.
Chart of year-over-year Silicon Valley condo price changes by county, October 2024–September 2025.
Chart of Silicon Valley single-family home listings, sales, and homes for sale from September 2023 to September 2025.
Line chart comparing monthly condo days on market in San Mateo, Santa Clara, and Santa Cruz from September 2023 to September 2025.
Line chart of monthly median condo prices in San Mateo, Santa Clara, and Santa Cruz, September 2022–September 2025.
Bar chart of year-over-year Silicon Valley single-family home median price changes, Oct 2024–Sep 2025.
Line chart comparing monthly median single-family home prices in San Mateo, Santa Clara, and Santa Cruz counties, 2022–2025.
Line chart compares monthly single-family home inventory in San Mateo, Santa Clara, and Santa Cruz from September 2023 to September 2025.
Line chart comparing monthly condo inventory in San Mateo, Santa Clara, and Santa Cruz from September 2023 to September 2025.

ActivePipe Message ID: 3356601

Let’s Talk

You’ve got questions and we can’t wait to answer them.