Inventory breaks out of its summer plateau

North Bay Market Update
Big Story Data

The Local Lowdown
Quick Take:
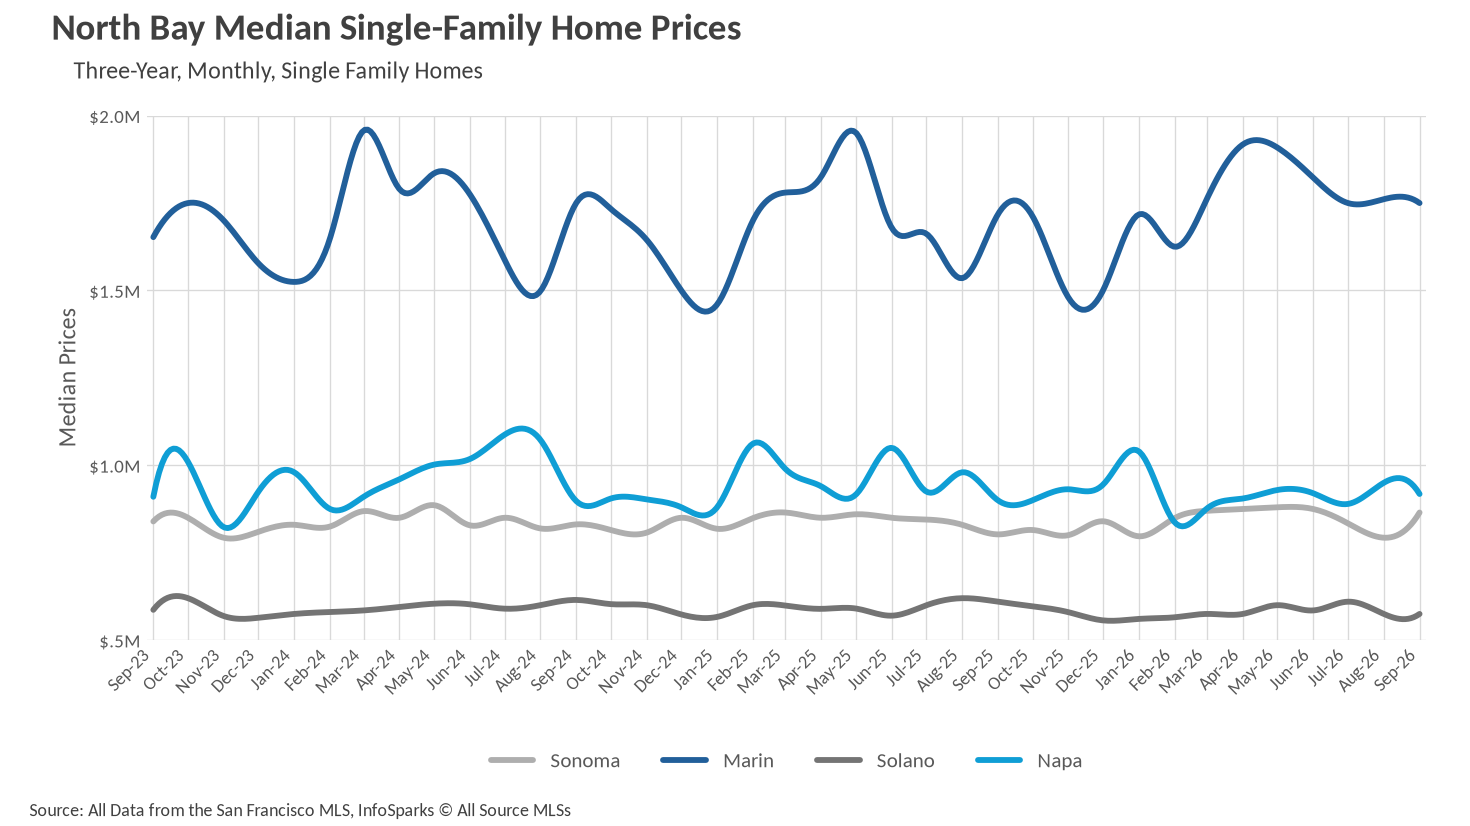
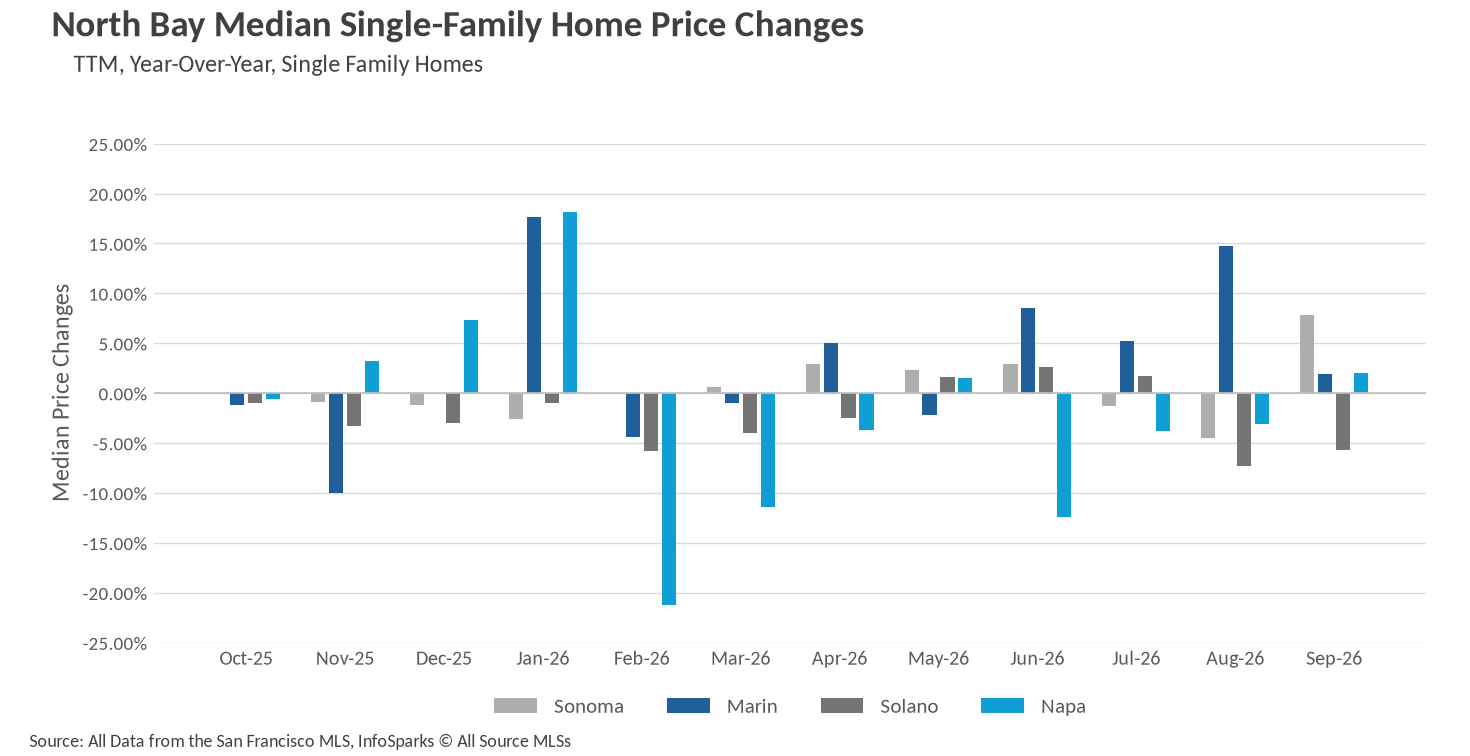
  • Median single-family prices climbed year over year in three of four counties, led by Sonoma County at 7.79% growth, while Solano County slipped 5.74%.
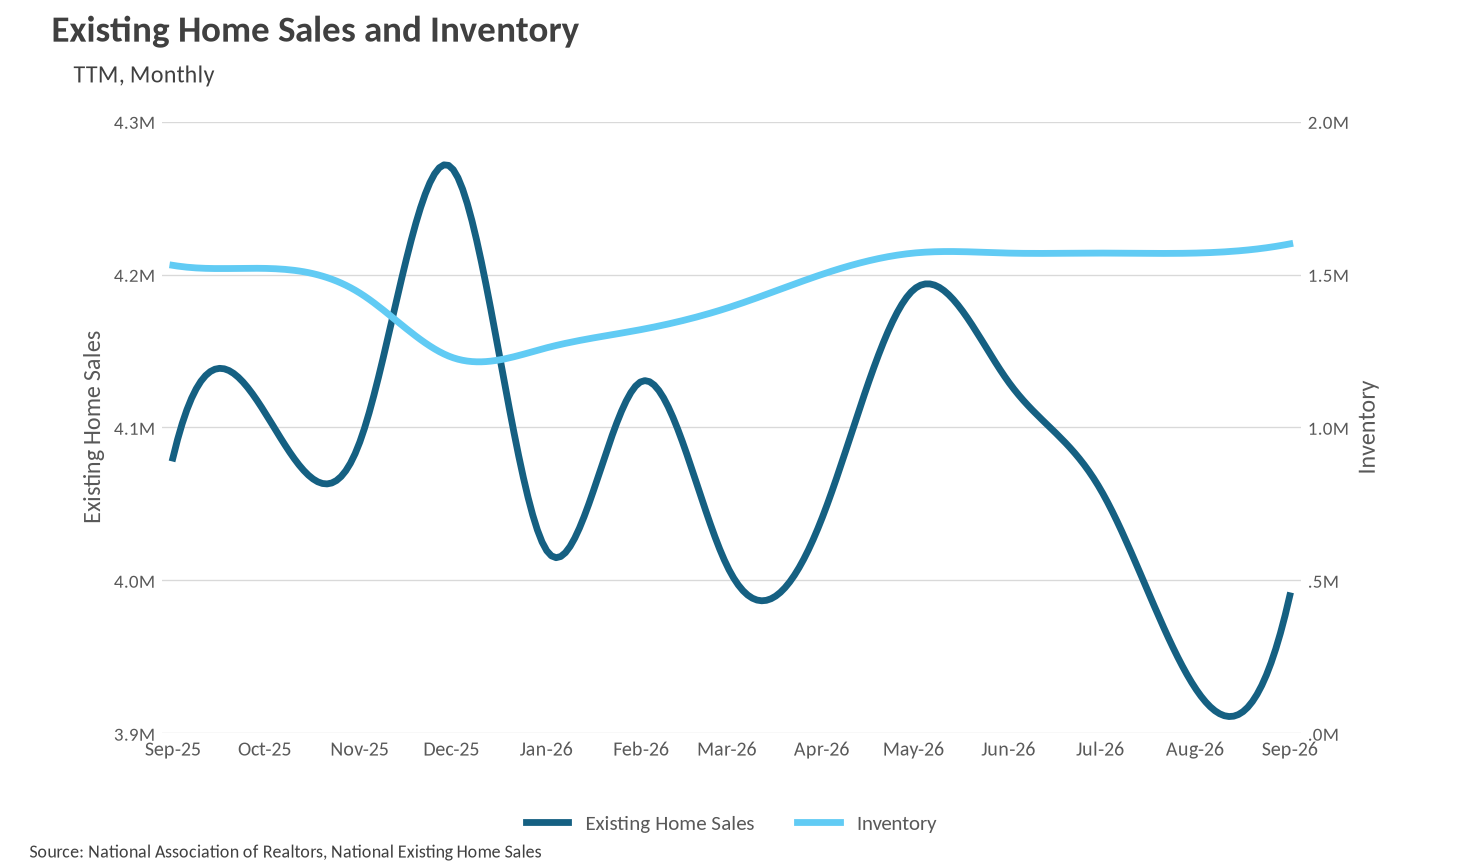
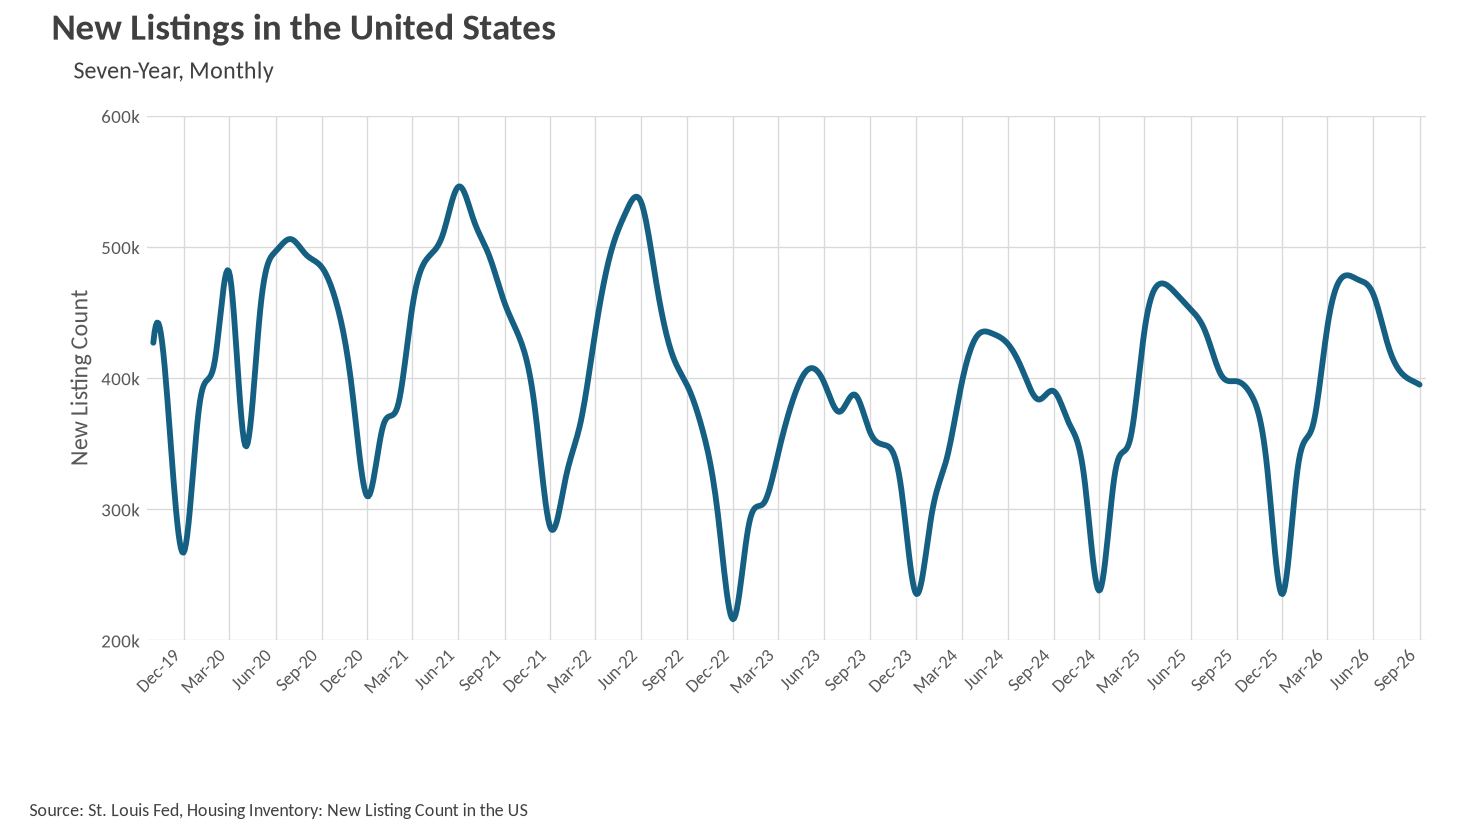
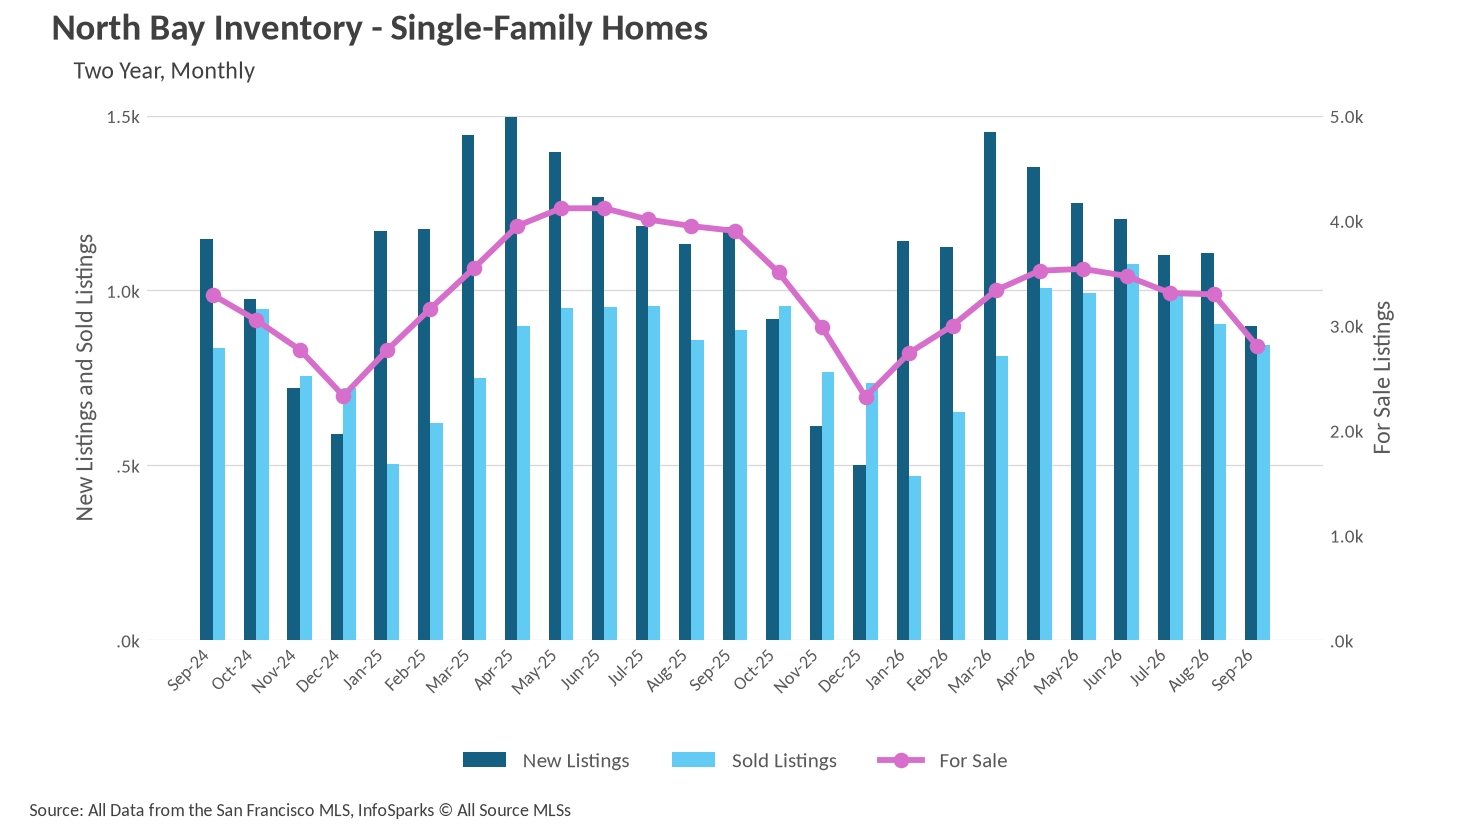
  • Inventory continues to tighten sharply, with single-family listings for sale down 28.15% year over year and new listings off 24.05%.
  • Homes are selling noticeably faster than last September, with Napa County single-family days on market cut nearly in half and Marin County down to just 14 days.
Note: You can find the charts/graphs for the Local Lowdown at the end of this section.

Sonoma takes the lead as fall begins
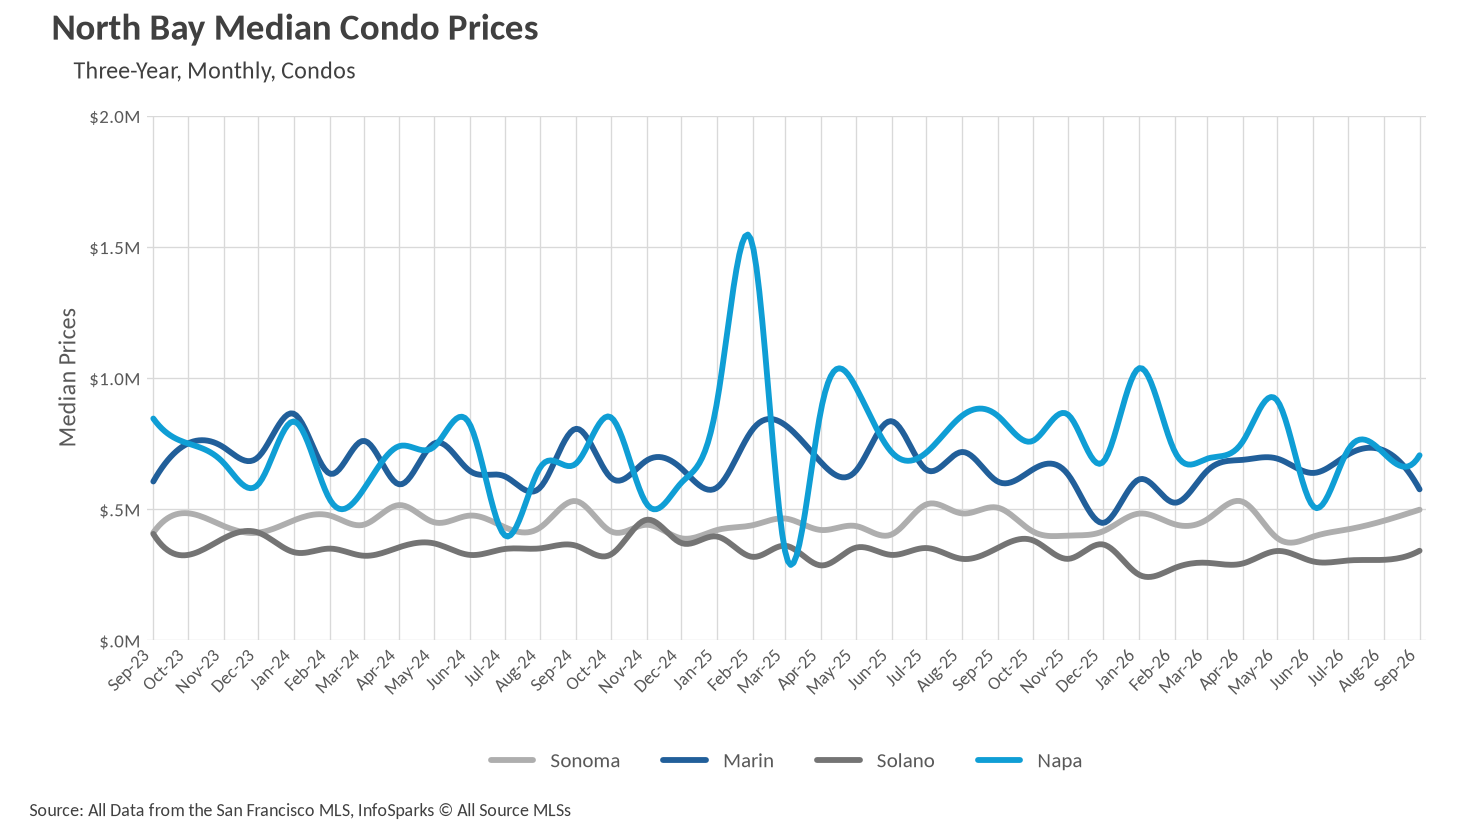
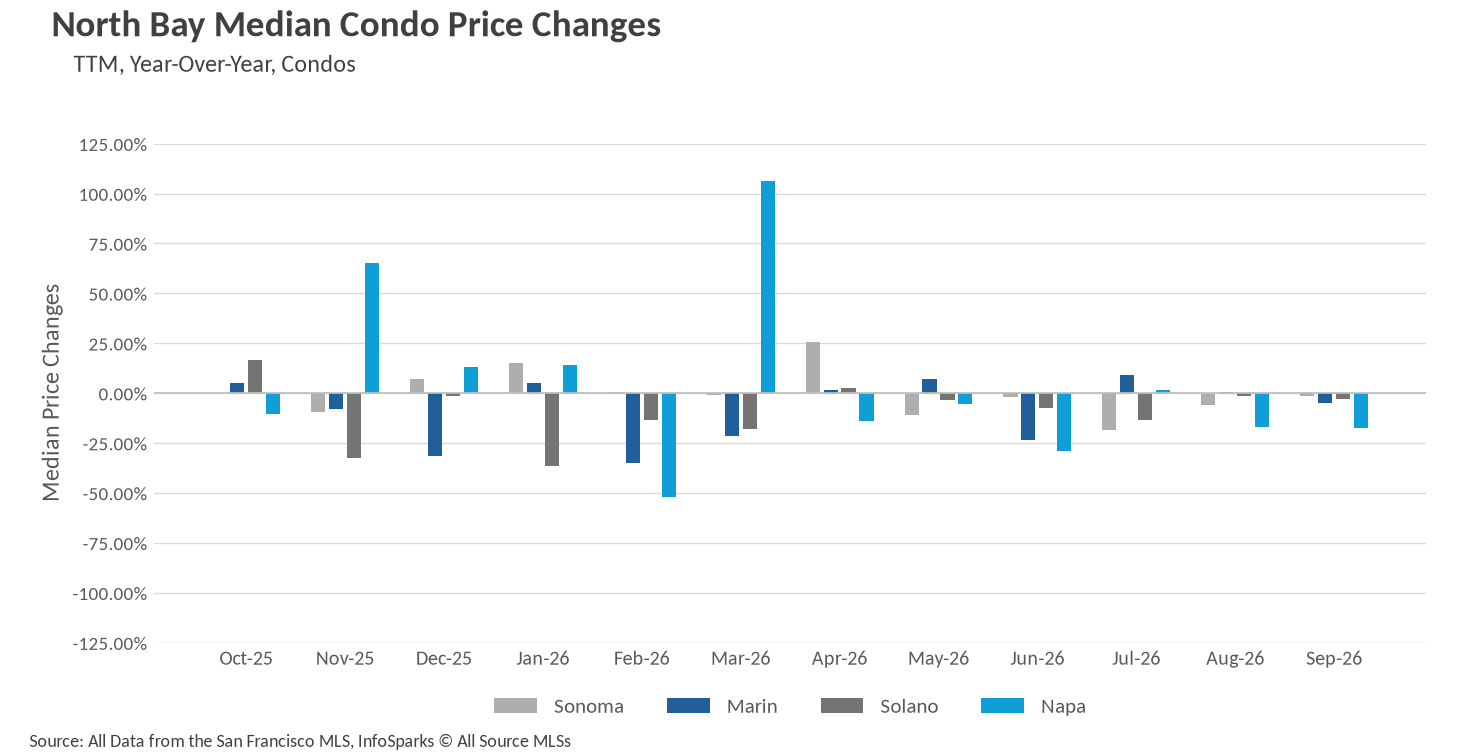
September delivered a solid finish to the summer selling season across most of the North Bay. Sonoma County posted the standout result, with the median single-family home selling for $865,000, a 7.79% gain over September 2025 and a 9.08% jump from August's $793,000. That rebound more than erased the late-summer dip Sonoma experienced in July and August, putting the county back near the $875,000 peak reached in June. Marin County held its ground at a median of $1,750,000, up 1.89% year over year and essentially flat against August, while Napa County came in at $918,000, a 2.00% annual gain even as it gave back some of August's $950,000 reading. Solano County was the lone decliner, with its median single-family home holding at $575,000 for a second straight month, down 5.74% from last September's $610,000. Condos remained the softer side of the market, with all four counties down year over year. Napa County condos fell 17.54% to $705,000, Marin County dropped 4.88% to $575,000, Solano County declined 3.13% to $341,000, and Sonoma County dipped 1.49% to $497,500, though Sonoma's median has now climbed for three consecutive months.


Supply is draining out of the market
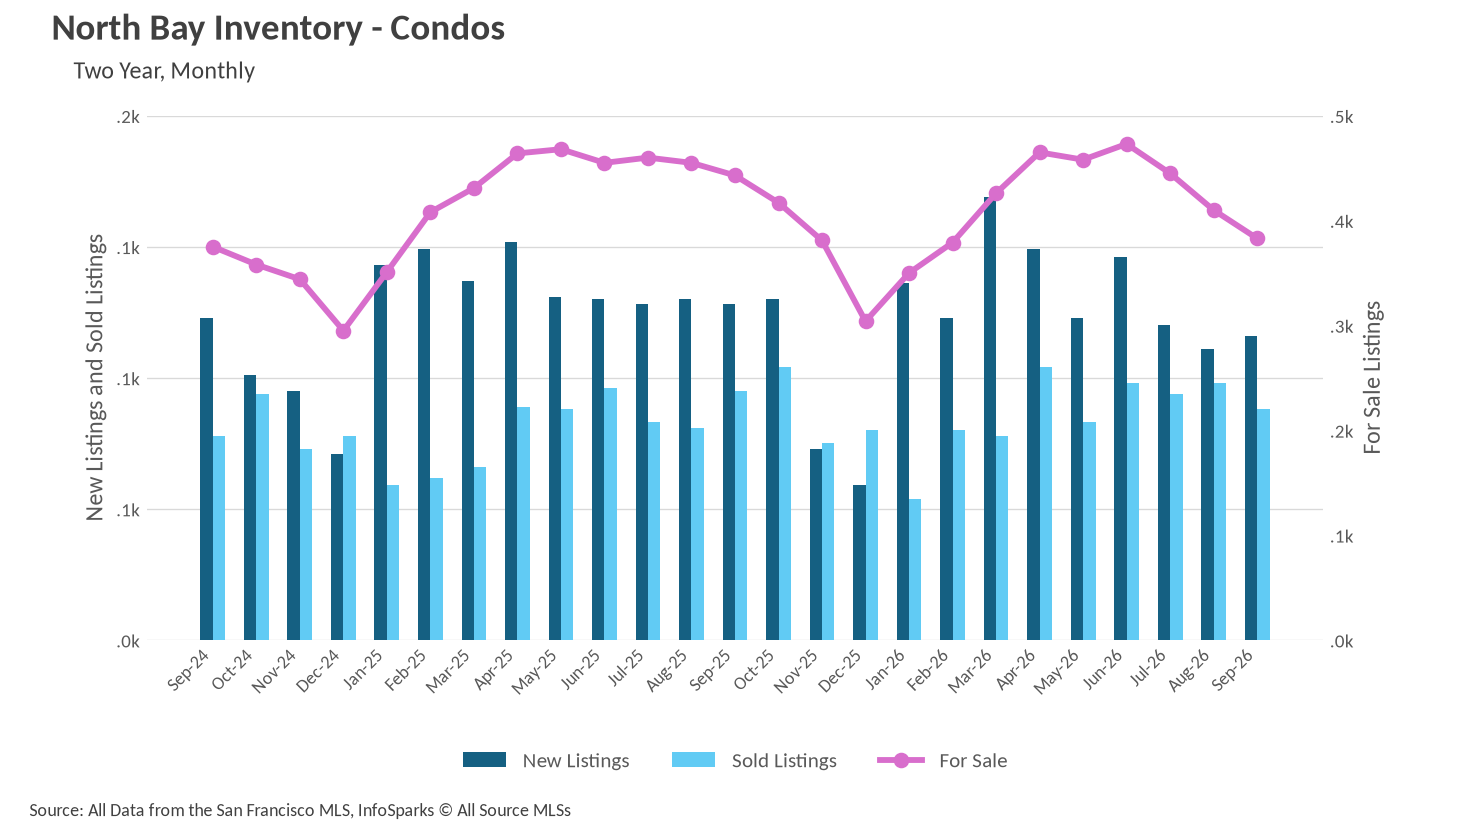
The defining story this fall is how quickly inventory has thinned. Single-family homes for sale across the North Bay fell to 2,803 units in September, a 28.15% drop from the 3,901 available last September and a 14.96% decline from August alone. That is the lowest for-sale count since the winter trough, and it arrives a full month earlier in the seasonal cycle than it did a year ago. New listings tell the same story, with 897 single-family homes coming to market in September, down 24.05% year over year and down from 1,108 in August. Sales held up reasonably well at 843 closings, off just 4.96% from last September, which means buyers absorbed a larger share of a much smaller pool. The condo picture mirrors the trend on a smaller scale, with 383 units for sale, down 13.54% year over year, and 116 new listings, a 9.38% annual decline. Condo sales totaled 88, down 7.37% from last September. With sellers continuing to sit on the sidelines, the supply crunch looks likely to carry into the winter months.

Listings are moving at a brisk clip
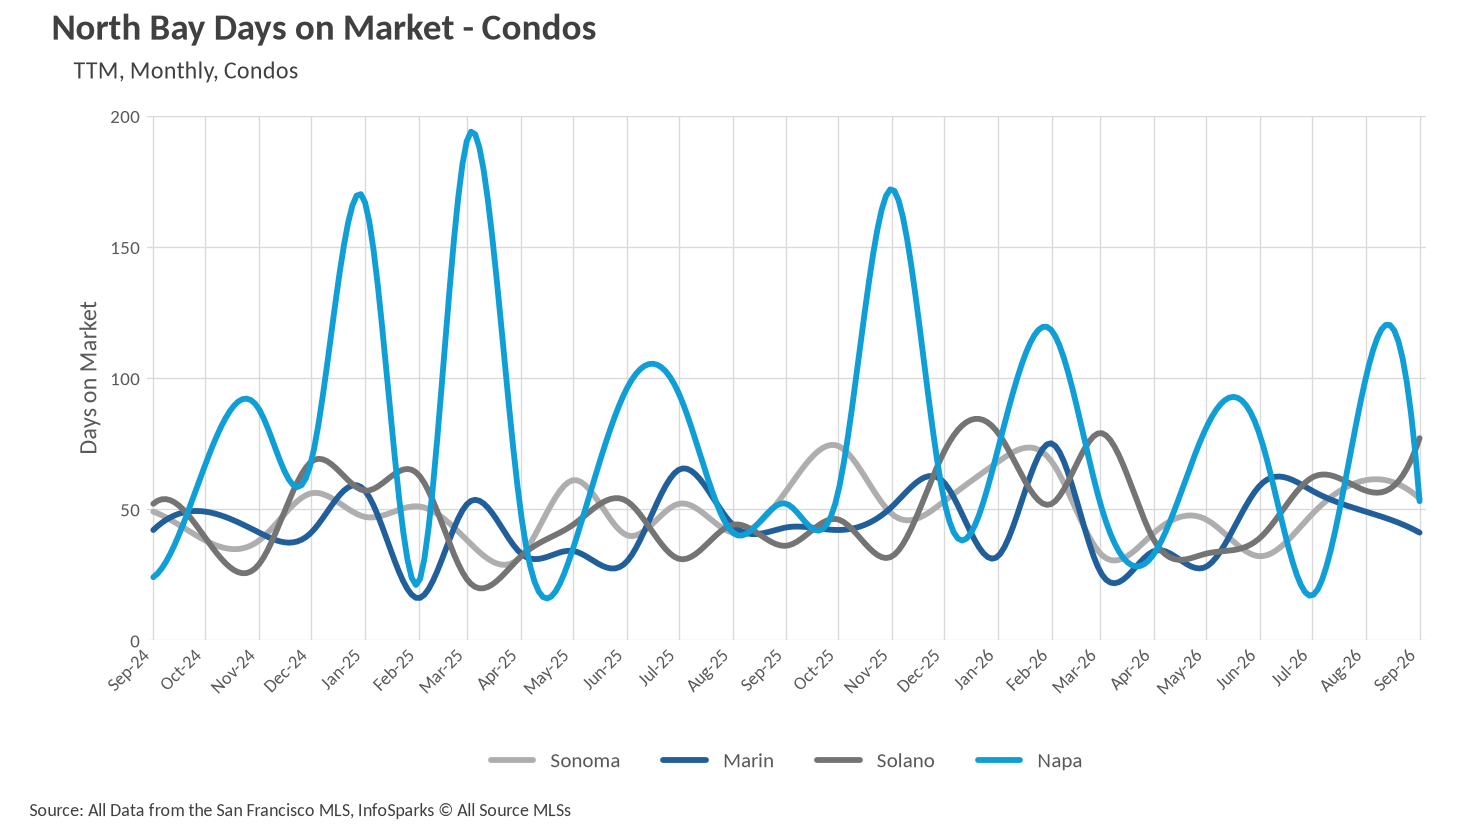
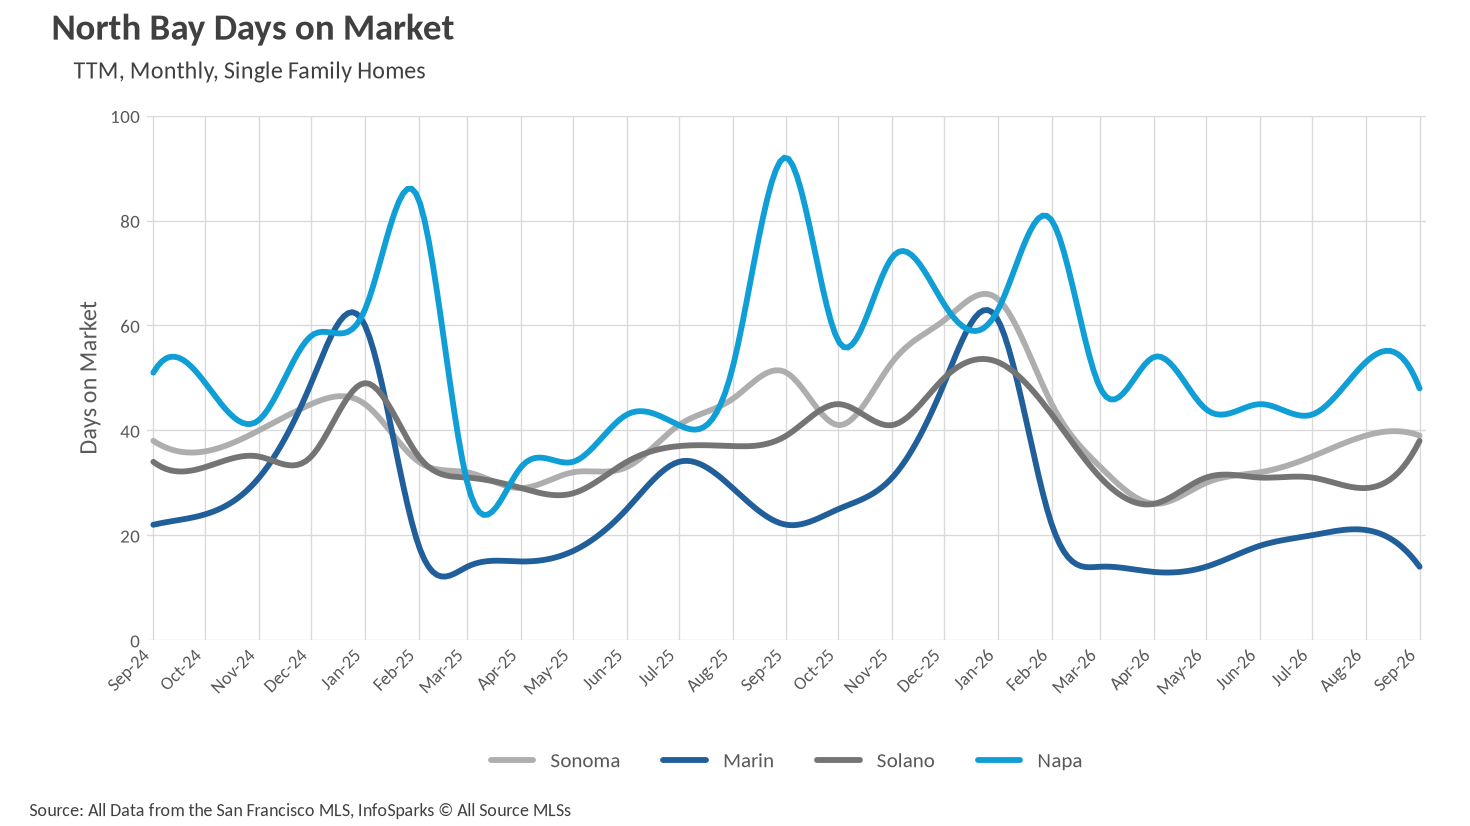
Sales velocity improved broadly in September. Marin County was the fastest market in the region, with the median single-family home finding a buyer in just 14 days, a 36.36% improvement over last September's 22 days and the quickest pace Marin has recorded in the past two years. Napa County delivered the most dramatic swing, with its median single-family home selling in 48 days versus 92 days a year ago, a 47.83% improvement that signals a meaningfully healthier market in the valley. Sonoma County shaved its median to 39 days, down 23.53% year over year, while Solano County came in at 38 days, a modest 2.56% improvement though a step back from August's 29 days. The condo market was more uneven. Sonoma County condos sold in 54 days and Marin County condos in 41 days, improvements of 5.26% and 4.65% respectively. Napa County condos held roughly steady at 53 days, while Solano County condos were the clear laggard at 77 days, more than double last September's 36 days.
Sellers regain the upper hand heading into fall
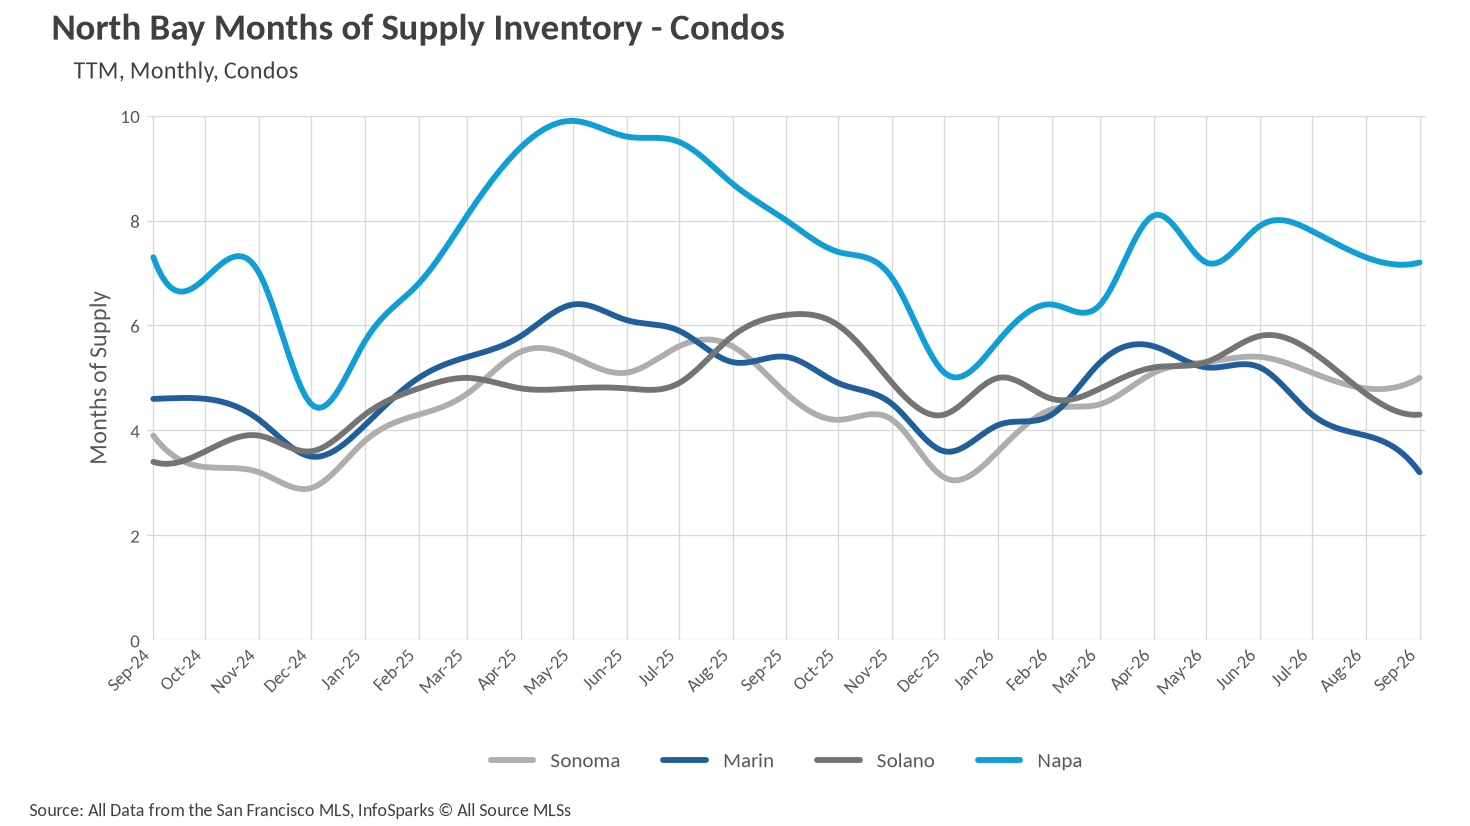
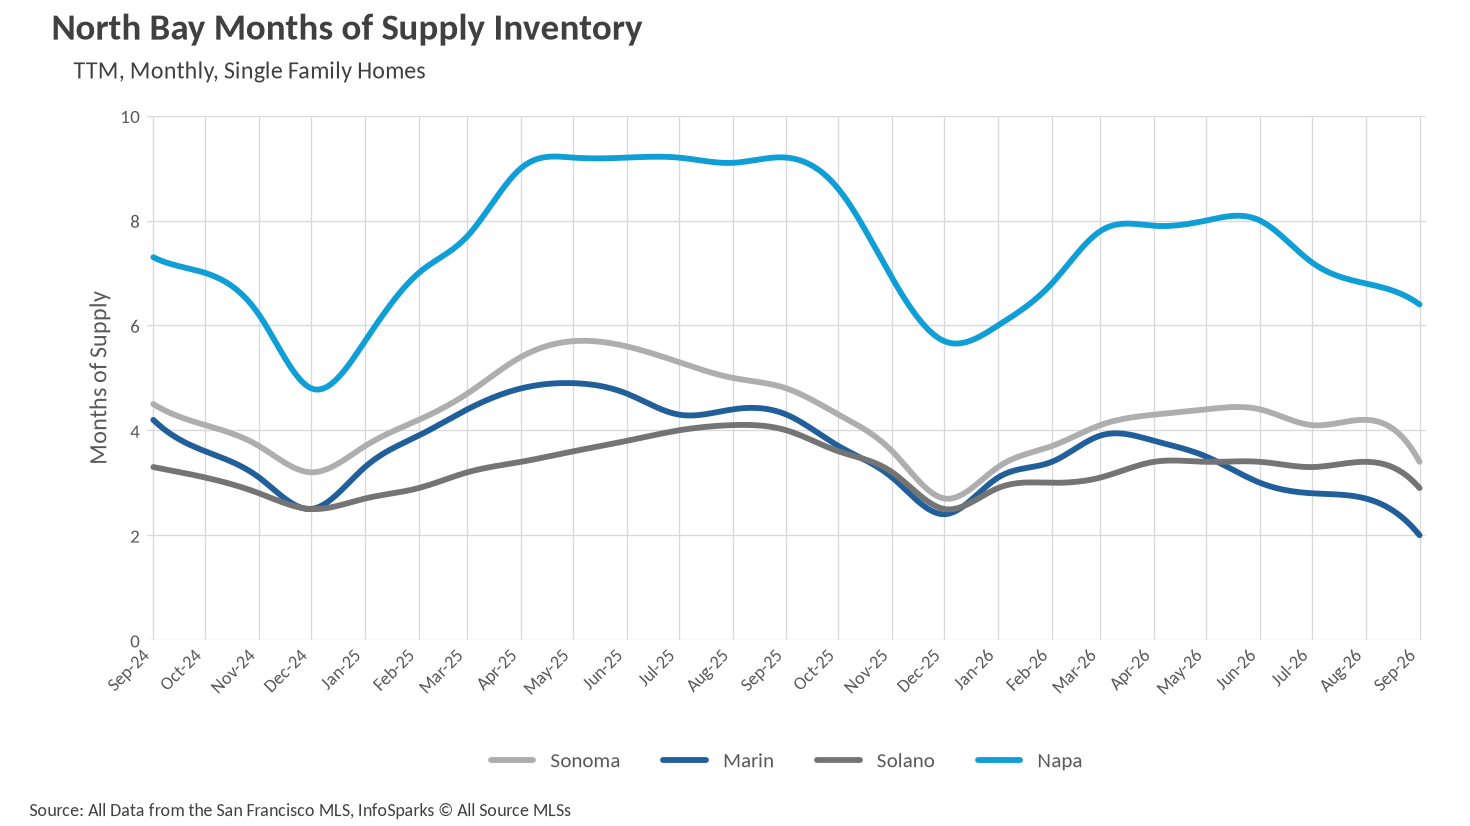
When determining whether a market is a buyers’ market or a sellers’ market, we look to the Months of Supply Inventory (MSI) metric. The state of California has historically averaged around three months of MSI, so any area with at or around three months of MSI is considered a balanced market. Any market that has lower than three months of MSI is considered a seller’s market, whereas markets with more than three months of MSI are considered buyers’ markets.

September brought a decisive shift in sellers' favor as inventory drained faster than demand. Marin County now sits at just 2 months of supply, a 53.49% drop from last September's 4.3 months and the tightest reading in the region, placing it firmly in seller's territory. Solano County follows at 2.9 months, down 27.5% year over year, also a seller's market. Sonoma County has moved into balanced territory at 3.4 months, a 29.17% improvement from 4.8 months a year ago. Napa County remains the regional outlier and a clear buyer's market at 6.4 months, though that figure is down 30.43% from last September's 9.2 months and represents Napa's lowest supply reading since last winter. Condos are generally looser. Marin County condos have tightened to 3.2 months, down 40.74% year over year and close to balanced, while Solano County sits at 4.3 months (down 30.65%), Sonoma County at 5 months (up 6.38%), and Napa County at 7.2 months (down 10%). The takeaway for sellers is that competition for well-priced single-family homes has intensified considerably, while condo sellers outside of Marin still need patience and realistic pricing.

Local Lowdown Data

ActivePipe Message ID: 4125723

Let’s Talk

You’ve got questions and we can’t wait to answer them.