Home Prices Soar 28%, Inventory Tightens & Bidding Wars Intensify

San Francisco Market Update

Quick Take:
  • Exceptional Market Strength: San Francisco's housing market significantly outperformed the cooling national market, driven by strong buyer demand and limited inventory.

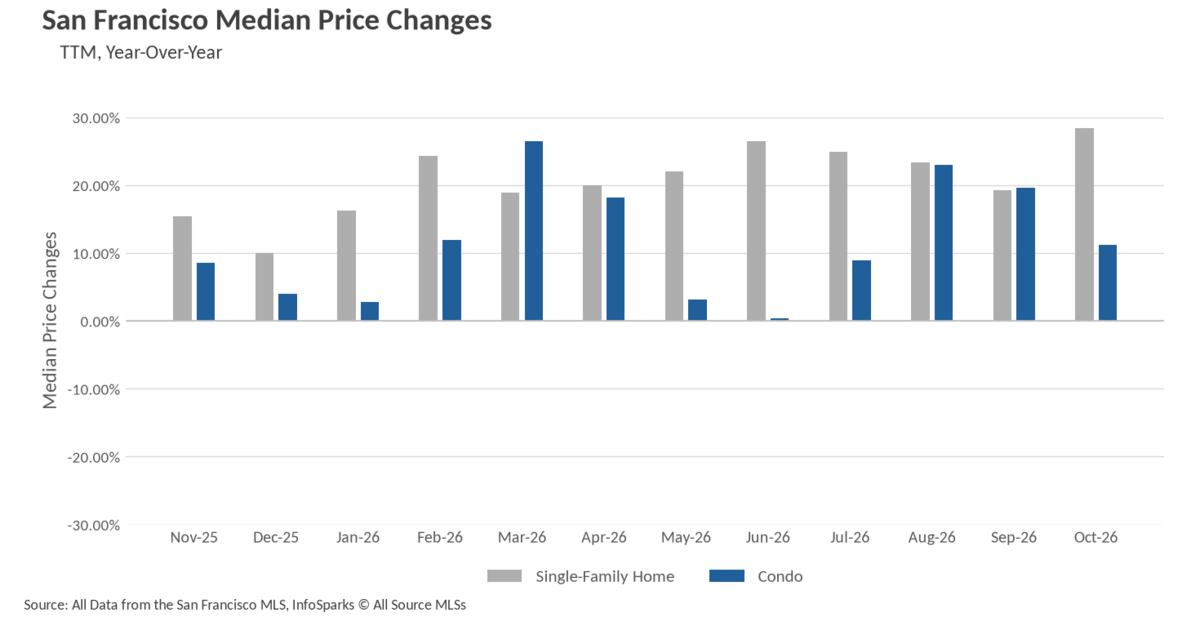
  • Single-Family Home Prices Surge: Median prices climbed 28.38% year-over-year to $2,375,000, reflecting remarkable appreciation.

  • Condominium Market Rebounds: Median condo prices increased 11.25% to $1,335,000, signaling renewed buyer confidence.

  • Inventory Remains Tight: Single-family home listings declined 24.56%, while condominium inventory dropped 18.53% year-over-year.

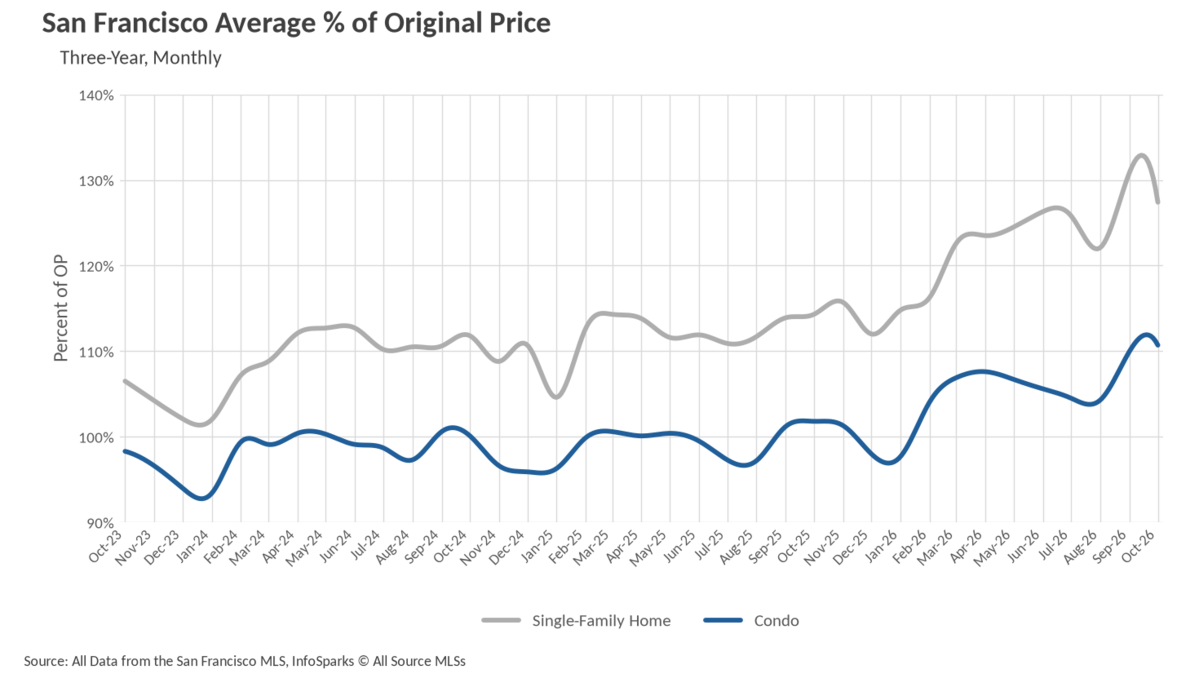
  • Intense Buyer Competition: Single-family homes sold at an average of 127% of their original asking price, while condos achieved 111%.

  • Homes Selling Quickly: Single-family homes averaged just 12 days on market, compared with 14 days for condominiums.

  • Strong Seller's Market: With only 1.1 months of single-family inventory and 2.2 months for condos, sellers maintained a significant advantage.

  • Market Outlook: Limited supply, strong demand, and rising prices continue to support San Francisco's housing market, while buyers must remain prepared and strategic to compete successfully.

Bottom Line: San Francisco's real estate market continues to demonstrate exceptional strength, with soaring prices, shrinking inventory, and competitive bidding creating favorable conditions for sellers and rewarding well-prepared buyers.

The spring rally has given way to an autumn cooldown
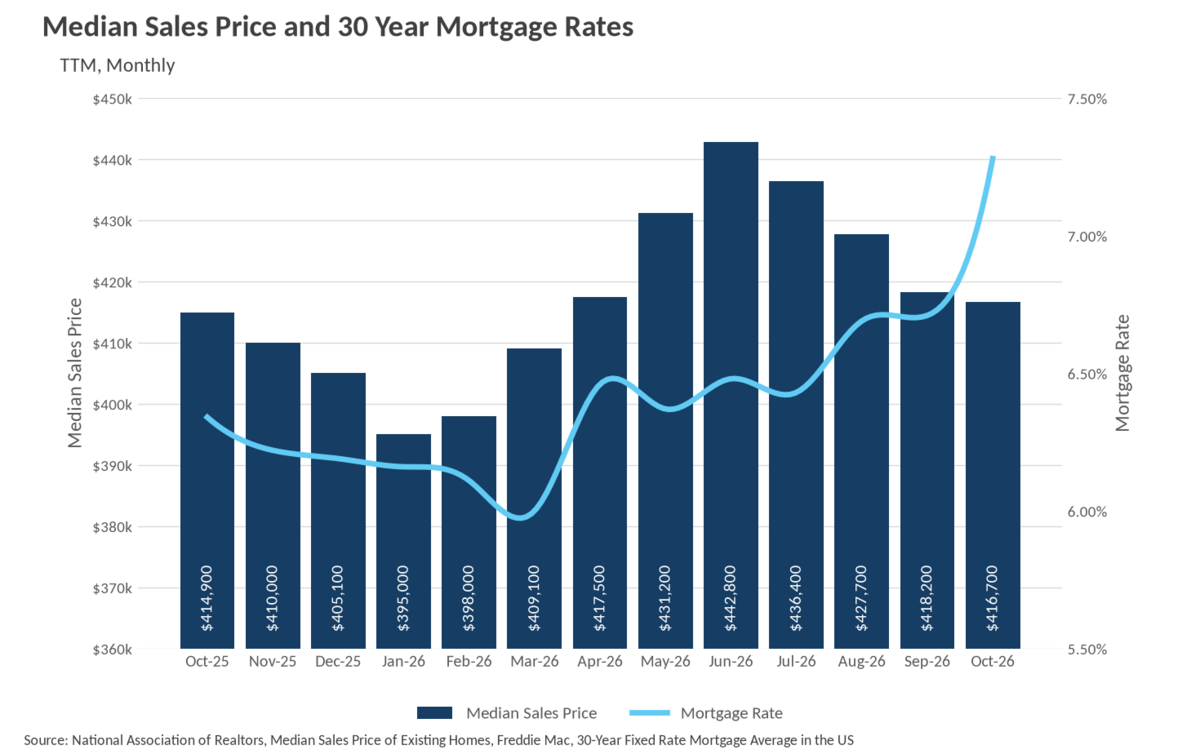
After median sale prices climbed all the way to $442,800 in June, the market has spent the back half of the year giving those gains back. In October, the median home sold for $416,700, a 0.36% month-over-month decline from September's $418,200 and the fourth consecutive monthly step down. All told, prices have retreated 5.90% from the June peak. The one silver lining is that the year-over-year comparison is still positive, if only barely: October 2025 saw a median of $414,900, which puts current prices 0.43% higher than a year ago.

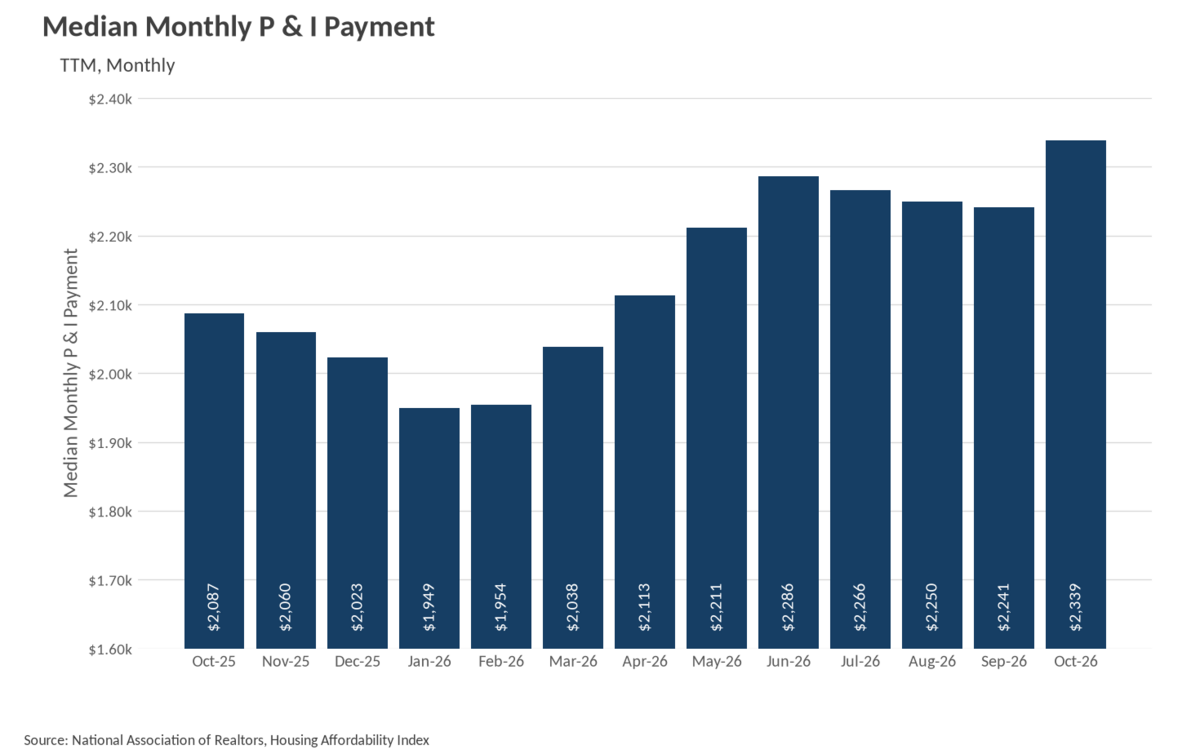
The affordability story, however, has gone from concerning to genuinely difficult. Mortgage rates surged to 7.28% in October, up sharply from 6.71% in September and a world away from the 6.00% floor we saw in March. Rates did pull back slightly to 7.18% in November, which is the most current reading we have, but that is small comfort. The result is that even with prices falling, the median monthly principal and interest payment rose to $2,339 in October, up 4.37% from September and 12.07% above the $2,087 buyers were paying last October. Put differently, the median payment has climbed just over 20% from January's $1,949 low, even though the median sale price is up only 5.49% over that same stretch. This is a rate-driven affordability squeeze, plain and simple, and falling prices have not been enough to offset it.
Inventory climbs to its highest level of the year
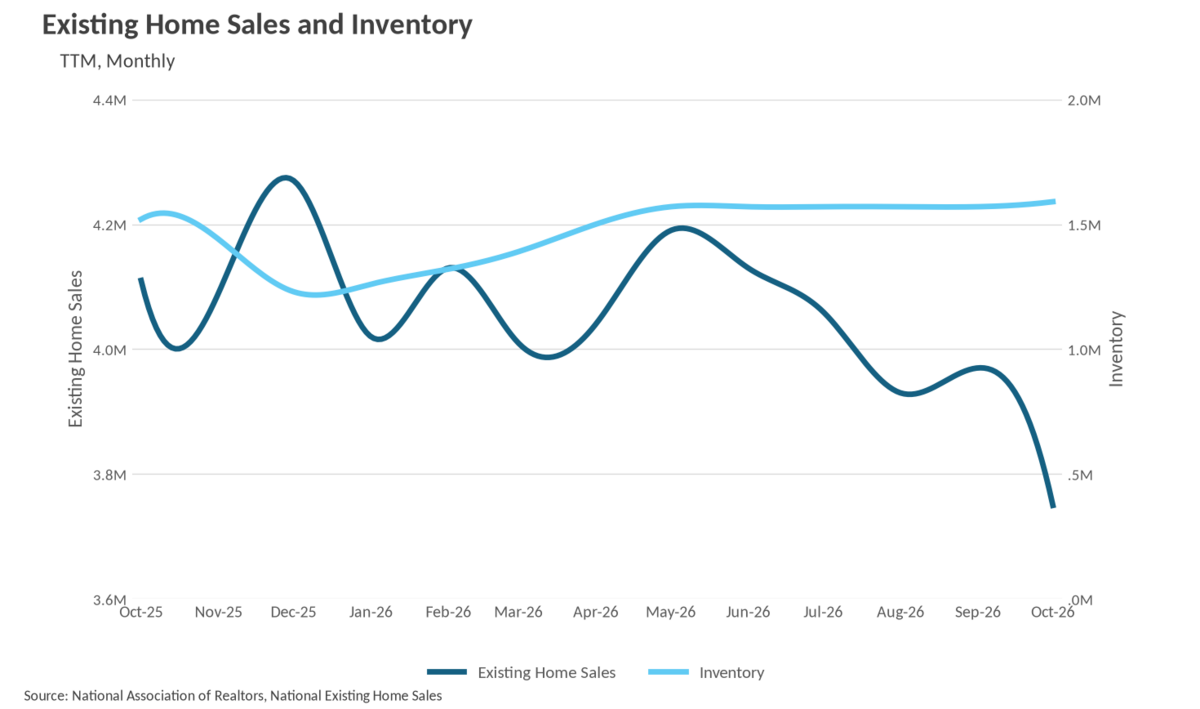
Inventory had been remarkably static through the middle of the year, holding at exactly 1,570,000 homes from May through September. That streak broke in October, when inventory rose to 1,590,000, a 1.27% month-over-month increase and the highest level we have seen in this data set. Compared to the 1,520,000 homes available last October, supply is up 4.61% year-over-year, and it sits 29.27% above the December 2025 trough of 1,230,000.

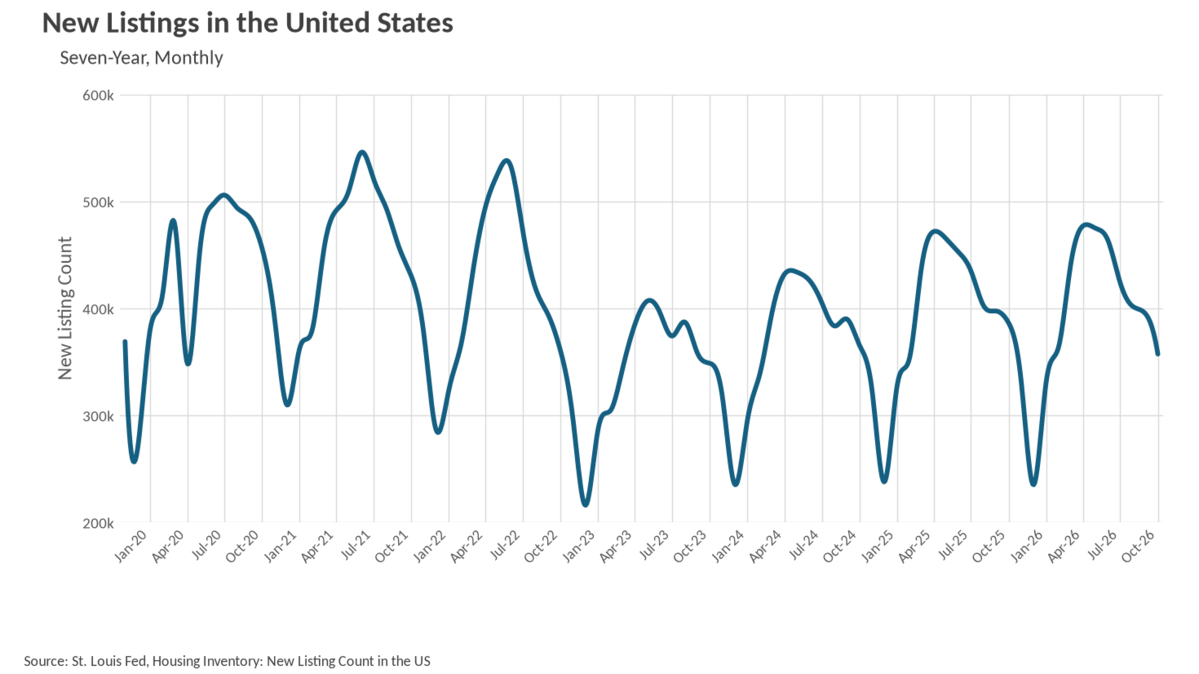
What makes that increase notable is that it is not coming from sellers flooding the market. New listings actually fell to 357,268 in October, down 9.51% from September and down 7.54% from the 386,414 new listings we saw in October 2025. Sellers are pulling back, not leaning in. Inventory is building because homes are sitting, not because more of them are being listed. That is a meaningful distinction, because it tells us the supply story is really a demand story in disguise. Seasonally, we would expect both new listings and total inventory to recede through the winter, so the fact that inventory grew in October is a signal worth watching closely.
Existing home sales hit their slowest pace in more than a year
Existing home sales came in at 3,750,000 in October, a 5.54% drop from September's 3,970,000 and an 8.76% decline from the 4,110,000 pace recorded last October. That is the weakest reading in this entire series, and it caps a steady deterioration that began after sales peaked at 4,190,000 in May. Sales have now fallen in four of the last five months.

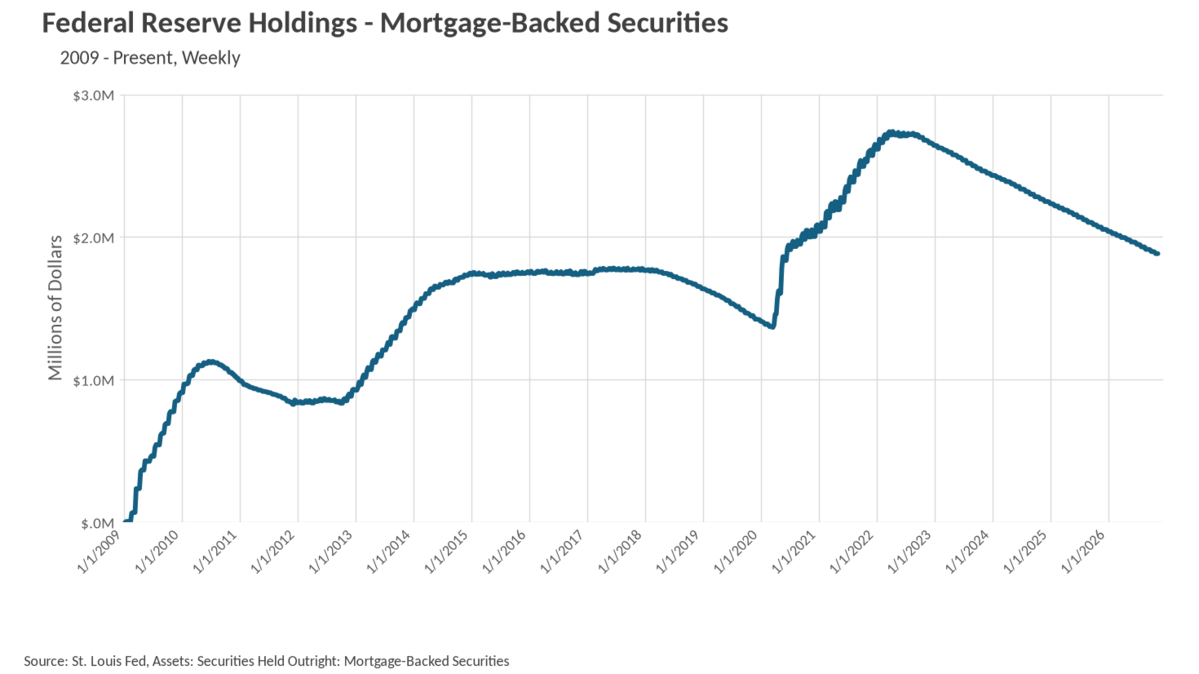
The timing lines up almost perfectly with the move in rates. Through the spring, when rates sat between 6.00% and 6.48%, sales held in the 4,000,000 to 4,190,000 range. Once rates pushed through 6.69% in August and then spiked to 7.28% in October, buyers stepped back in a hurry. One factor worth keeping an eye on is the Federal Reserve's mortgage-backed securities portfolio, which has continued to run off steadily, falling from roughly $2.024 trillion in February to $1.884 trillion as of November. With the Fed shrinking its footprint in the mortgage market, there is less support holding mortgage rates down relative to Treasury yields, which helps explain why borrowing costs have been so stubborn even as home prices soften.
Supply is building faster than buyers can absorb it
When determining whether a market is a buyers’ market or a sellers’ market, we look to the Months of Supply Inventory (MSI) metric. The state of California has historically averaged around three months of MSI, so any area with at or around three months of MSI is considered a balanced market. Any market that has lower than three months of MSI is considered a seller’s market, whereas markets with more than three months of MSI are considered buyers’ markets.

Nationally, the math has clearly shifted toward buyers. With 1,590,000 homes available in October against an annualized sales pace of 3,750,000, the market is carrying roughly 5.1 months of supply, comfortably above the three-month balanced threshold. Compare that to June, when 1,570,000 homes and a 4,130,000 sales pace worked out to about 4.6 months, and the direction of travel is unmistakable. Rising inventory, falling sales, and four straight months of price declines all point the same way. The counterweight is that sellers are not being forced to list, as evidenced by new listings falling nearly 10% month-over-month, which should keep supply growth in check and prevent prices from falling off a cliff. If rates continue easing from the 7.28% October peak toward November's 7.18% and beyond, demand could stabilize quickly. As always, real estate is a highly localized asset, which is why you should check out what's going on in your local market below in the Local Lowdown!

Big Story Data

The Local Lowdown
Quick Take:
  • Single-family home prices jumped more than 28% year-over-year in October to a new high of $2,375,000, the strongest annual gain of 2026.
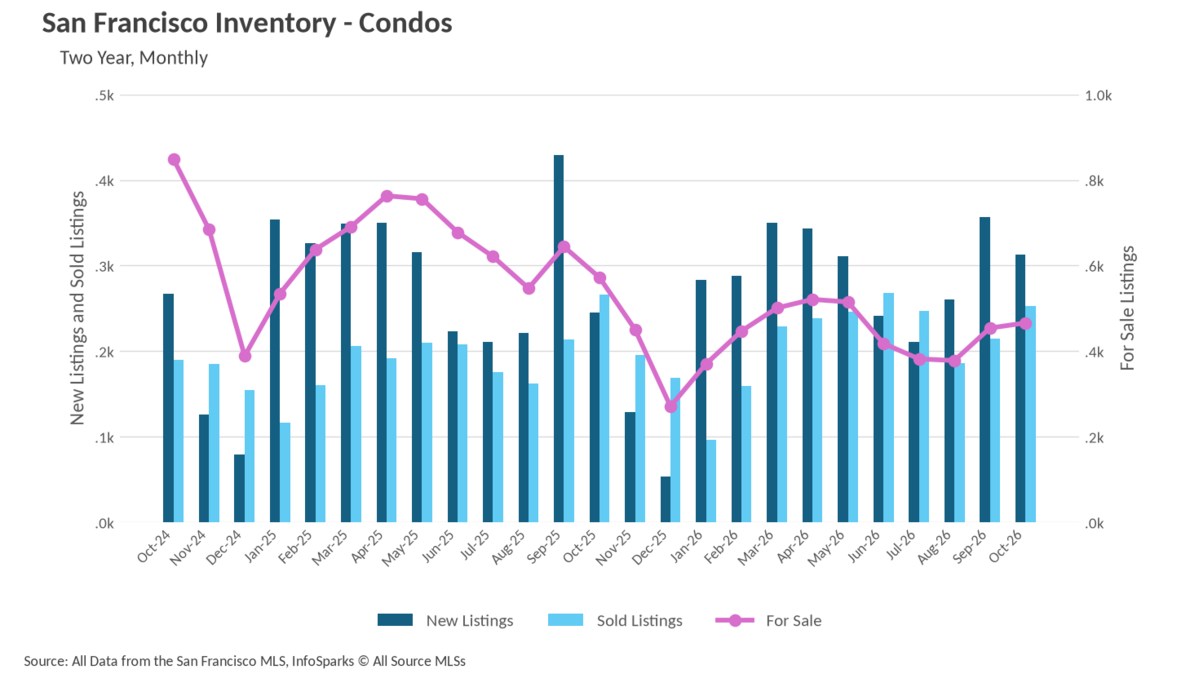
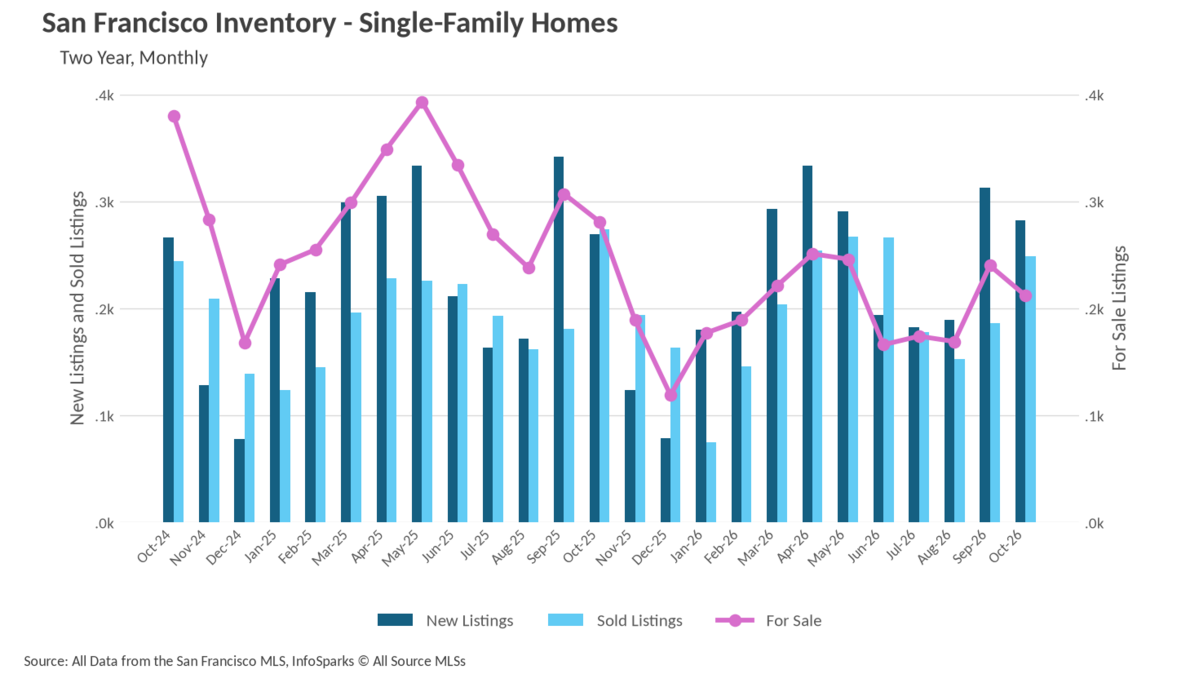
  • Inventory remains deeply constrained, with 212 single-family homes and 466 condos listed for sale citywide as of October, down 24.56% and 18.53% respectively from a year ago.
  • Single-family homes continue to sell in just 12 days, while condos have cut their time on market nearly in half year-over-year to 14 days.
Note: You can find the charts/graphs for the Local Lowdown at the end of this section.

Single-family prices break through to a new high
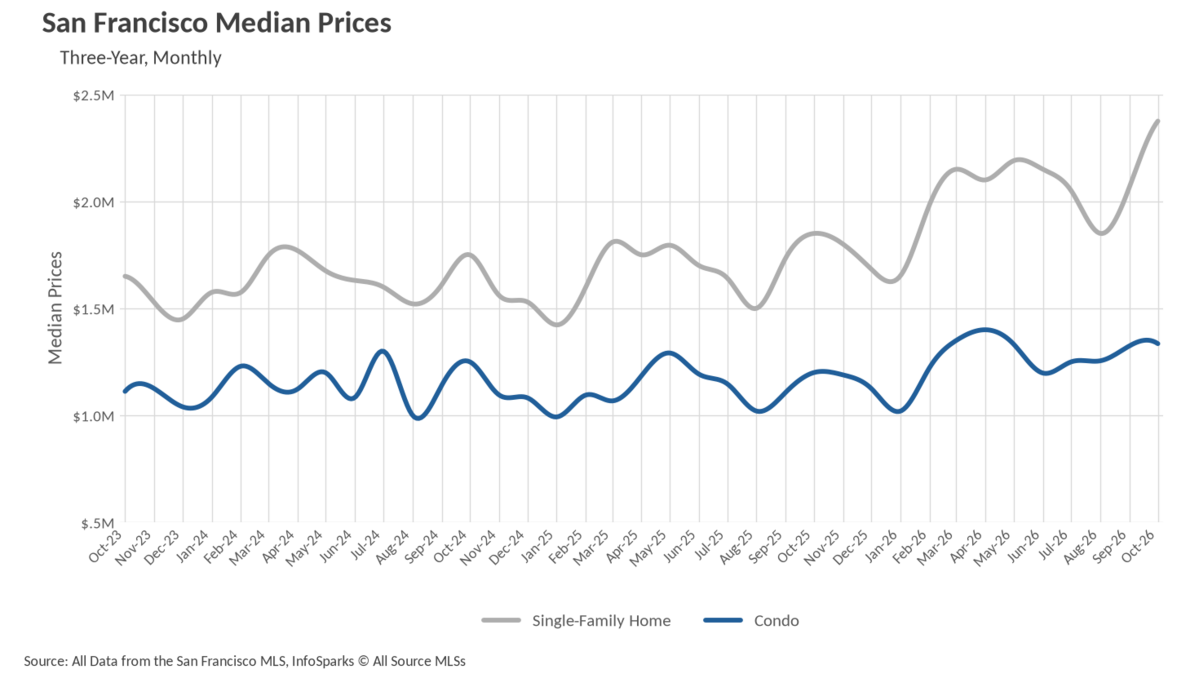
October delivered the most dramatic price move San Francisco has seen in this cycle. The median single-family sale price climbed to $2,375,000, a 28.38% increase over the $1,850,000 recorded in October 2025 and a 14.79% jump from September's $2,069,000. That figure is the highest in the three-year span we track, surpassing the previous peak of $2,190,000 set back in May. It is worth noting how quickly this market has repriced: as recently as August the median sat at $1,850,000, and a year ago it was running in the $1.7 million to $1.85 million range.

The condo market is appreciating as well, though at a steadier pace. October's median condo price of $1,335,000 represents an 11.25% annual gain over last October's $1,200,000, and a slight uptick from September's $1,325,000. Condos have now posted gains in four of the last five months, though they remain below the April high of $1,400,000.

Competition metrics tell the same story. Single-family homes sold for an average of 127% of their original asking price in October, down modestly from September's remarkable 131% but far above the 114% logged a year ago. Condos, meanwhile, hit a series high at 111% of original price, up from 110% in September and a full nine percentage points above last October's 102%. For the condo segment in particular, that shift from essentially selling at list to routinely selling over it marks a real change in negotiating dynamics.

Supply stays scarce even as fall listings arrive
Sellers did come to market this fall. October brought 282 new single-family listings, up 4.83% from the 269 new listings a year earlier, and 313 new condo listings, a 27.76% annual increase. Yet that fresh supply has not translated into any meaningful cushion for buyers, because absorption keeps pace with it.

As of October there were just 212 single-family homes for sale across the entire city, down 24.56% from the 281 available last October and down 11.67% from September's 240. The condo picture is similar in direction if not degree, with 466 units for sale, an 18.53% year-over-year decline from 572 and only a slight 2.64% increase from September. Combined, that leaves roughly 678 homes on the market citywide heading into the slowest stretch of the year.

Sales volume underscores how thin the pipeline really is. Single-family closings totaled 249 in October, down 9.12% from a year ago, while condo closings came in at 253, off 4.89%. Buyers are not stepping back by choice. There simply is not much to buy, and with November and December historically producing the lightest new listing counts of the year, selection is likely to tighten further before the spring season brings relief.

Properties are moving almost as fast as they can be listed
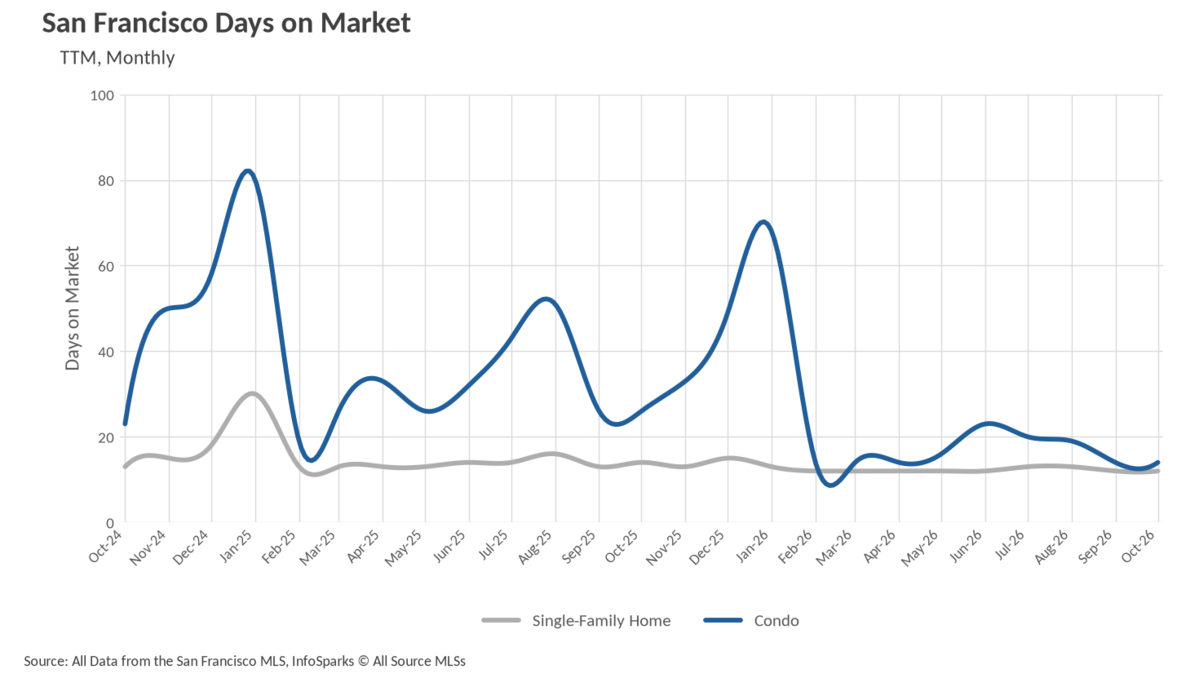
The average single-family home sold in 12 days in October, matching September and marking a 14.29% improvement over the 14 days recorded last October. Single-family days on market have now held at 12 or 13 days for nine consecutive months, an unusually consistent run that reflects how quickly well-positioned listings are absorbed.

The condo market has seen the more striking transformation. Condos sold in an average of 14 days in October, identical to September but a 46.15% decline from the 26 days logged a year ago. For context, condos were sitting on the market for 49 days last December and 68 days in January. That the segment is now closing in two weeks during the fourth quarter, when seasonal slowdowns typically push the number higher, speaks to genuine demand depth rather than a statistical quirk.
San Francisco remains firmly in sellers' territory across both segments
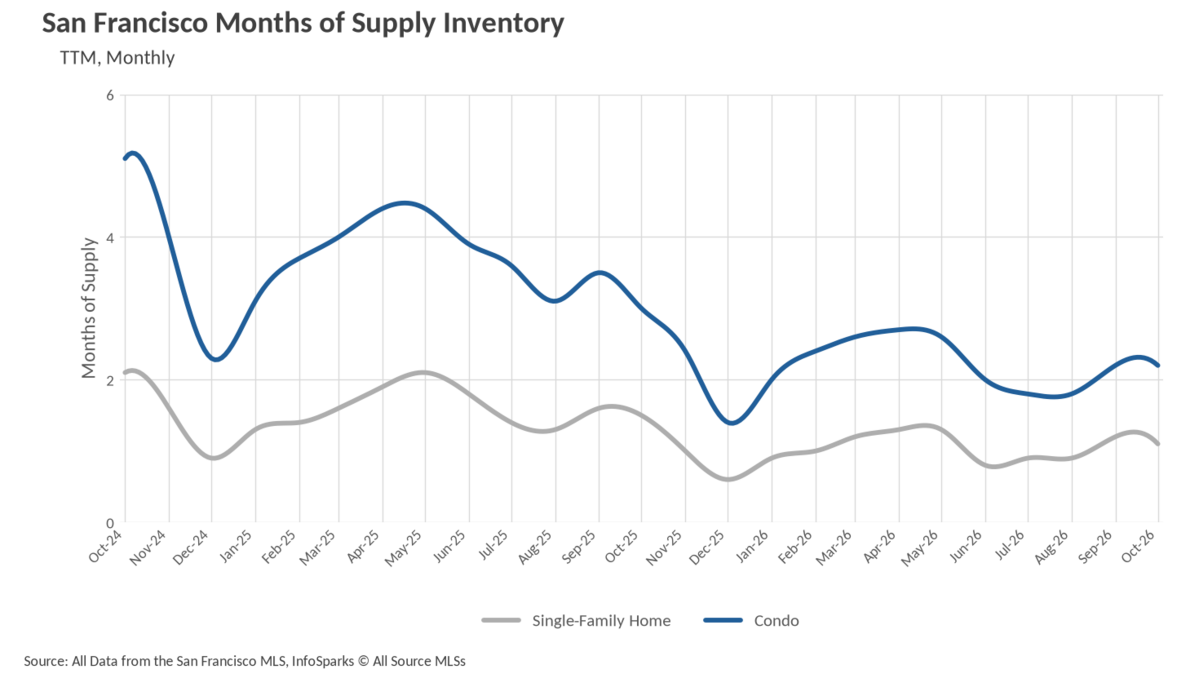
When determining whether a market is a buyers’ market or a sellers’ market, we look to the Months of Supply Inventory (MSI) metric. The state of California has historically averaged around three months of MSI, so any area with at or around three months of MSI is considered a balanced market. Any market that has lower than three months of MSI is considered a seller’s market, whereas markets with more than three months of MSI are considered buyers’ markets.

San Francisco sits well below that three-month threshold in both property types. Single-family inventory stood at 1.1 months of supply in October, down from 1.2 months in September and 26.67% below the 1.5 months recorded last October. At the current sales pace, every single-family home on the market would be gone in roughly five weeks. Condos registered 2.2 months of supply, unchanged from September but down 26.67% from the 3.0 months of a year ago, which means the condo segment has crossed from balanced conditions into a clear sellers' market over the past twelve months. With prices at record highs, days on market near record lows, and both segments selling above original asking price, sellers continue to hold the stronger position heading into the winter.

Local Lowdown Data

ActivePipe Message ID: 4174247

Let’s Talk

You’ve got questions and we can’t wait to answer them.