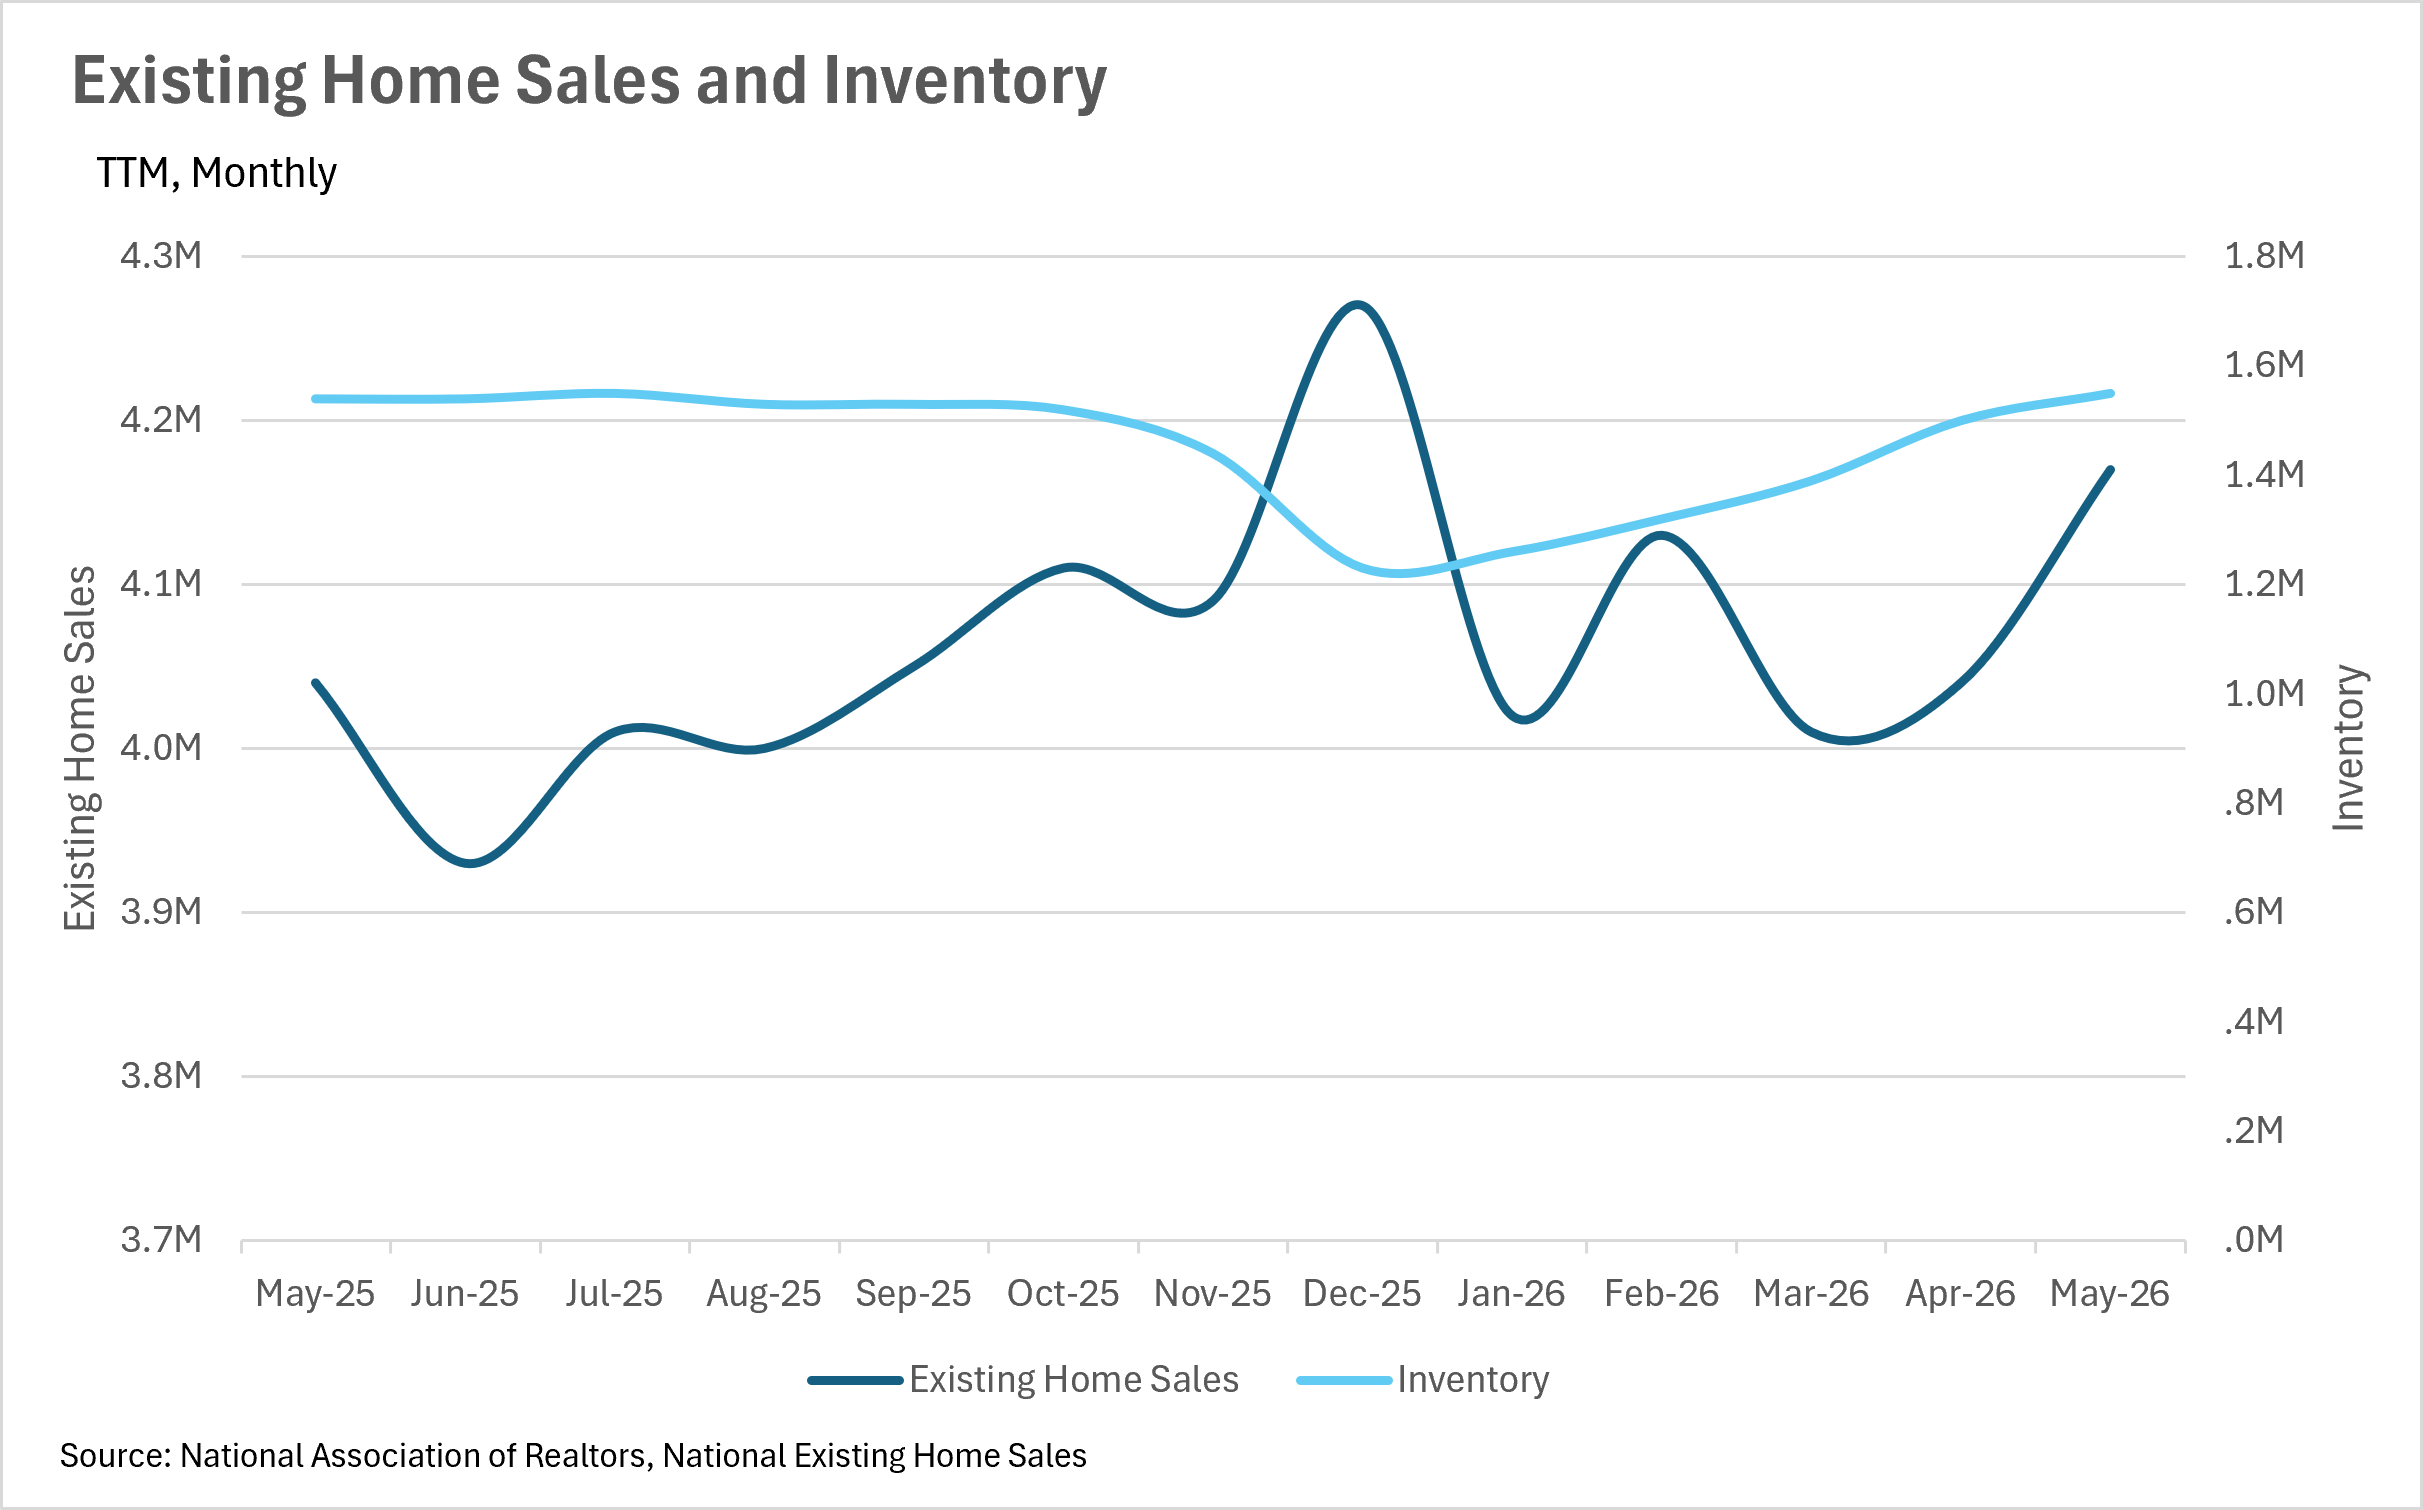
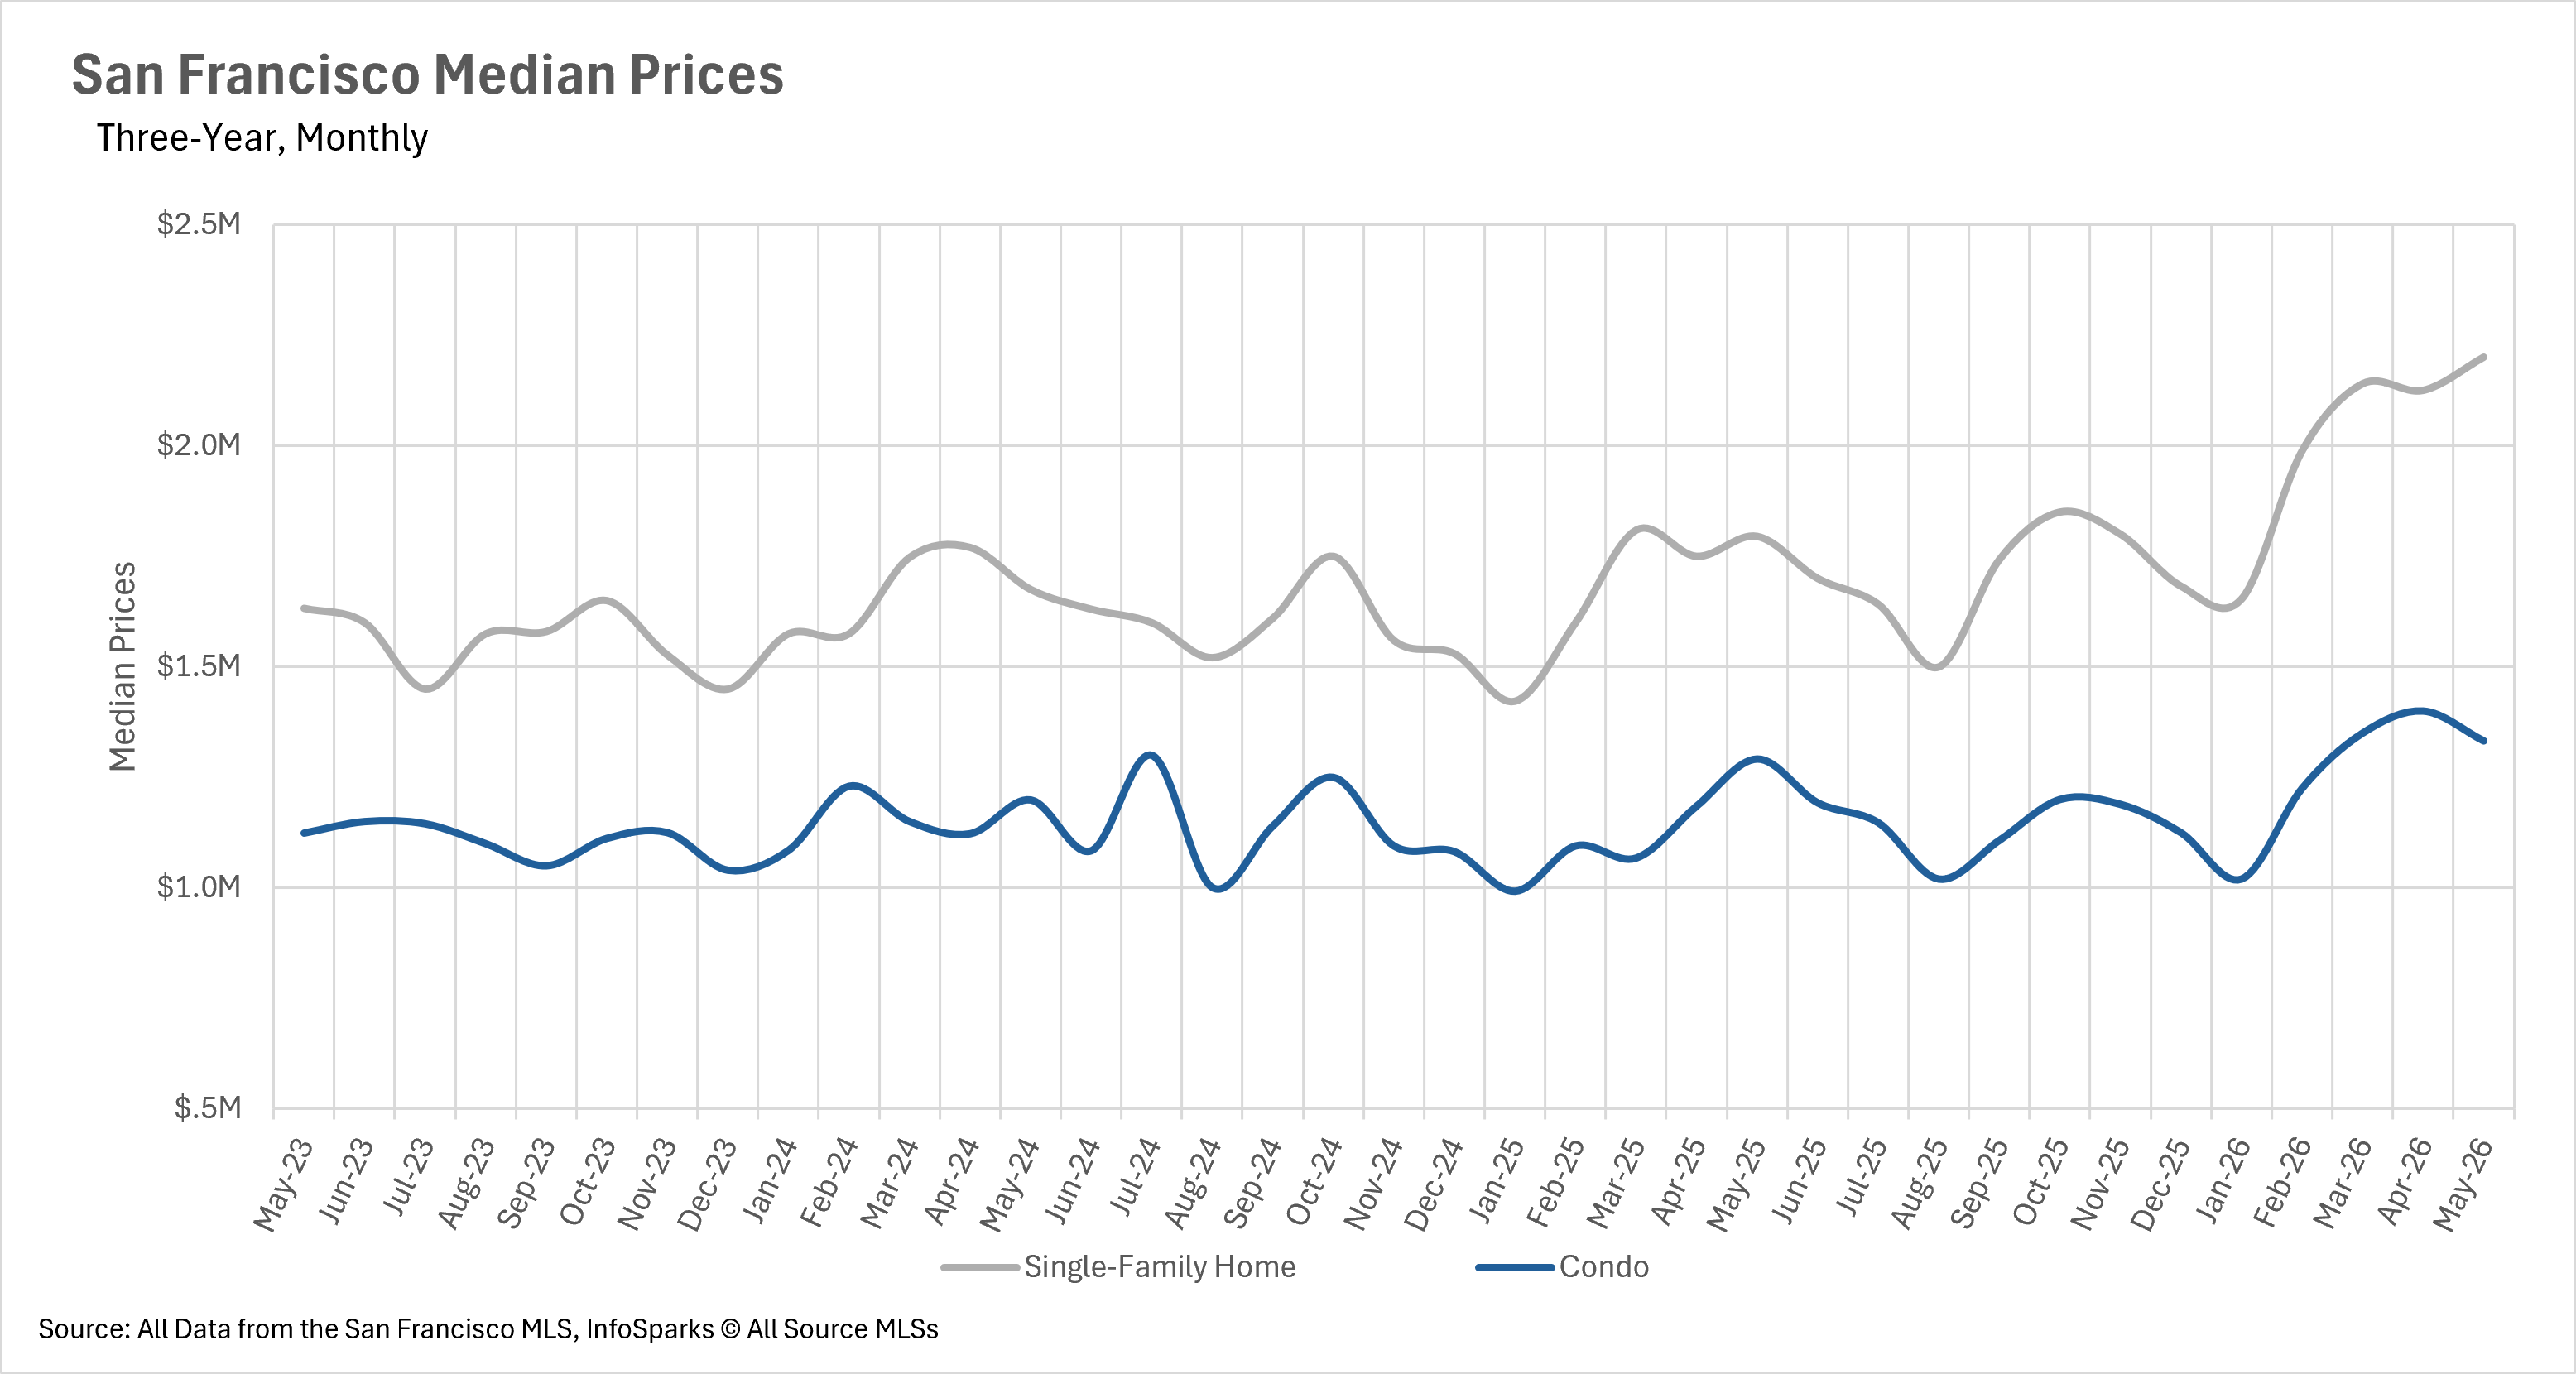
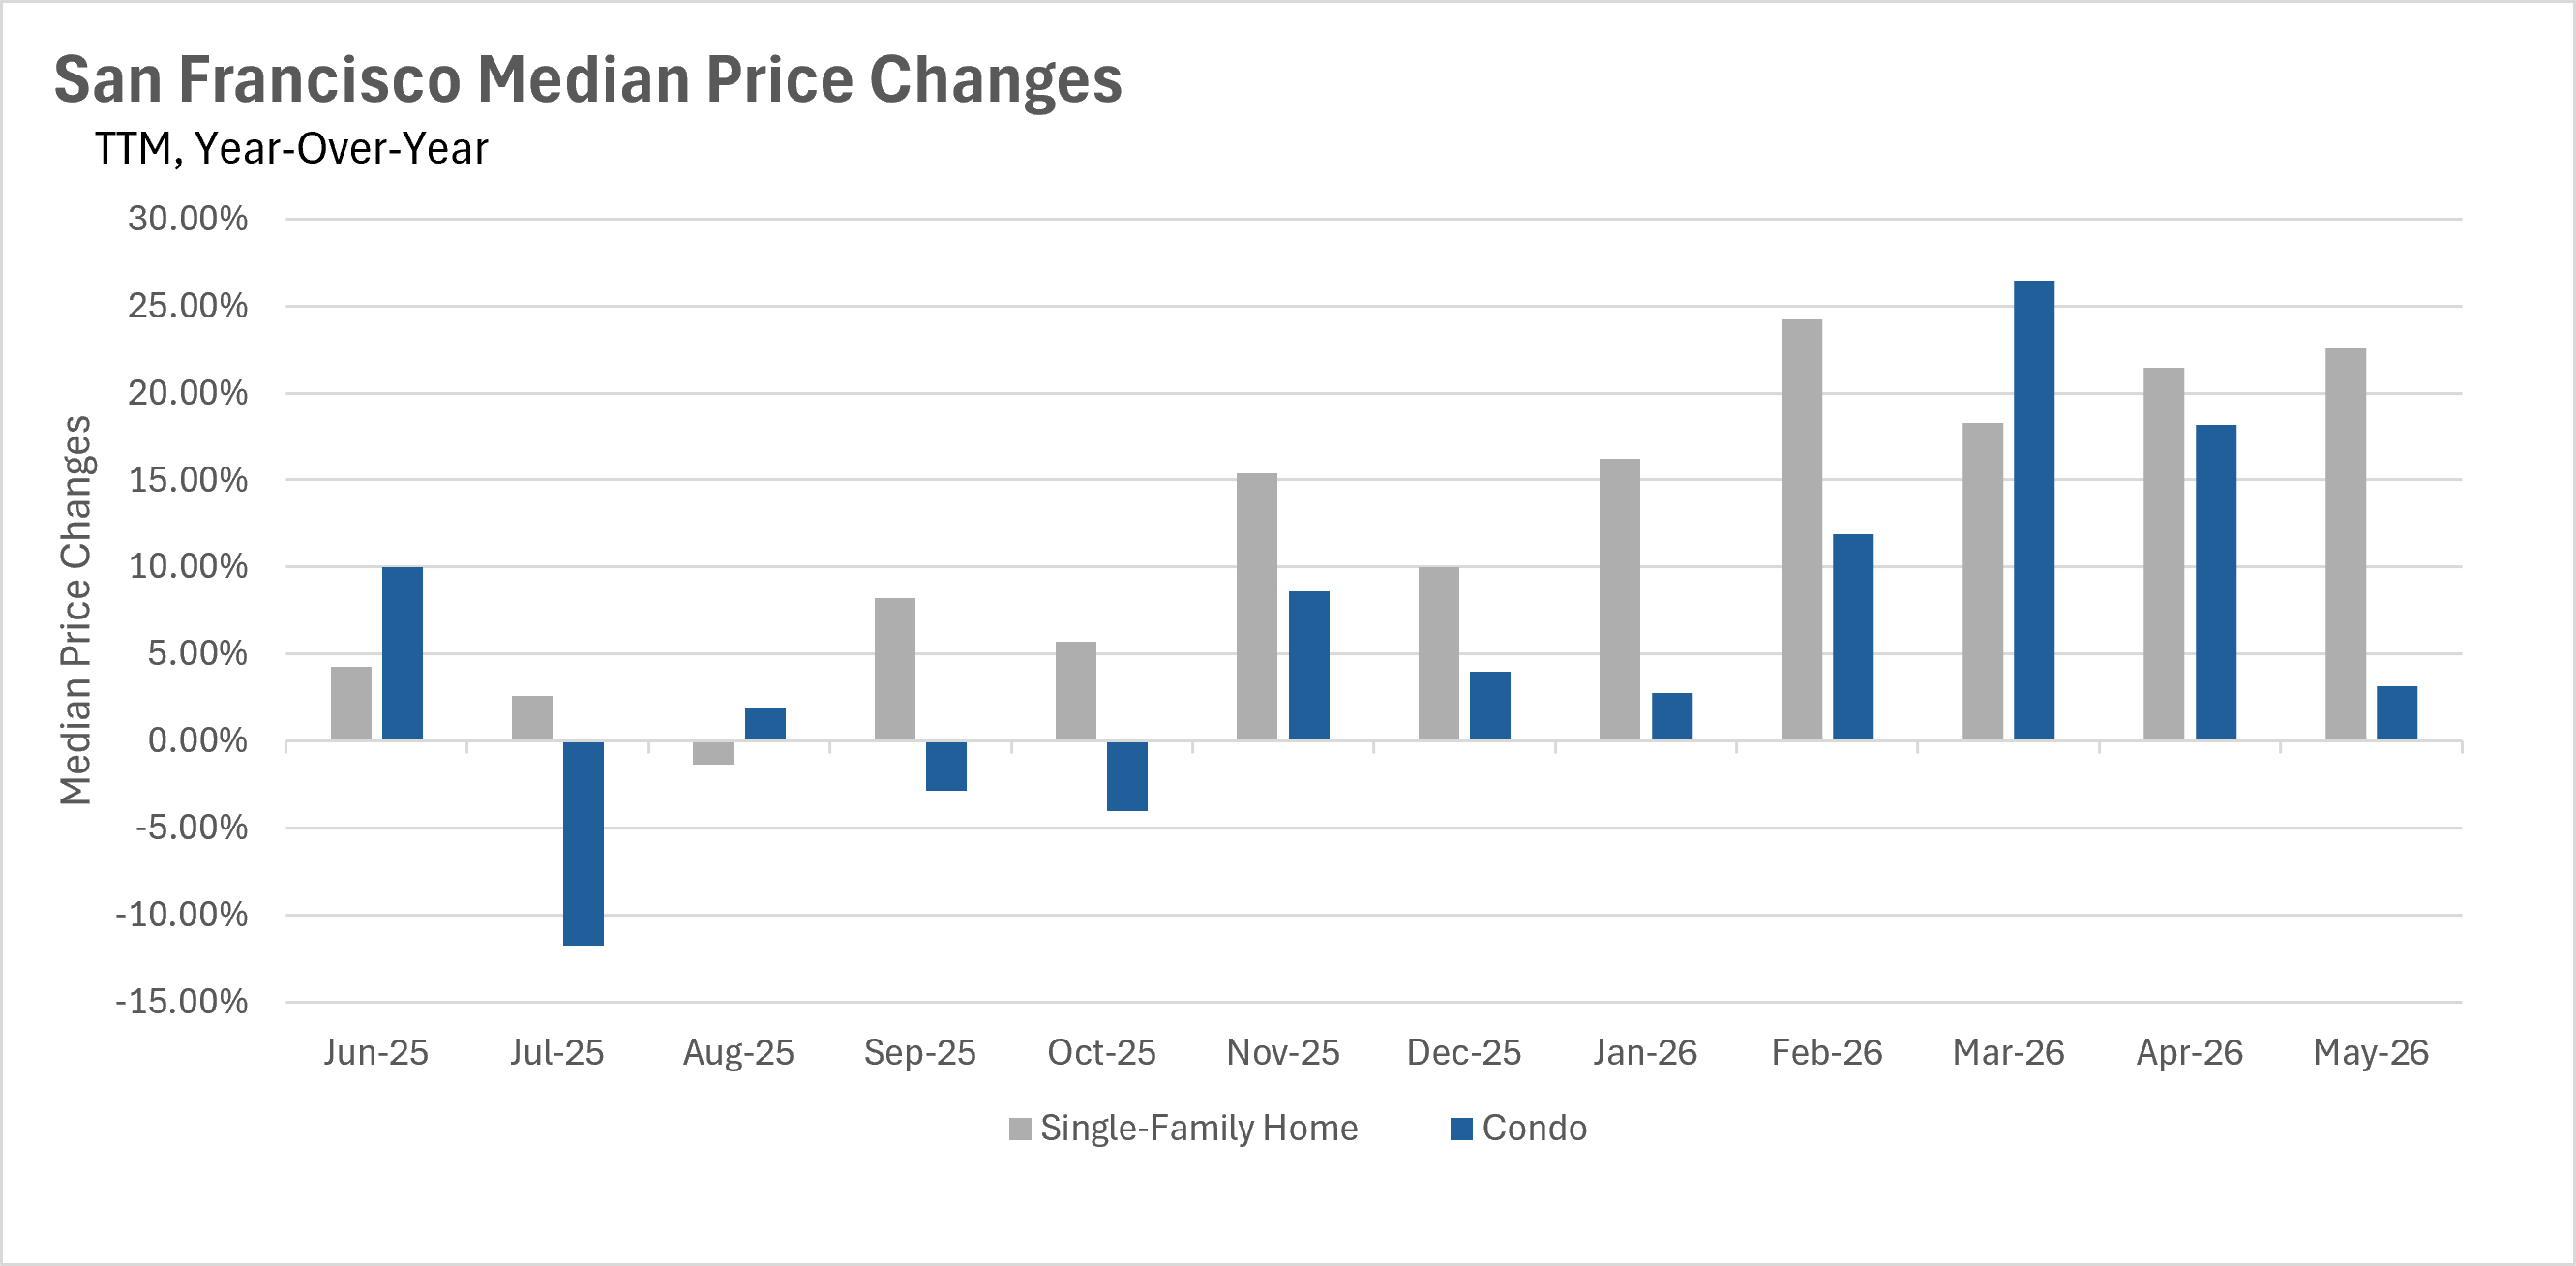
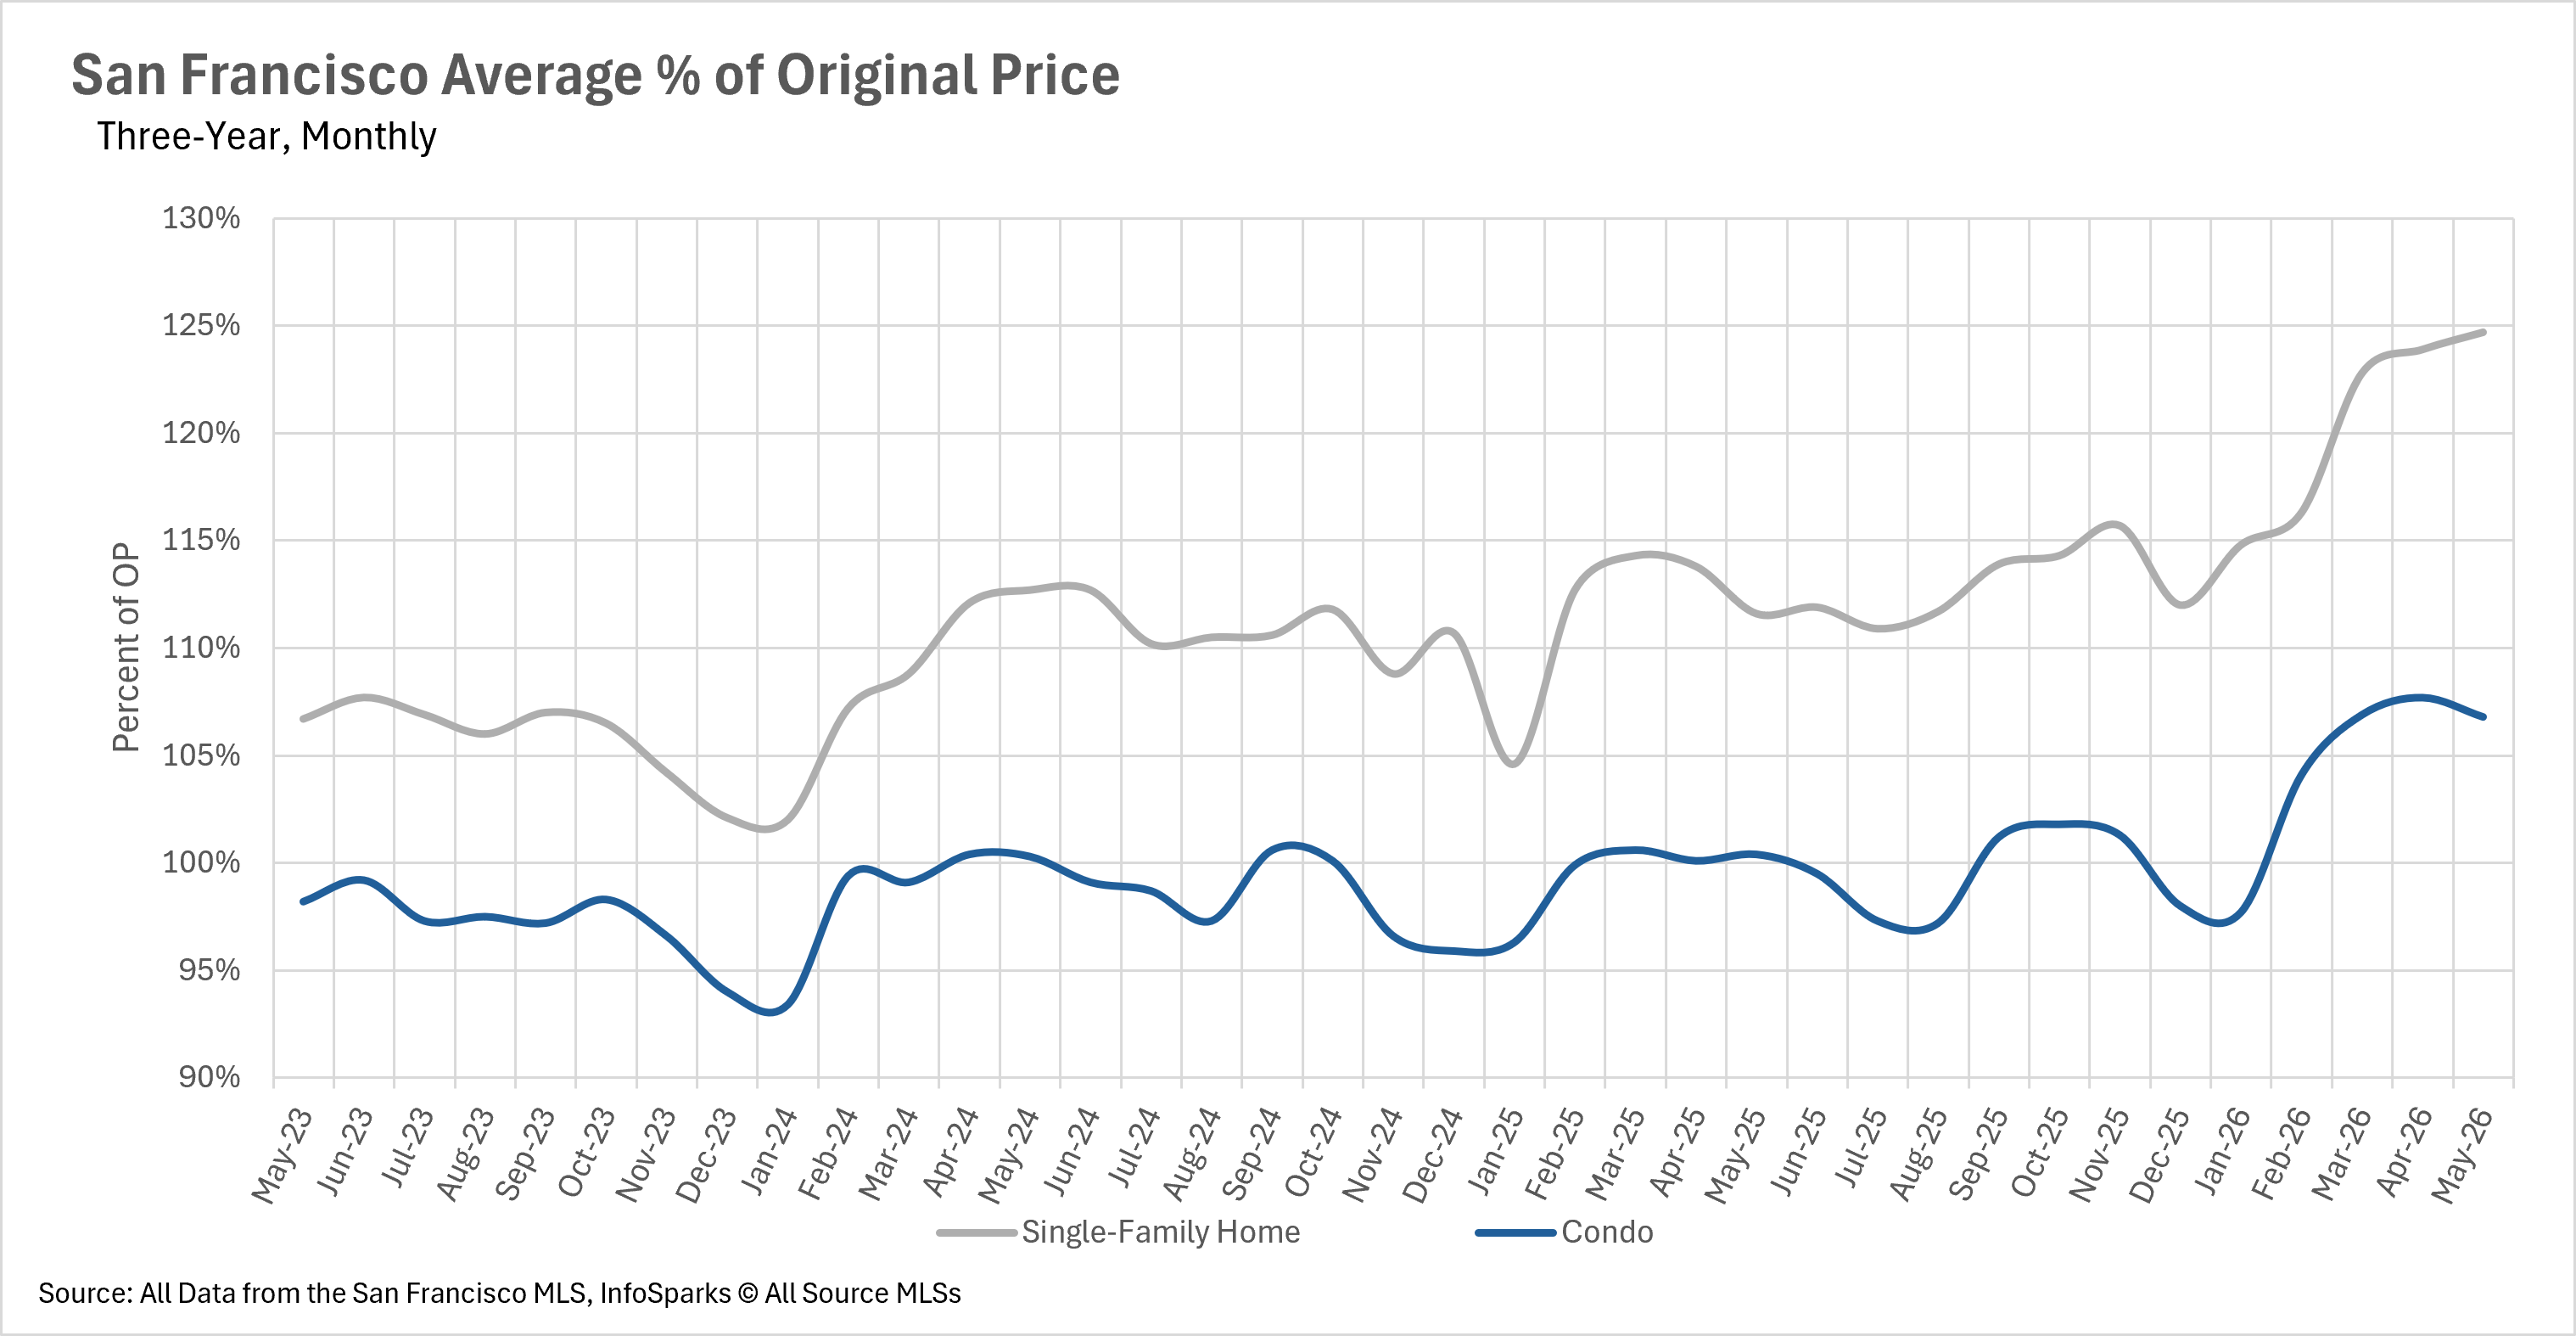
Existing home sales posted their strongest year-over-year gain in quite some time, signaling that buyers are finally coming off the sidelines.

|
|
|
|
|
|
|
|
|
|
|
|
|
|
|
|
|
|
|
|
|
|
|
|
|
|
|
|
|
|
|
|
|
|
|
|
|
|
|
|
|
|
|
Stay up to date on the latest real estate trends.


You’ve got questions and we can’t wait to answer them.