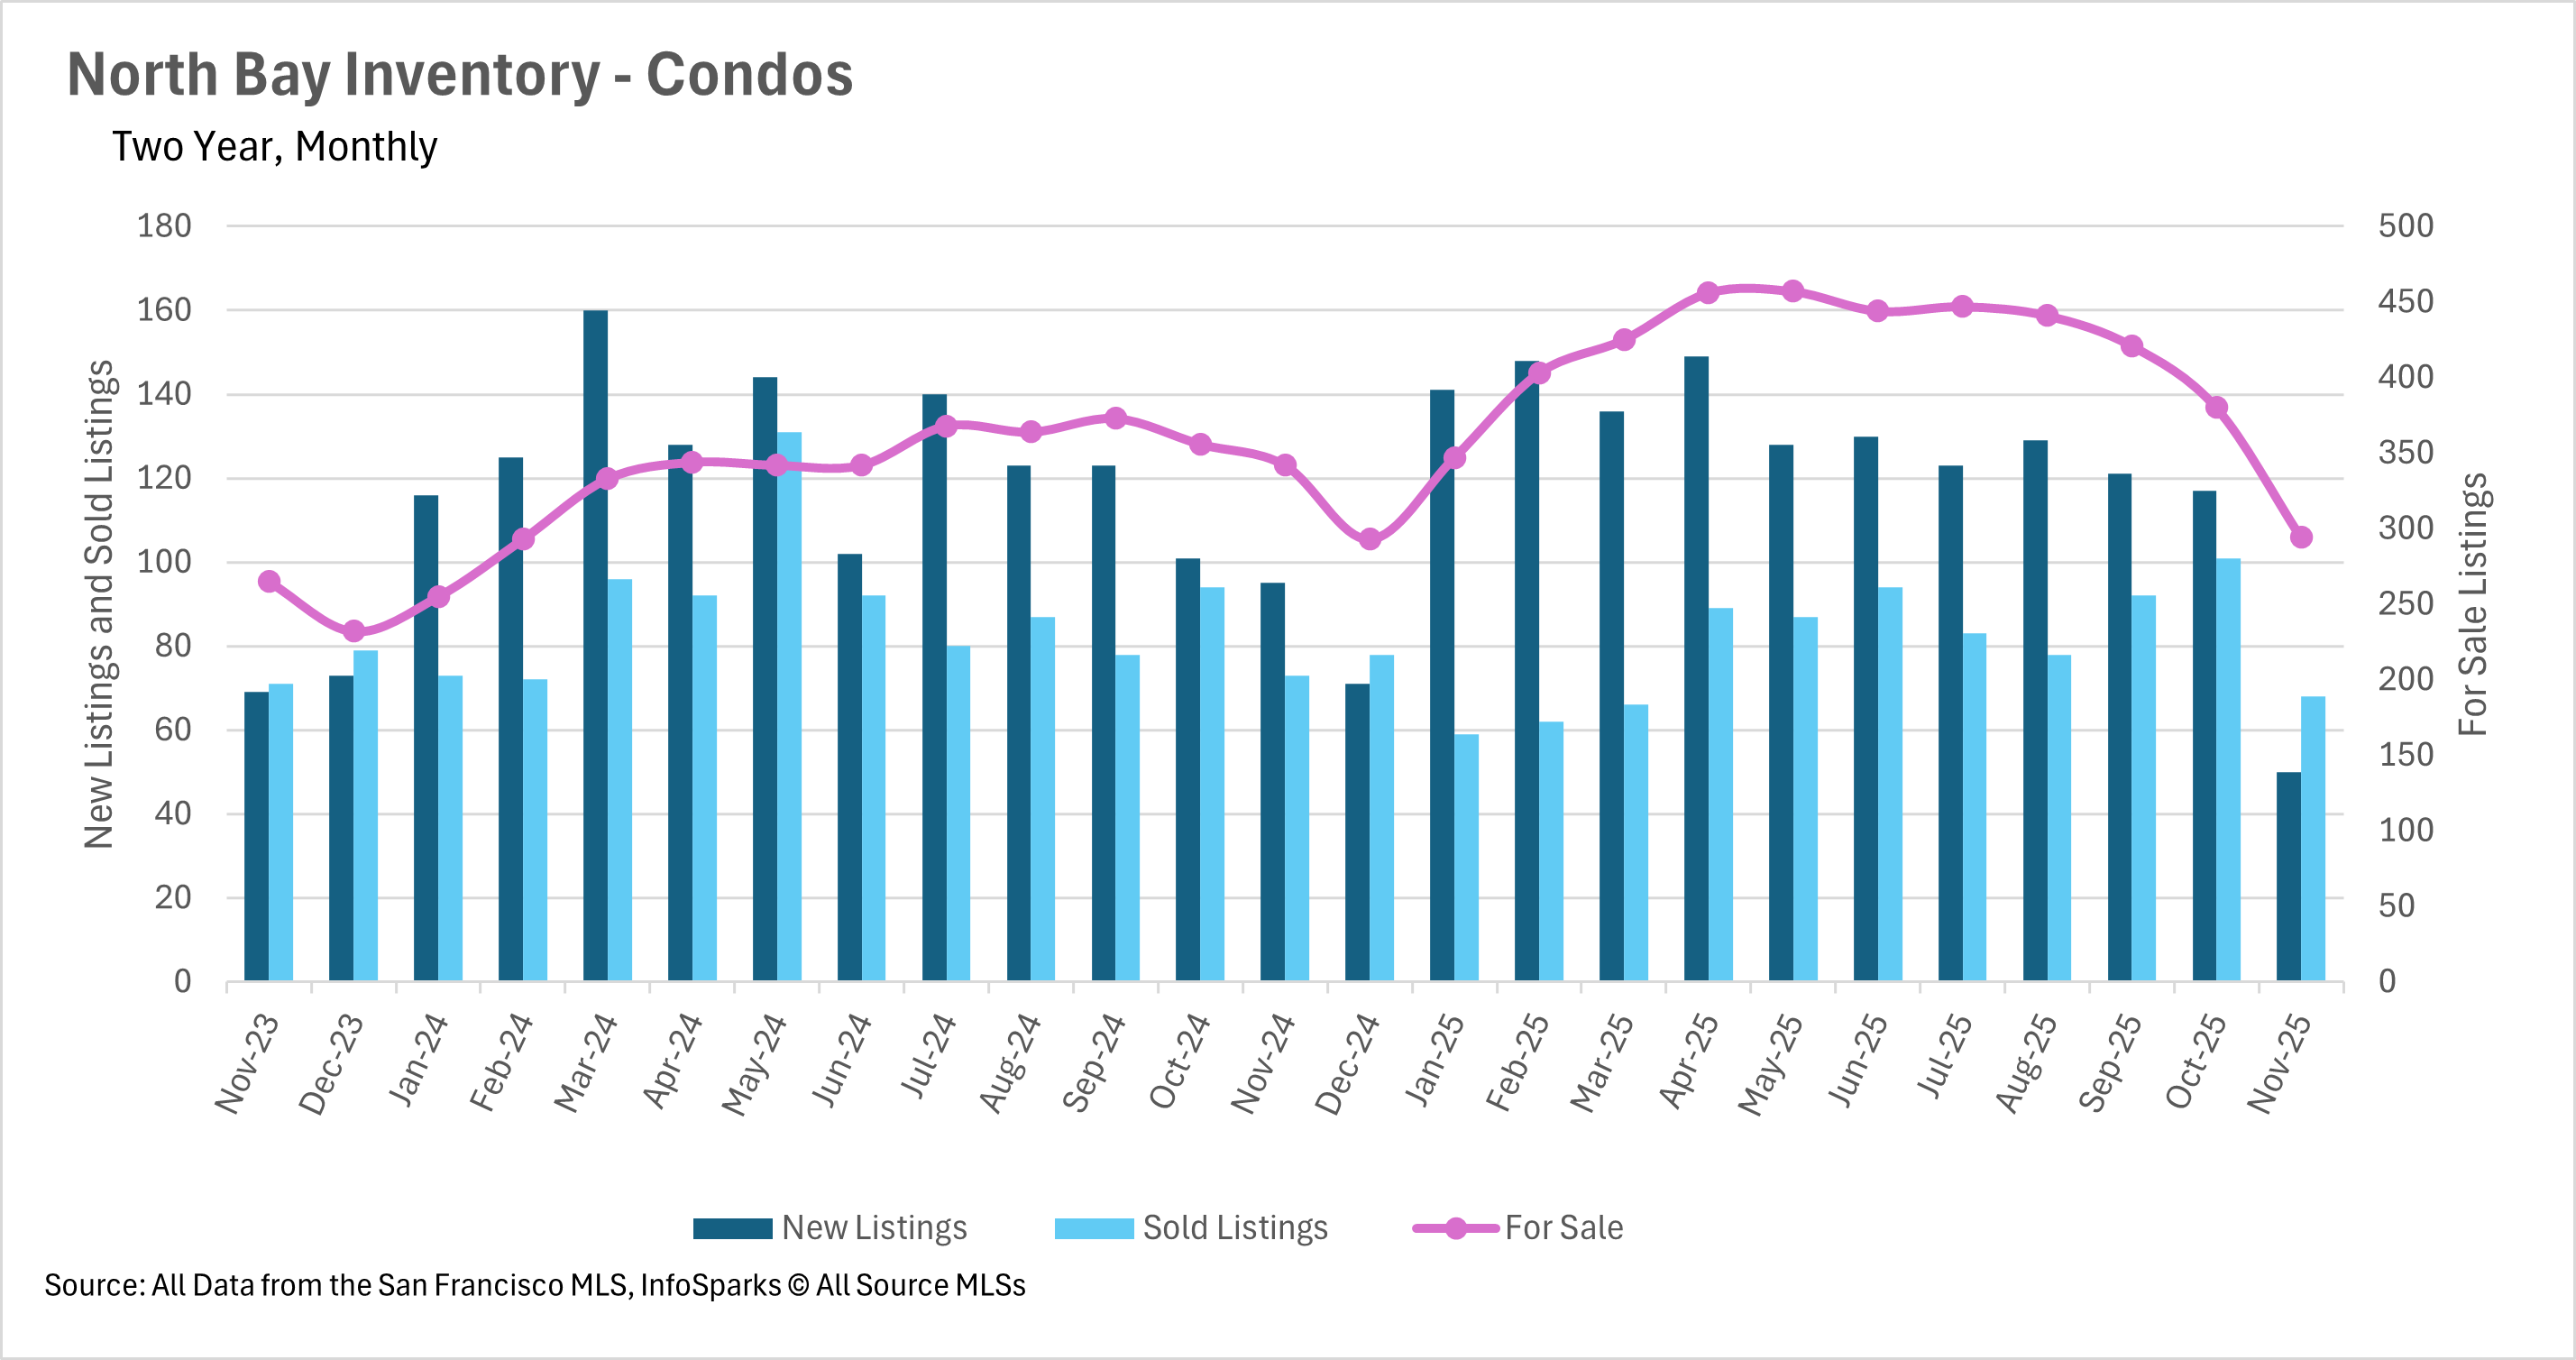
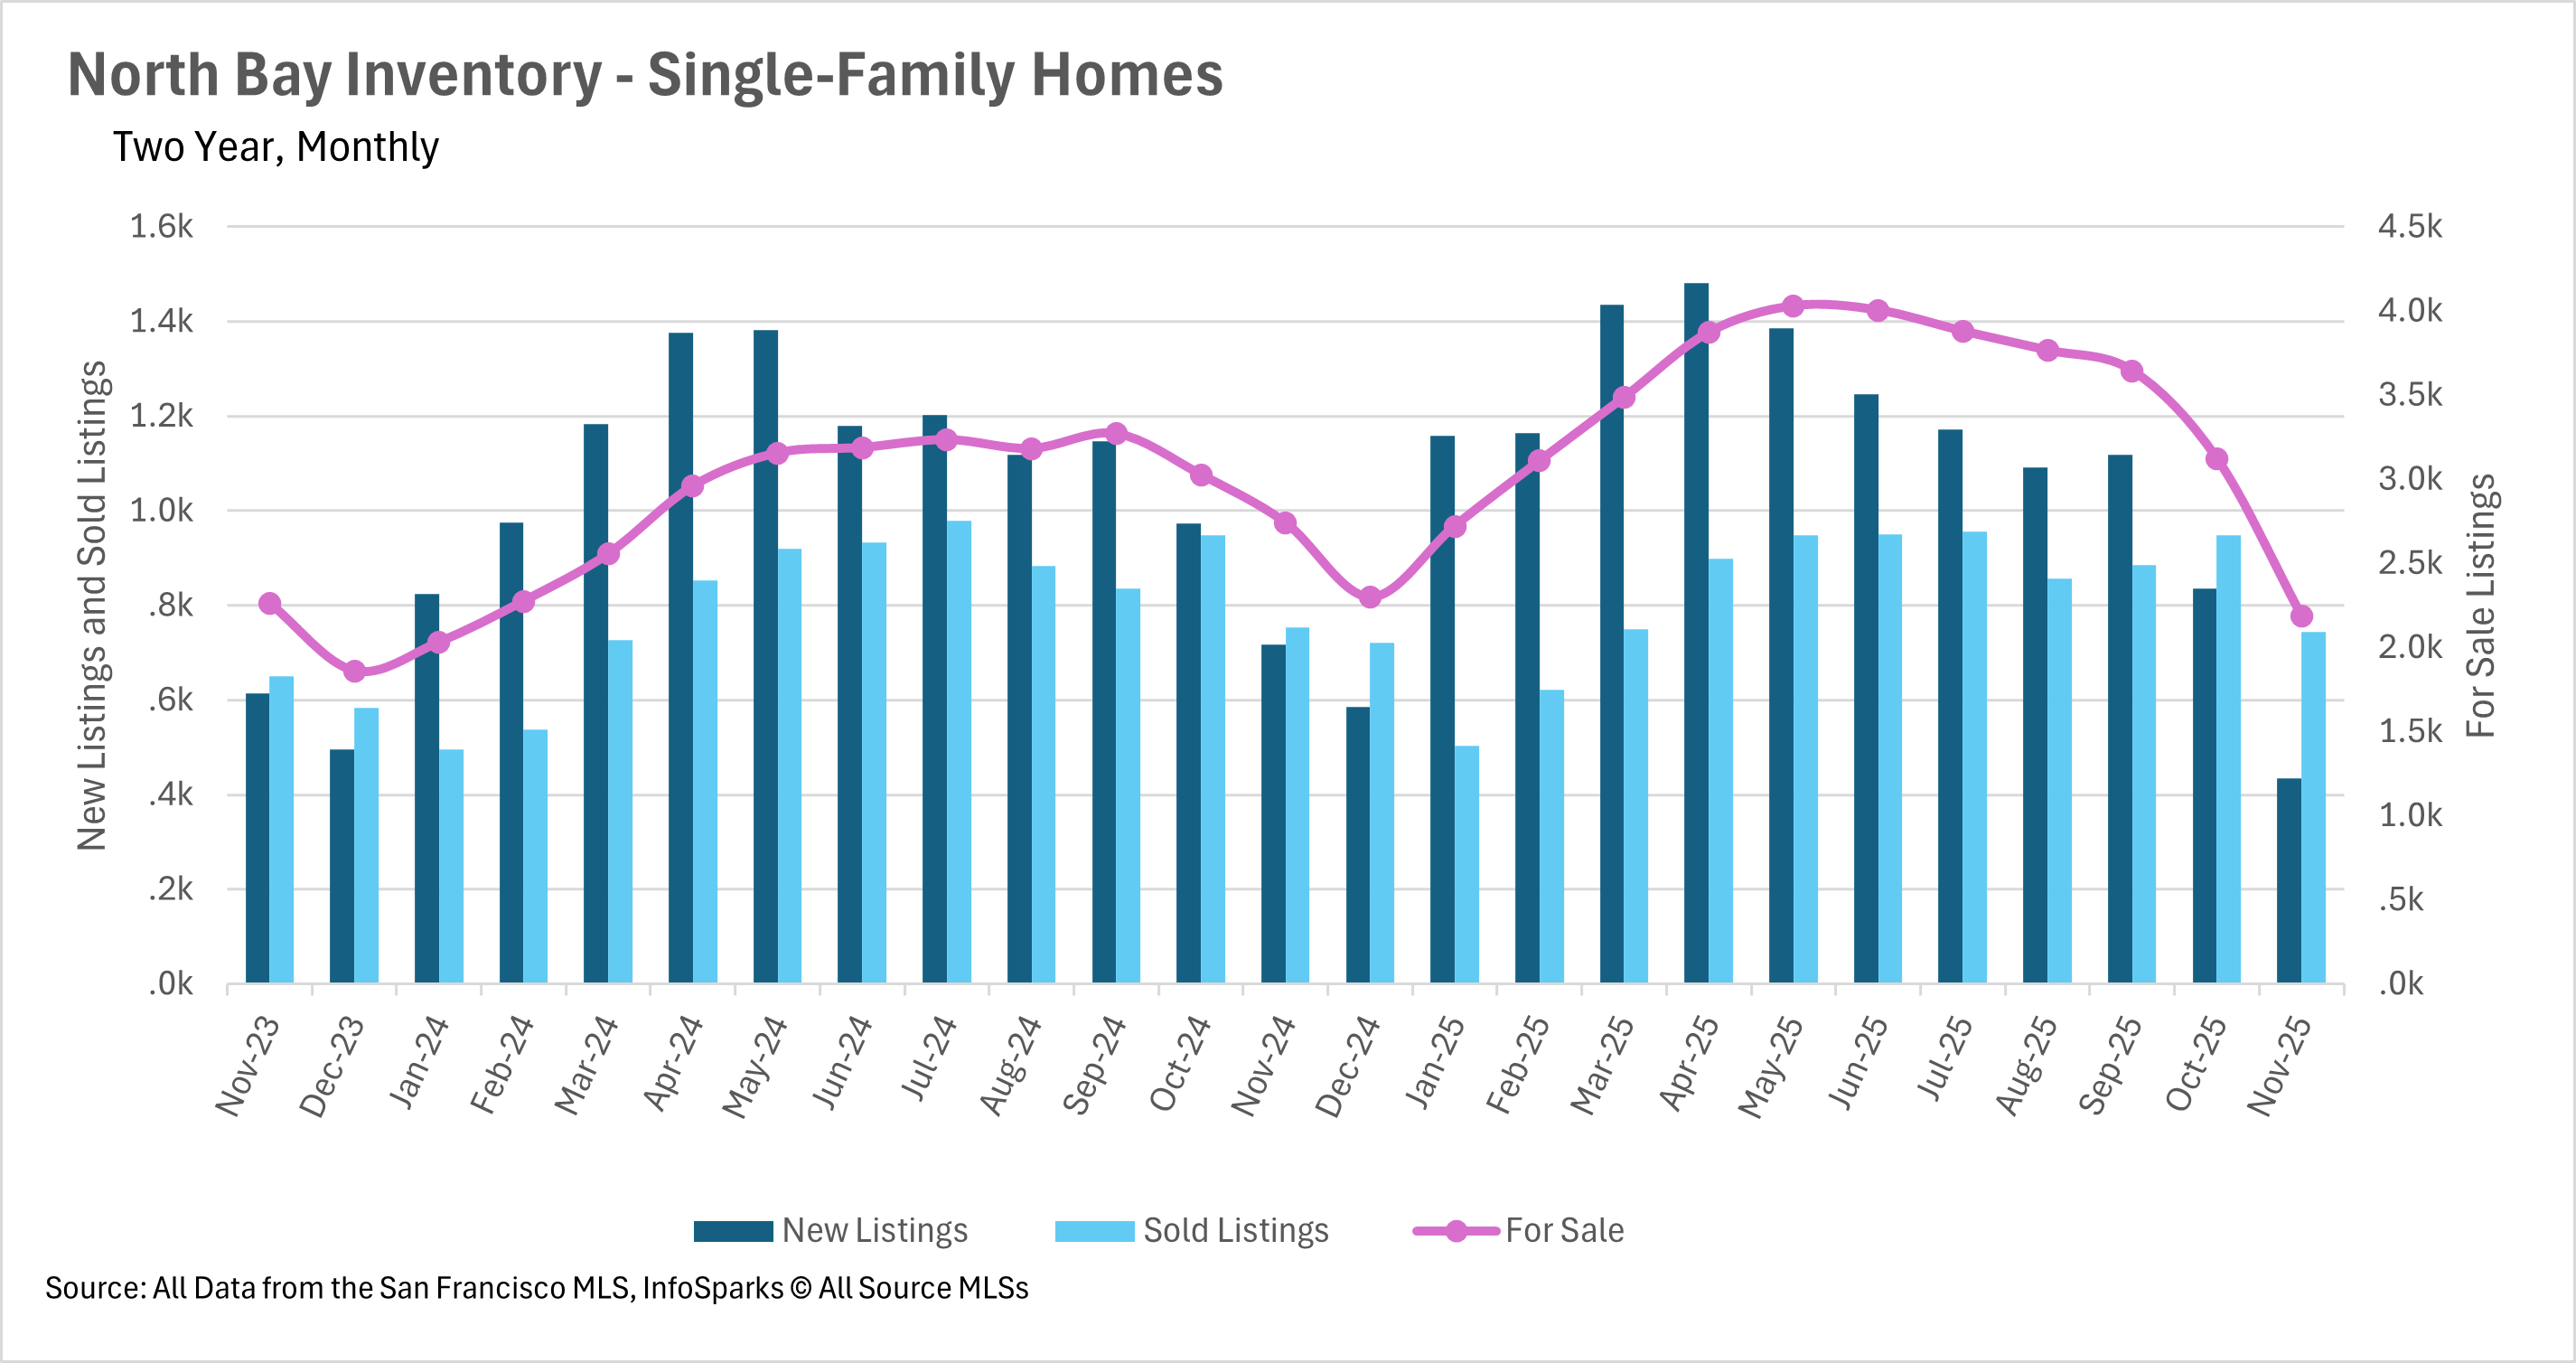
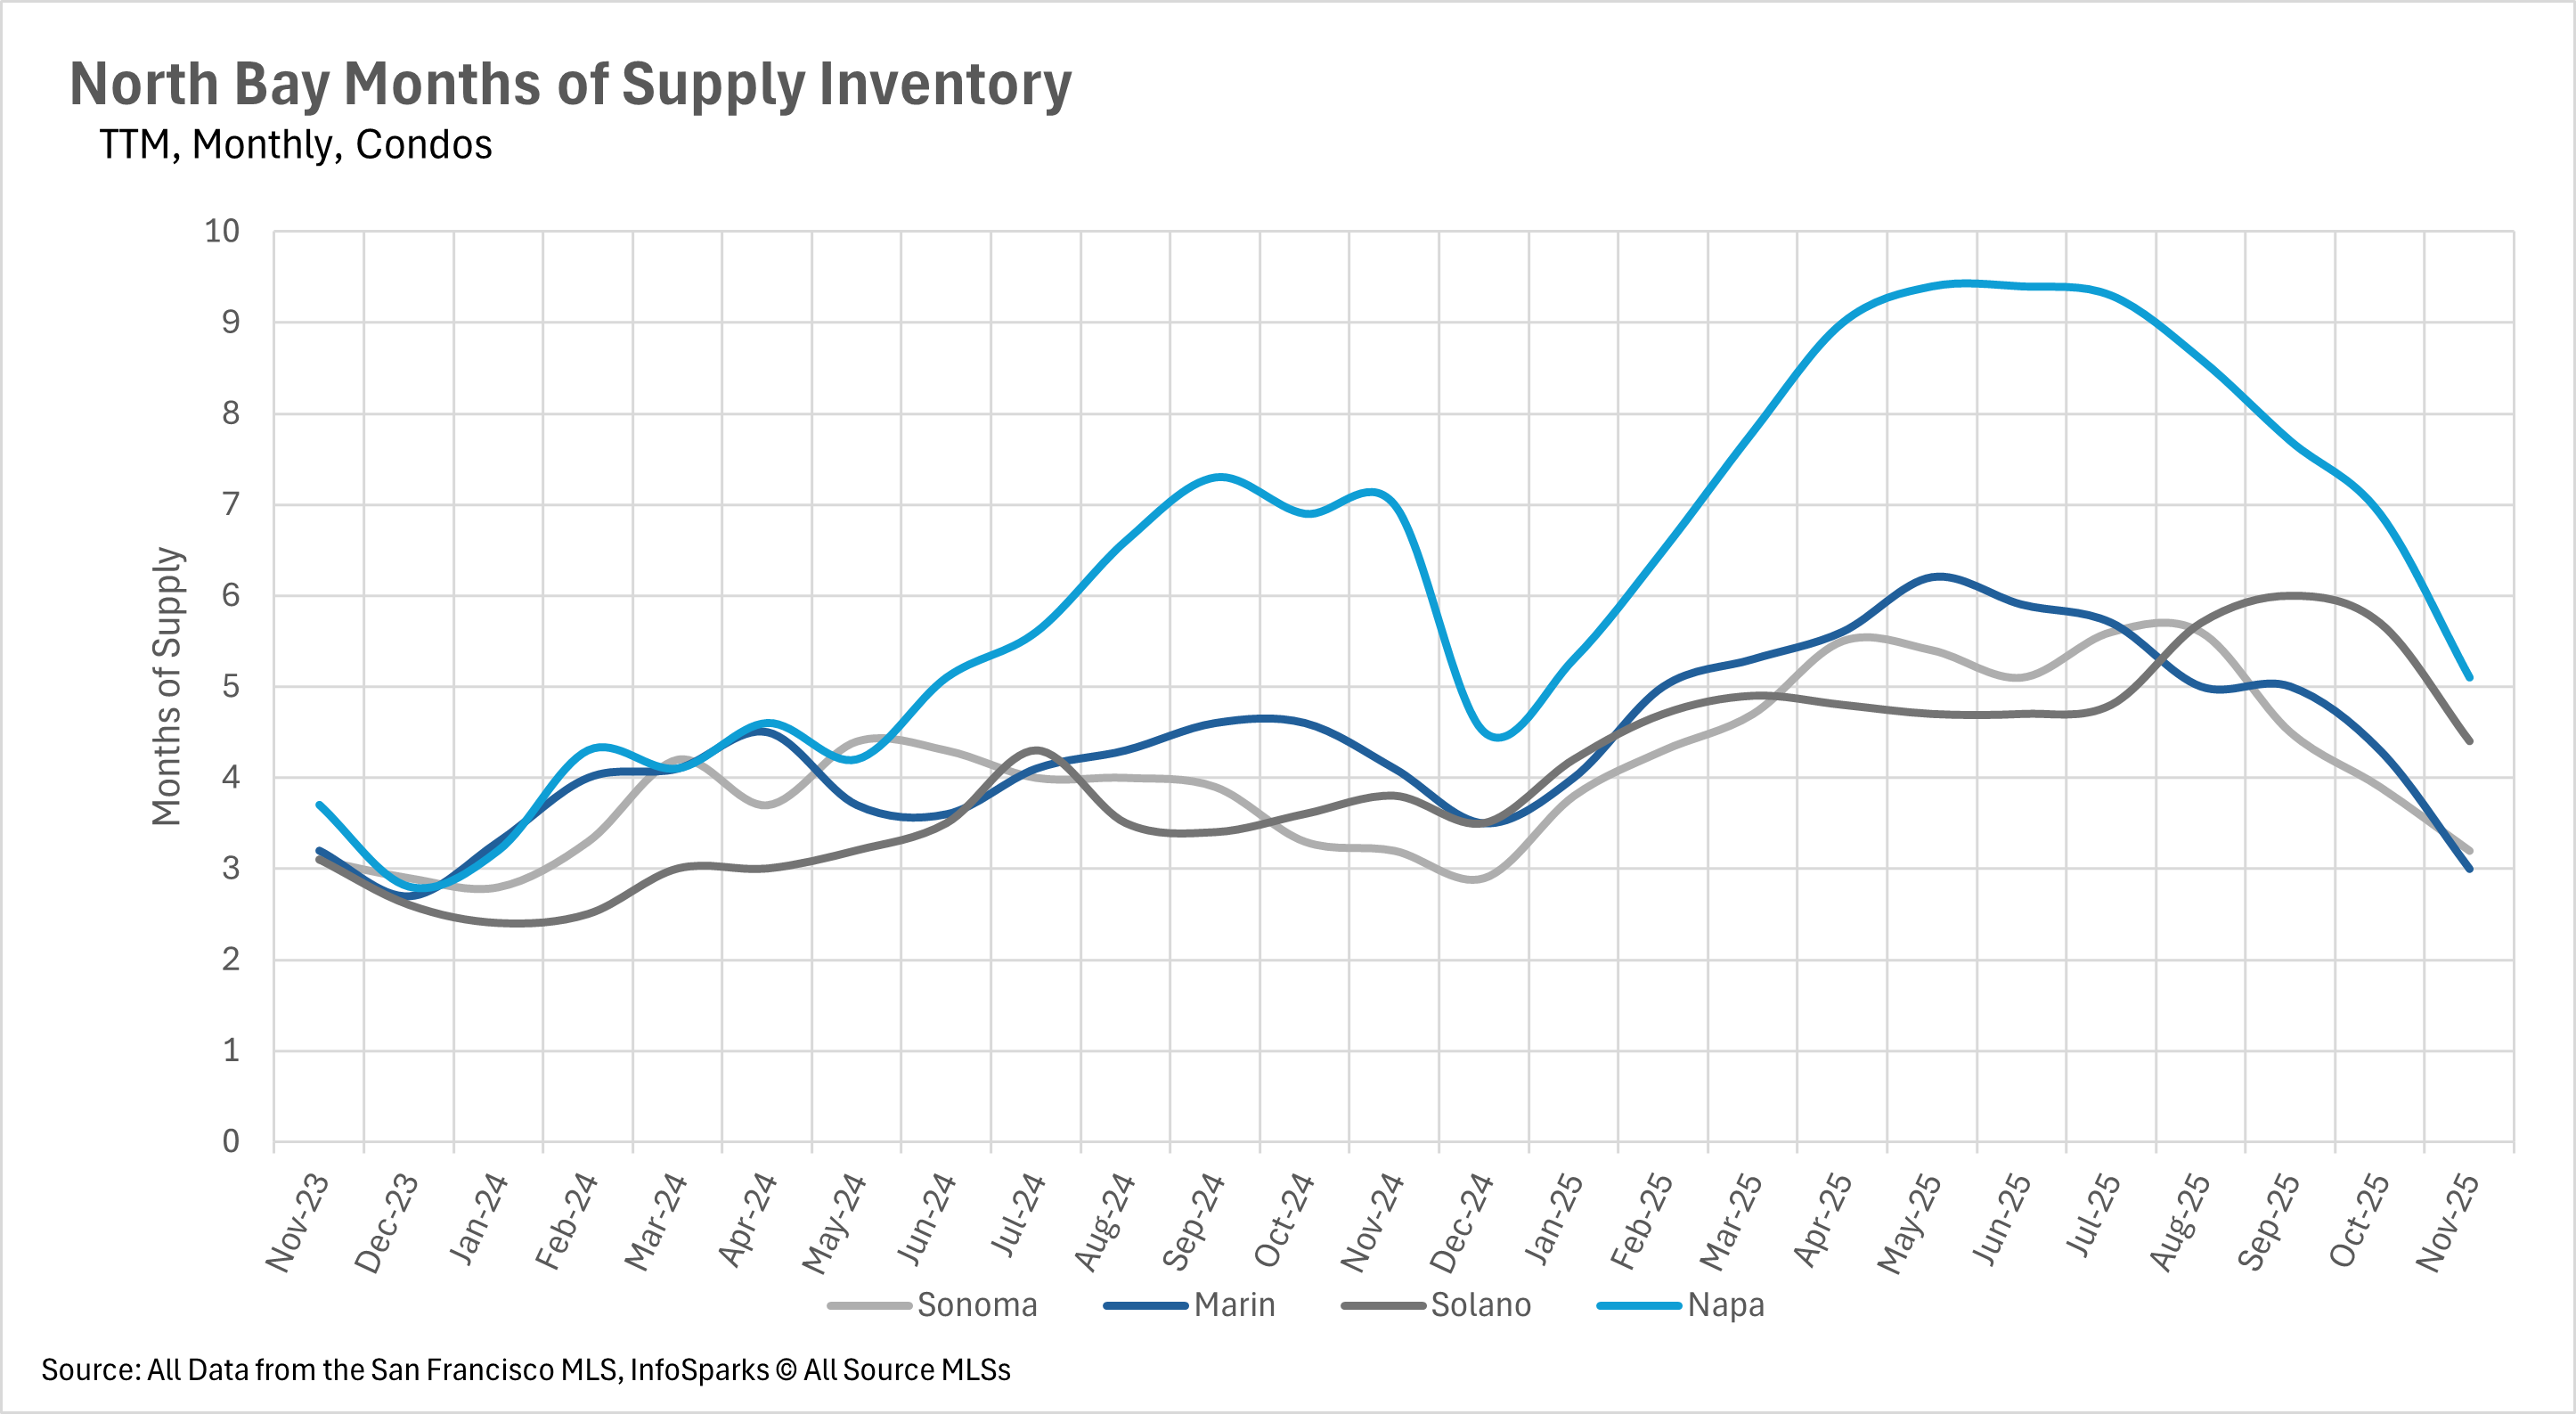
As the Fed continues its rate cuts, inventories remain high...

|
|
|
|
|
|
|
|
|
|
|
|
|
|
|
|
|
|
|
|
|
|
|
|
|
|
|
|
|
|
|
|
|
|
|
Stay up to date on the latest real estate trends.


You’ve got questions and we can’t wait to answer them.